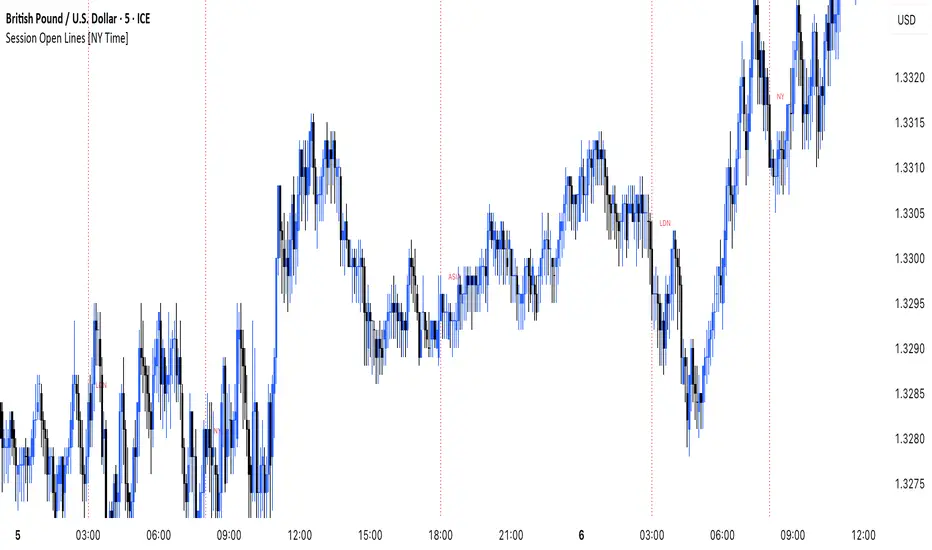
MANI SESSIONSOANDA:GBPUSD This indicator marks the opening times of the three main trading sessions — Asia, London, and New York — using vertical red dotted lines on the chart.
Each session is labeled with a minimal tag (“ASIA”, “LDN”, “NY”) displayed directly on the line for clean and unobtrusive reference.
All session times are based on the New York time zone and adjust automatically for each new day.
This tool helps intraday traders quickly identify session shifts, plan entries around high-volume hours, and stay locked into session-based strategy.
OANDA:GBPUSD
Cari dalam skrip untuk "session"
DM Support / Resistance (USA Session)This indicator is specifically designed for use on the 4-hour time frame and helps traders identify key support and resistance levels during the USA trading session (9:30 AM to 4:00 PM Eastern Time). The indicator calculates important price levels to assist in making well-informed entry and exit decisions, particularly for those focusing on swing trades or longer-term intraday strategies. It also includes a feature to skip setups when relevant fundamental news is scheduled, ensuring you avoid trading during periods of high volatility.
Key Features:
Support and Resistance Levels (S1 & R1):
The indicator calculates and displays Support 1 (S1) and Resistance 1 (R1) levels, which act as key barriers for price action and help traders spot potential reversal or breakout zones on the chart.
Pivot Point (PP):
The Pivot Point (PP) is calculated as the average of the previous period's high, low, and close. It serves as a central reference point for market direction, allowing traders to evaluate whether the market is in a bullish or bearish trend.
Market Bias:
The Bias is shown as a histogram that helps traders assess the strength of the market trend. A positive bias suggests bullish sentiment, while a negative bias signals bearish conditions. This can be used to confirm the overall trend direction.
4-Hour Time Frame:
The indicator is optimized for the 4-hour time frame, making it suitable for traders looking for swing trades or those who wish to capture longer-term trends within the USA session. The key support, resistance, and pivot levels are recalculated dynamically to reflect price action over 4-hour periods.
Dynamic Plotting and Alerts:
Support and resistance levels are drawn as dashed horizontal lines, updating in real-time to reflect the most current market data during the USA session. Alerts can be set for significant price movements crossing these levels.
Stop-Loss Strategy Based on 15-Minute Time Frame:
A unique feature of this indicator is its stop-loss strategy, which uses 15-minute time frame support and resistance levels. When a long or short entry is triggered on the 4-hour chart, traders should place their stop-loss according to the relevant 15-minute support or resistance level.
If the price closes above the 15-minute support for a long entry, or closes below the 15-minute resistance for a short entry, it signals the need to exit or adjust your position based on these levels.
Fundamental News Filter:
To avoid unnecessary risk, the indicator incorporates a fundamental news filter. If there is relevant news scheduled during the USA session, such as high-impact economic data or central bank announcements, the indicator will skip the setup for that period. This prevents traders from entering positions during times of elevated volatility caused by news events, which could result in unpredictable price movements.
How to Use:
Long Entry: When the Bias is positive and the price breaks above Support 1 (S1), this signals a potential bullish move. Consider entering a long position at this point.
Stop-Loss Strategy: Set your stop-loss at the respective 15-minute support level. If the price closes below this level, it could signal a reversal, prompting you to exit the trade.
Short Entry: When the Bias is negative and the price breaks below Resistance 1 (R1), this signals a potential bearish move. Enter a short position at this point.
Stop-Loss Strategy: Set your stop-loss at the respective 15-minute resistance level. If the price closes above this level, exit the short trade as it could indicate a bullish reversal.
Pivot Point (PP): The Pivot Point serves as a reference level to gauge potential price reversals. A move above the PP suggests a bullish bias, while trading below the PP suggests a bearish outlook.
Bias Histogram: The Bias Histogram helps confirm trend direction. A positive bias confirms long positions, while a negative bias reinforces short trades.
Avoid Trading During High-Impact News: If there is significant economic news or fundamental events scheduled during the USA session, the indicator will automatically skip any potential setup. This feature ensures you avoid entering trades that might be affected by unexpected news-driven volatility, keeping your trading strategy safer and more reliable.
Why Use This Indicator:
The 4-hour time frame is ideal for traders who prefer swing trading or those looking to capture longer-term trends in a structured manner. This indicator provides crucial insights into market direction, support/resistance levels, and potential entry/exit points.
The stop-loss management based on the 15-minute support and resistance levels helps traders protect their positions from sudden price reversals, ensuring more precise risk management.
The fundamental news filter is particularly useful for avoidance of high-risk periods. By skipping setups during high-impact news events, traders can avoid entering trades when price volatility could be unpredictable.
Overall, this indicator is a powerful tool for traders who want to make data-driven decisions based on technical analysis while ensuring that their positions are managed responsibly and avoiding news-driven risk.

Kviateq - Session Opening RangesThis indicator plots the opening range for each of the market sessions.
Users can chose the length of the opening range, as well as change the time for each of the sessions.
This script is based on opening range breakout strategies, which entail taking a long/short depending on which way the price breaks out.
To trade it, we wait for the session opening range to print, and then we enter upon a candle close.
It's meant to be used on lower timeframes, ideally one hour or lower.
It can be used by itself, but it works even better in combination with other indicators, like moving averages.
Enjoy
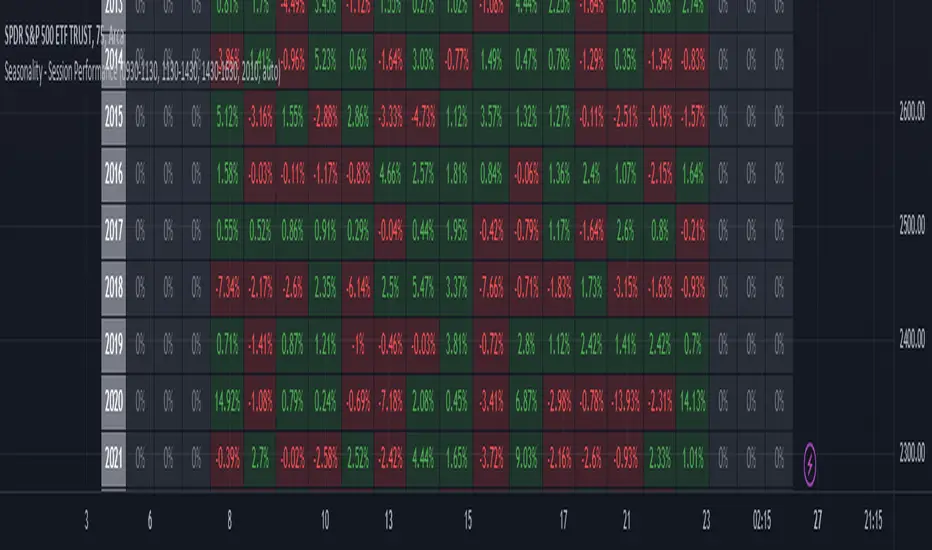
Seasonality - Session Performance - Morning Afternoon EveningUse this indicator on Intraday Timeframe. Higher the timeframe, more the data
This script calculates the performance of an instrument for different sessions.
Session inputs can be updated to study performance of
- Morning vs Afternoon vs Evening
- Pre-Market vs Market vs Post-Market (provided the data feed supports pre and post market)
- Overnight vs Intraday
Three session inputs are provided to tweak the session range
Performance is calculated as session close / session open - 1
Session timeframes can be set for various countries. Make sure the session timeframe aligns with the Candle open/close for the timeframe you choose. Some examples below
US Markets: 0930-1130 1130-1430 1430-1630 Timeframe 1 hour
India Markets: 0915-1030 1030-1415 1415-15:30 Timeframe 75min
Market Sessions Day & Candles JRA V2.0Market Sessions Day & Candles JRA V2.0
This indicator will allow you to:
- Create boxes for the Market Hours for:
'♯1 SESSION TOKYO'
'♯2 SESSION LONDON'
'♯3 SESSION NEW YORK'
You will be able to change the Hours depending your TimeFrame
You will be able to extend the boxes for the Market Hours and Have Fibonacci Levels on it.
- With every one of it you can change the style of Box for the Market Hours
- You can show Labels for the Market hours as well other options like Price or Pips
- Show the Candles for the TimeFrames depending your settings
- You can change the Candles settings to be Candle or Bar
- Candle Resolution on Timeframe
-Maximum candles to Display
-Show or Unshown Timeframes Candles
-Change colors on candles
Every option has a Tip to understand the function to it

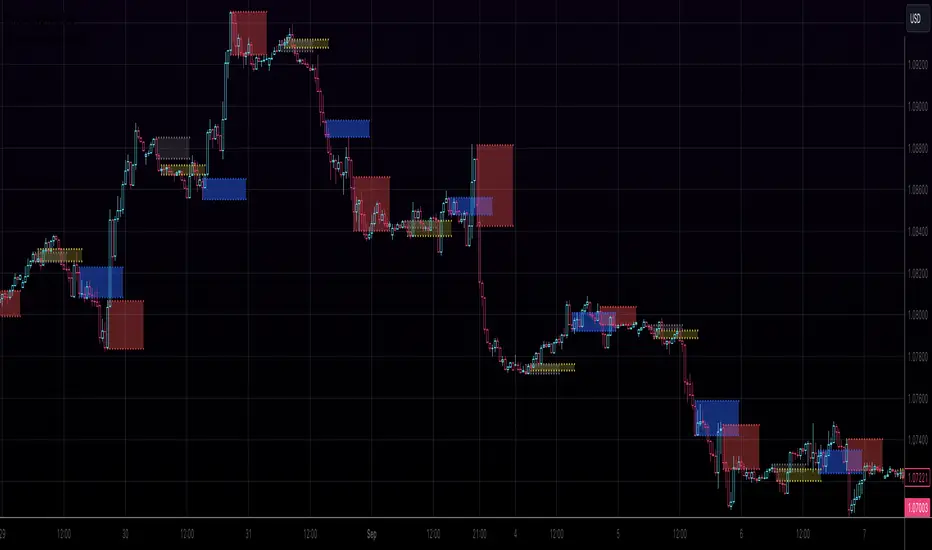
High & Low Of Custom SessionThis script boxes a custom session and sets the box at the high and low of the session and draws that box to the next session.
Box color is determined by price in relation to the box position. Box color is set at the start of the next session. This allows
user to lookback at multiple box sets to see how each day closed in relation to the session highlighted.
I have written this for backtesting purposes and intend to expand it to use with volume analysis and gradient color to change the box color based on how many times price tests
the box.
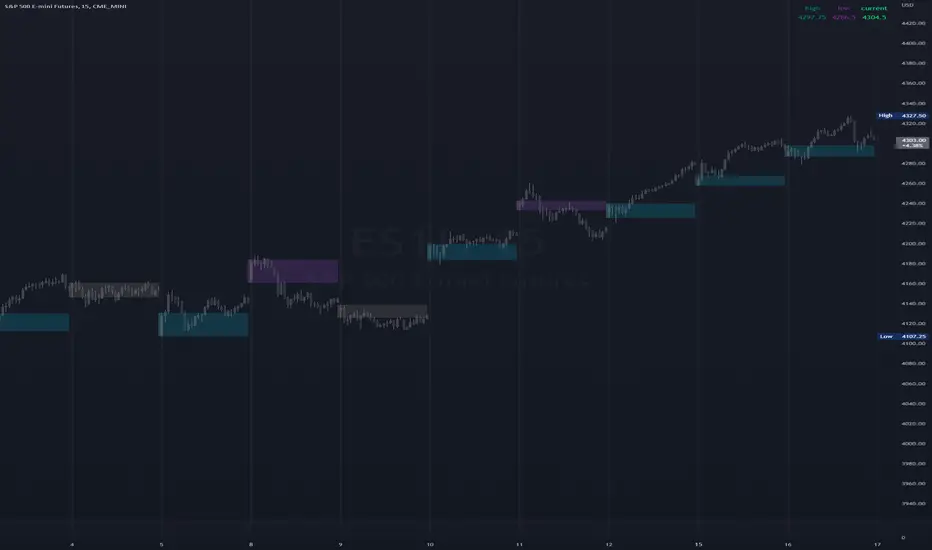
Market Profile with Past SessionsThis script plots market profiles that show the amount of time price has remained at a particular level during past sessions, often referred to as "time price opportunity".
TV user @LonesomeTheBlue created the original Market Profile indicator on which this script is based. This version makes minor changes to the automatic timeframes, and to show historic market profiles and points of control.
The market profile drawing begins at the START of the relevant session being profiled and extends to the right. There is a checkbox in the options that will plot the market profile at the END of the relevant session, if desired.
If you want to view the market profiles for shorter or longer sessions, use the drop down menu to take the Higher Time Frame setting off "Auto", and instead select a specific time interval that is HIGHER than the timeframe your chart is showing.
The market profile and points of control can be used to identify areas likely to serve as potential support or resistance, as well areas where price is likely to retest when it is ranging.

Michael Ultimate Open session/sentiment.Overview This indicator is a precision tool designed for intraday traders who need a complete overview of market time and structure in a single, compact panel. It combines Session Liquidity Levels with Multi-Timeframe Trend Analysis, allowing you to spot alignments between session ranges and the broader market direction instantly.
Key Features
1. Advanced Session Tracking The dashboard monitors three key trading sessions with custom operational hours:
Asia (23:00 - 06:00): Captures the overnight range.
London (08:00 - 11:00): Focuses on the European open volatility.
New York (14:30 - 16:30): Targets the US market overlap.
For each session, the dashboard calculates and displays real-time data:
High & Low: Crucial for liquidity sweeps and breakout targets.
Midpoint: The equilibrium level of the session, often acting as dynamic support/resistance.
Status: A visual "Traffic Light" (🟢 Open / 🔴 Closed) indicating if the specific window is currently active.
2. Multi-Timeframe Trend Correlation Instead of a generic trend filter, this tool links each session to a relevant higher timeframe to provide context:
Asia Row ➔ Daily Trend (D1): Shows the macro bias.
London Row ➔ 4-Hour Trend (H4): Shows the structural bias.
New York Row ➔ 15-Minute Trend (M15): Shows the immediate execution momentum.
3. Visual Logic & Design
EMA 50 Strategy: Trends are determined by price action relative to the 50 EMA (Green = Bullish, Red = Bearish).
Modern UI: Features a sleek, dark-themed aesthetic with semi-transparent backgrounds to keep your chart clean and professional.
Instant Read: Uses color-coded icons (🟢/🔴) so you can assess market conditions in milliseconds.
How to Use Use this dashboard to find confluence. For example, if the London Session opens while the H4 Trend is Bullish (Green), look for buy setups near the Asia Midpoint or Asia Low.
Settings
Fully customizable session times.
Adjustable EMA length (Default: 50).
Table position and size can be modified to fit your screen.

Trading Sessions (London / New York / Tokyo / Sydney)Trading sessions for all assets with (time zone) adjustable trading sessions.

EDUVEST QQE Grade System - S/A/B/C Signal ClassificationEDUVEST QQE Grade System - S/A/B/C Signal Classification
━━━━━━━━━━━━━━━━━━━━━━━━━━━━━━━━━━━━━━━━━━━━━━━━
█ ORIGINALITY
This indicator introduces a unique grading system (S/A/B/C) for QQE signals, combining traditional QQE analysis with SMC (Smart Money Concepts) price zones and trading session filters. Unlike standard QQE indicators that show all signals equally, this version classifies signals by quality to help traders focus on the highest probability setups.
━━━━━━━━━━━━━━━━━━━━━━━━━━━━━━━━━━━━━━━━━━━━━━━━
█ WHAT IT DOES
- Generates BUY/SELL signals with S/A/B/C grade classification
- Automatically detects asset type and applies optimized QQE factors
- Integrates SMC price zones (support/resistance) for grade enhancement
- Filters signals by trading session time
- Displays real-time session and market status
Grade Hierarchy:
- S (Gold/Orange): Signal near SMC zone + active trading hours - Highest quality
- A (Green/Red): Score 70+ during trading hours - High quality
- B (Darker): Score 50-69 during trading hours - Medium quality
- C (Gray, small): Outside trading hours or weak signal - Low quality
━━━━━━━━━━━━━━━━━━━━━━━━━━━━━━━━━━━━━━━━━━━━━━━━
█ HOW IT WORKS
【QQE Core Calculation】
The QQE (Quantitative Qualitative Estimation) is calculated as:
1. RSI with configurable period (default: 14)
2. EMA smoothing of RSI (Smoothing Factor: 5)
3. Dynamic bands using Wilder's smoothing: RSI ± (ATR of RSI × QQE Factor)
QQE Factor is auto-adjusted per asset:
- USD/JPY: 4.238
- EUR/USD: 3.8
- Gold (XAU/USD): 8.0
- NASDAQ/US100: 9.0
【Signal Generation】
- BUY: QQE line crosses above its trailing stop (QQExlong == 1)
- SELL: QQE line crosses below its trailing stop (QQExshort == 1)
【Internal Scoring System】
Score components (0-100):
- Signal Base: +25 points when signal occurs
- QQE Strength: +10 to +20 based on RSI distance from 50
- Volatility: +15 (optimal ATR ratio 1.1-2.0), -10 (low volatility)
- Volume Confirmation: +10 (high volume), -5 (low volume)
- Session Bonus: +5 during London/NY sessions
- Base: +20 points
【Grade Assignment】
- Grade S: Signal near user-defined SMC price zone (within tolerance %) AND during trading hours
- Grade A: Internal score >= 70 AND during trading hours
- Grade B: Internal score >= 50 AND during trading hours
- Grade C: Outside trading hours OR score < 50
【SMC Price Zone Integration】
Users can set support/resistance levels for each asset. When price is within the tolerance percentage of these levels, signals are upgraded to S-grade, indicating confluence with institutional price levels.
【Trading Session Filter】
Configurable active trading hours (JST timezone):
- Default: 15:00 - 01:00 JST (London + NY overlap)
- Signals outside this window receive C-grade
━━━━━━━━━━━━━━━━━━━━━━━━━━━━━━━━━━━━━━━━━━━━━━━━
█ HOW TO USE
【Recommended Settings】
- Timeframe: 15M, 1H, 4H
- Best on: USD/JPY, EUR/USD, Gold, NASDAQ
- Focus on: S and A grade signals
【Trading Strategy】
- S-Grade (Gold/Orange): Highest conviction - consider larger position
- A-Grade (Green/Red): Strong signal - standard position
- B-Grade: Valid but use additional confirmation
- C-Grade: Avoid or use minimal size
【Setting Up SMC Zones】
1. Identify key support/resistance on higher timeframe
2. Input prices in SMC Price Settings
3. Adjust tolerance % (default: 0.15%)
4. S-grade appears when signal occurs near these levels
【Info Panel】
Top-right panel shows:
- Asset name and detection mode (Auto/Manual)
- Current session (Tokyo/London/NY)
- Trading hours status
- SMC zone proximity
【Alert Setup】
1. Enable alerts in settings
2. Create alert with "Any alert() function call"
3. Alerts include grade, price, and session info
━━━━━━━━━━━━━━━━━━━━━━━━━━━━━━━━━━━━━━━━━━━━━━━━
█ SETTINGS
Basic Settings:
- Enable Alerts: Turn on/off notifications
- Time Filter: Activate trading hour filter
- Start/End Hour: Define active trading window (JST)
QQE Settings:
- RSI Period: RSI calculation period
- RSI Smoothing: EMA smoothing factor
- Auto QQE Factor: Auto-detect optimal factor per asset
- Manual QQE Factor: Override when auto is disabled
SMC Price Settings:
- Support/Resistance levels for each asset
- Tolerance %: How close to SMC line for S-grade
Display Settings:
- Grade Only: Hide QQE lines, show only signals
- Show SMC Lines: Display support/resistance on chart
- Show Debug: Display asset detection info
━━━━━━━━━━━━━━━━━━━━━━━━━━━━━━━━━━━━━━━━━━━━━━━━
█ CREDITS
QQE concept originally developed by John Ehlers.
SMC (Smart Money Concepts) integration and grading system by EduVest.
License: Mozilla Public License 2.0

EDUVEST UTBOT ADJ - Adaptive ATR Trailing StopEDUVEST UTBOT ADJ - Adaptive ATR Trailing Stop with Session-Based Sensitivity
━━━━━━━━━━━━━━━━━━━━━━━━━━━━━━━━━━━━━━━━━━━━━━━━
█ ORIGINALITY
This indicator is an enhanced version of the classic UT Bot concept, featuring automatic session-based ATR sensitivity adjustment. Unlike the original UT Bot which uses a fixed sensitivity value, this version dynamically adapts to different trading sessions (Tokyo, London, New York) and automatically detects asset characteristics to optimize signal generation.
━━━━━━━━━━━━━━━━━━━━━━━━━━━━━━━━━━━━━━━━━━━━━━━━
█ WHAT IT DOES
- Generates BUY and SELL signals based on ATR trailing stop crossovers with a moving average
- Automatically adjusts sensitivity based on current trading session (Tokyo/London/NY)
- Auto-detects asset type and applies optimized parameters for each instrument
- Displays real-time session information and volatility status
- Provides alert functionality with customizable cooldown periods
━━━━━━━━━━━━━━━━━━━━━━━━━━━━━━━━━━━━━━━━━━━━━━━━
█ HOW IT WORKS
【Core Logic: ATR Trailing Stop】
The indicator calculates an ATR-based trailing stop using the formula:
Trailing Stop = Price ± (Sensitivity × ATR)
When price is above the trailing stop and rising, the stop trails below price.
When price is below the trailing stop and falling, the stop trails above price.
【Signal Generation】
- BUY Signal: Price crosses above the trailing stop AND Moving Average crosses above the trailing stop
- SELL Signal: Price crosses below the trailing stop AND Moving Average crosses below the trailing stop
【Session-Based Sensitivity Adjustment】
The indicator adjusts ATR sensitivity based on trading session (JST timezone):
- Tokyo (08:00-15:00): Lower sensitivity (reduced by adjustment value) - typically quieter markets
- London (15:00-23:00): Base sensitivity - moderate volatility
- New York (23:00-08:00): Higher sensitivity (increased by adjustment value) - higher volatility
【Dynamic ATR Adjustment】
When enabled, the indicator compares current ATR to its smoothed average:
- ATR Ratio = Current ATR / SMA(ATR, smoothing period)
- Volatility Multiplier = 1.0 + (Sensitivity × (2.0 - ATR Ratio))
This reduces sensitivity during high volatility (fewer false signals) and increases sensitivity during low volatility (faster response).
【Auto Asset Detection】
The indicator automatically detects the traded instrument and applies optimized parameters:
- Stable pairs (USDJPY, EURUSD, USDCHF): Base sensitivity 1.5-1.8
- Moderate pairs (AUDUSD, USDCAD, EURJPY): Base sensitivity 2.0-2.3
- Volatile pairs (GBPUSD): Base sensitivity 2.8
- Commodities (GOLD/XAUUSD): Base sensitivity 3.5
- Indices (NASDAQ/NAS100): Base sensitivity 4.0
━━━━━━━━━━━━━━━━━━━━━━━━━━━━━━━━━━━━━━━━━━━━━━━━
█ HOW TO USE
【Recommended Settings】
- Timeframe: 15 minutes or higher (15M, 1H, 4H recommended)
- Best performance on: Forex majors, Gold, NASDAQ
- Enable "Auto Asset Detection" for optimized parameters
【Entry Rules】
- BUY: Enter long when green BUY label appears
- SELL: Enter short when pink SELL label appears
【Session Panel】
The top-right panel displays:
- Current trading session (Tokyo/London/NY)
- Volatility status (High Chance/Medium Chance/Caution)
- Mode (AUTO/MANUAL)
【Alert Setup】
1. Enable "Viewer Alert Display" in settings
2. Set cooldown period (default: 15 minutes) to avoid signal spam
3. Create alert with "Any alert() function call" condition
【Important Notes】
- This indicator does not repaint - signals are confirmed at bar close
- Lower timeframes (1M, 5M) may generate excessive signals
- Always use proper risk management and confirm with other analysis
━━━━━━━━━━━━━━━━━━━━━━━━━━━━━━━━━━━━━━━━━━━━━━━━
█ SETTINGS OVERVIEW
🎯 Alert Settings
- Viewer Alert Display: Enable/disable alert labels
- Cooldown Function: Prevent rapid consecutive signals
- Cooldown Time: Minutes between alerts (5-60)
🔧 Dynamic ATR Settings
- Enable Dynamic ATR: Auto-adjust based on volatility
- ATR Period: Calculation period (default: 14)
- ATR Smoothing: Smoothing period for ratio calculation
- Volatility Sensitivity: How much to adjust (0.1-1.0)
🕐 Session ATR Adjustment
- Enable Time Adjustment: Session-based sensitivity
- Show Session Info: Display session panel
📊 Asset Settings
- Auto Asset Detection: Automatically optimize for instrument
- Manual settings available when auto-detection is disabled
━━━━━━━━━━━━━━━━━━━━━━━━━━━━━━━━━━━━━━━━━━━━━━━━
█ CREDITS
Based on the original UT Bot concept by QuantNomad.
Enhanced with session-based adaptation and auto-asset detection by EduVest.
License: Mozilla Public License 2.0

Apex ICT Delivery & Session Flow ProDescription
The Apex ICT Delivery & Session Flow Pro is a high-precision technical analysis indicator designed for inner-circle traders who prioritize a clean, institutional-grade chart. This script specializes in identifying real-time liquidity levels and displacement zones while utilizing an automated "Cleanup Engine" to ensure that only the most relevant, unmitigated data remains visible.
Core Functionalities
Multi-Timeframe Displacement Engine: The script scans across multiple timeframes (1m, 5m, 15m, 1H) to identify Fair Value Gaps (FVG) created by high-displacement price action. It automatically plots the FVG boxes and the 50% Consequent Encroachment (CE) line for precise entry and target mapping.
Dynamic Session Liquidity: Automatically identifies and tracks the Highs and Lows of the Asia, London, and New York sessions. These levels are explicitly labeled and extended to act as magnet levels for price or points of liquidity reversal.
CISD (Change in State of Delivery): Visualizes shifts in order flow by marking the opening prices of the last opposite candle when price action confirms a change in delivery state. This provides immediate visual feedback on market sentiment shifts.
NY-Specific VWAP: Features a strict New York Session VWAP that resets daily at the NY open (08:00). This serves as the "Mean" for the session, helping traders identify premium and discount zones specifically within the high-volume New York hours.
The "Clean Chart" Cleanup Engine: Unlike standard indicators that clutter the screen with historical data, this script features an intelligent removal system:
FVGs & Order Blocks: Automatically deleted once price trades through them or if they move too far from current price (Proximity Filter).
Broken Session Levels: Highs and Lows are instantly removed once they are breached by price.
Temporal Decay: CISD markers are automatically cleared after 20 candles to keep the focus on immediate delivery.

Gold Asia Session Highlighter [IST]Here is a polished description and guide for your Gold Asia Session Highlighter. You can use this text for a YouTube description, a Telegram post, or a PDF guide to explain the tool to others.
Gold Asia Session Highlighter (IST) | Visual Indicator
This is a custom TradingView indicator designed to simplify the Gold Asia Strategy. Instead of automating trades, this tool purely handles the visuals. It automatically highlights the correct Asia Session time window (adjusting for Winter/Summer hours) and marks the exact points where you should draw your Fixed Range Volume Profile (FRVP) tool.
Perfect for: Traders who prefer to draw their own FRVP levels manually but want to ensure they are using the exact, error-free time range every single day.
Features
✅ Automatic Time Zone: Strictly calculated using IST (Indian Standard Time), so you don't need to convert time zones manually.
✅ Smart Season Detection: Automatically switches between Winter Session (04:30 – 06:25) and Summer Session (03:30 – 05:25) based on the current month.
✅ Visual Guidance: Highlights the session background and places "START" and "END" labels on the exact candles.
✅ Zero Clutter: Clean visuals with no moving averages or strategy lines—just the session box.
How to Use It
Add to Chart: Apply the script to your Gold (XAUUSD) 5-minute chart. You will see a blue highlighted box appear during the Asia session.
Locate the Labels:
Look for the blue START label (bottom of the candle).
Look for the red END label (top of the candle).
Draw Your FRVP:
Select the Fixed Range Volume Profile tool from your TradingView toolbar.
Click exactly on the START candle.
Drag and release exactly on the END candle.
Trade: You now have the exact Value Area High (VAH), Value Area Low (VAL), and Point of Control (POC) for the day. Use your breakout strategy as usual!

Atlas 8 Currency Session Momentum (6H, London)This indicator calculates real-time currency strength for the 8 major currencies (USD, EUR, GBP, JPY, AUD, NZD, CAD, CHF) using a balanced multi-pair engine and a 6-hour momentum reset.
🔍 How it works
The indicator computes the relative strength of each currency by averaging the percentage change of 7 major cross-pairs for each currency.
A currency's value increases when pairs where it is the base appreciate, and decreases when pairs where it is the quote depreciate.
This creates a symmetric and stable strength calculation similar to institutional relative-value models.
🕒 Session-based Momentum Reset
The global trading day is split into 4 × 6-hour blocks:
• 00:00–06:00 Tokyo
• 06:00–12:00 London
• 12:00–18:00 New York
• 18:00–24:00 Late US/Asia pre-open
At each new 6-hour session, all strength lines reset to 0.
This highlights fresh intraday momentum generated by liquidity transitions between sessions.
🎯 What the indicator shows
• Relative strength of all 8 currencies
• Smooth momentum curves using EMA smoothing
• Vertical dividers at each new session
• Background color for each session
• Real intraday build-up of strength/weakness (not cumulative from previous day)
This tool is designed for intraday traders who follow cross-currency momentum during session transitions (Tokyo → London → NY).
🧭 How to use it
• Look for the strongest vs weakest currency after each session reset
• Identify fresh trends during London and NY opens
• Confirm currency-pair bias using strength divergence
• Track momentum exhaustion when lines flatten or converge

FVG Session Break Strategy with ATR RR🧠 FVG Session Break Strategy with ATR RR — Timezone-Aware, Session-Savvy, and Risk-Calibrated
This strategy captures high-probability reversals and continuations by combining Fair Value Gap (FVG) imbalances with session-based breakout logic and ATR-calibrated risk management. It’s designed for traders who want to exploit structural inefficiencies during key market sessions — with precision and portability across global exchanges.
🔍 Core Logic:
Fair Value Gap Detection: Identifies bullish and bearish FVGs using a 3-bar displacement pattern.
Session Breakout Engine: Tracks session highs and lows (Asian, London, NY) and triggers trades only when price breaks these levels — ensuring trades occur at meaningful inflection points.
ATR-Based RR Control: Dynamically sizes stop-loss and take-profit levels using ATR × multiplier, maintaining consistent risk across volatility regimes.
🌐 Timezone-Aware Session Logic:
Session boundaries are defined in UTC-5 (e.g., NY: 0930–1600) but automatically converted to the exchange’s local timezone using timestamp("Etc/GMT+5", ...). This ensures:
Accurate session detection across all markets and assets
No manual timezone adjustments needed
Robust performance on crypto, forex, and global equities
📈 Visuals:
Session highs and lows plotted in orange
Bullish and bearish FVGs marked with green and red triangles
Strategy entries and exits shown on chart with full RR logic
This strategy is ideal for traders who want to combine structural edge with session context and disciplined risk.

Aggression Bulbs v3.1 (Sessions + Bias, fixed)EYLONAggression Bulbs v3.2 (Sessions + Bias + Volume Surge)
This indicator highlights aggressive buy and sell activity during the London and New York sessions, using volume spikes and candle body dominance to detect institutional momentum.
⚙️ Main Logic
Compares each candle’s volume vs average volume (Volume Surge).
Checks body size vs full candle range to detect strong directional moves.
Uses an EMA bias filter to align signals with the current trend.
Displays green bubbles for aggressive buyers and red bubbles for aggressive sellers.
🕐 Sessions
London: 08:00–12:59 UTC+1
New York: 14:00–18:59 UTC+1
(Backgrounds: Yellow = London, Orange = New York)
📊 How to Read
🟢 Green bubble below bar → Aggressive BUY candle (strong demand).
🔴 Red bubble above bar → Aggressive SELL candle (strong supply).
Bubble size = relative strength (volume × candle dominance).
Use in confluence with key POI zones, volume profile, or delta clusters.
⚠️ Tips
Use on 1m–15m charts for scalping or intraday analysis.
Combine with your session bias or FVG zones for higher accuracy.
Set alerts when score ≥ threshold to catch early momentum.

DCC Sessions Pro — fixed sessionsDCC Sessions Pro automatically highlights the three main market sessions directly on your candles for a clean and professional chart view.
• Asia (purple): 01:00 – 08:00
• London (blue): 08:00 – 15:30
• US (orange): 15:30 – 23:00
Weekends are automatically excluded so you only see relevant price action.
Perfect for intraday traders who want to track session behavior, volume shifts, and liquidity timing without overlapping colors or messy backgrounds.

ORB + Session VWAP Pro (London & NY) — fixedORB + Session VWAP Pro (London & NY) — Listing copy (EN)
What it is
A clean, non-repainting intraday tool that fuses the classic Opening Range Breakout (ORB) with a session-anchored VWAP filter for London and New York. It highlights only the higher-quality breakouts (above/below session VWAP), adds an optional retest confirmation, and scores each signal with an intuitive Confidence metric (0–100).
Why it works
• ORB provides the day’s first actionable structure (range high/low).
• Session VWAP filters “cheap” breaks and favors flows aligned with session value.
• Optional retest reduces first-tick whipsaws.
• Confidence blends breakout depth (vs ATR), VWAP slope and band distance.
Key visuals
• LDN/NY OR High/Low (line break style) + optional OR boxes.
• Active Session VWAP (resets per signal window; falls back to daily VWAP outside).
• Optional VWAP bands (stdev or %).
• Session shading (London/NY windows).
• Signal markers (LDN BUY/SELL, NY BUY/SELL) fired with cooldown.
Signals
• London Long / Short: Break of LDN OR High/Low ± ATR buffer, aligned with VWAP side.
• NY Long / Short: Same logic during NY window.
• Retest (optional): Requires a tag back to the OR level ± tolerance before confirmation.
• Confidence: 0–100; gate via Min Confidence (default 55).
Inputs that matter
• Open Range Length (min): Default 15.
• London/NY times & timezones.
• ATR buffer & retest tolerance.
• Bands mode: Stdev (with lookback) or % (e.g., 1%).
• Signal cooldown: Avoids clutter on fast moves.
Non-repaint policy
• OR lines build within fixed time windows using the current bar’s timestamp.
• VWAP is cumulative within the session window; no lookahead.
• All ta.crossover/ta.crossunder are precomputed every bar (no conditional execution).
• Signals are based on live bar values, not future bars.
⸻
Quick start (examples)
1) EURUSD, London momentum
• Chart: 5m or 15m.
• OR: 15 min starting 08:00 Europe/London.
• Signals: Use defaults; keep ATR buffer = 0.2 and Retest = ON, Min Confidence ≥ 55.
• Play:
• BUY when price breaks LDN OR High + buffer and stays above VWAP; retest confirms.
• Trail behind VWAP or band #1; partials into band #2.
2) NAS100, New York breakout & run
• Chart: 5m.
• NY window: 09:30 America/New_York, OR = 15 min.
• Retest OFF on high momentum days; Min Confidence ≥ 60.
• Use band mode Stdev, bandLen=50, show ±1/±2.
• Momentum continuation: add on pullbacks that hold above VWAP after the breakout.
3) XAUUSD, London fake & VWAP fade
• Chart: 5m.
• Keep Retest ON; accept only shorts that break OR Low but retest fails back under VWAP.
• Confidence gate ≥ 50 to allow more mean-reversion setups.
⸻
Pro tips
• Adjust ATR buffer to the instrument: FX 0.15–0.25, indices 0.20–0.35, metals 0.20–0.30.
• Retest ON for choppy conditions; OFF for news momentum.
• Use VWAP bands: take partials at ±1; stretch targets at ±2/±3.
• Session timezones are explicit (London/New York). Ensure they match your instrument’s behavior.
• Pair with a higher-TF bias (e.g., 1H/4H trend) for directional filtering.
⸻
Alerts (ready to use)
• ORB+SVWAP — LDN Long, LDN Short, NY Long, NY Short
(Respect your cooldown; alerts fire only after confirmation and confidence gate.)
⸻
Known limits & notes
• Designed for intraday. On 1D+ charts, session windows compress.
• If your broker session differs from London/NY clocks on a holiday, adjust input times.
• Session-anchored VWAP uses the script’s signal window, not exchange sessions, by design.

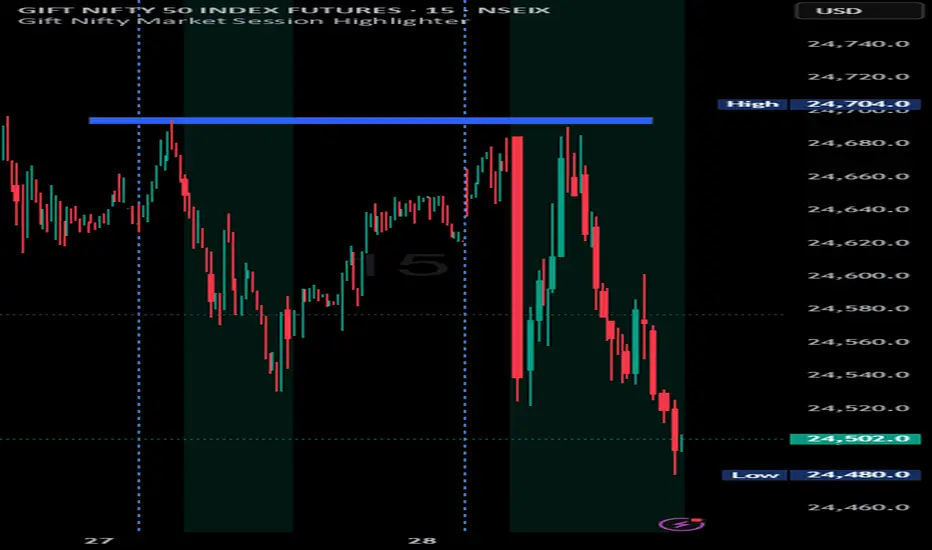
Indian market session on Gift Nifty chartsGift Nifty Market Session Highlighter
This indicator highlights the official Indian market session on Gift Nifty charts — from 9:15 AM to 3:30 PM IST. It shades the background during this time window so traders can instantly identify when the local market is open.
Features:
Marks 9:15 AM to 3:30 PM (IST) session on intraday charts.
Adjustable highlight color and transparency.
Works seamlessly across lower timeframes (1m, 5m, 15m, etc.).
Helps traders align Gift Nifty activity with NSE market hours.
Use Cases:
Quickly distinguish active market hours from overnight or global sessions.
Backtest trading strategies specific to Indian session volatility.
Improv
e focus on expiry-day setups and intraday opportunities.
Disclaimer:
This tool is provided for educational and informational purposes only. It is not financial advice, nor does it guarantee trading success. Always do your own research and consult a licensed financial professional before making investment decisions.
Bearish Breakaway Dual Session-FVGInspired by the FVG Concept:
This indicator is built on the Fair Value Gap (FVG) concept, with a focus on Consolidated FVG. Unlike traditional FVGs, this version only works within a defined session (e.g., ETH 18:00–17:00 or RTH 09:30–16:00).
See the Figure below as an example:
Bearish consolidated FVG & Bearish breakaway candle
Begins when a new intraday high is printed. After that, the indicator searches for the 1st bearish breakaway candle, which must have its high below the low of the intraday high candle. Any candles in between are part of the consolidated FVG zone. Once the 1st breakaway forms, the indicator will shades the candle’s range (high to low). Then it will use this candle as an anchor to search for the 2nd, 3rd, etc. breakaways until the session ends.
Session Reset: Occurs at session close.
Repaint Behavior:
If a new intraday (or intra-session) high forms, earlier breakaway patterns are wiped, and the system restarts from the new low.
Counter:
A session-based counter at the top of the chart displays how many bullish consolidated FVGs have formed.
Settings
• Session Setup:
Choose ETH, RTH, or custom session. The indicator is designed for CME futures in New York timezone, but can be adjusted for other markets.
If nothing appears on your chart, check if you loaded it during an inactive session (e.g., weekend/Friday night).
• Max Zones to Show:
Default = 3 (recommended). You can increase, but 3 zones are usually most useful.
• Timeframe:
Best on 1m, 5m, or 15m. (If session range is big, try higher time frame)
Usage:
See this figure as an example
1. Avoid Trading in Wrong Direction
• No Bearish breakaway = No Short trade.
• Prevents the temptation to countertrade in strong uptrends.
2. Catch the Trend Reversal
• When a bearish breakaway appears after an intraday high, it signals a potential reversal.
• You will need adjust position sizing, watch out liquidity hunt, and place stop loss.
• Best entries of your preferred choices: (this is your own trading edge)
Retest
Breakout
Engulf
MA cross over
Whatever your favorite approach
• Reversal signal is the strongest when price stays within/below the breakaway candle’s
range. Weak if it breaks above.
3. Higher Timeframe Confirmation
• 1m can give false reversals if new lows keep forming.
• 5m often provides cleaner signals and avoids premature reversals.
Summary
This indicator offers 3 main advantages:
1. Prevents wrong-direction trades.
2. Confirms trend entry after reversal signals.
3. Filters false positives using higher timeframes.
Failed example:
Usually happen if you are countering a strong trend too early and using 1m time frame
Last Mention:
The indicator is only used for bearish side trading.

AP Session Liquidity with EQH/EQL and Previous DayThis indicator plots key intraday session highs and lows, along with essential market structure levels, to help traders identify areas of interest, potential liquidity zones, and high-probability trade setups. It includes the Asia Session High and Low (typically 00:00–08:00 UTC), London Session High and Low (08:00–12:00 UTC), New York AM Session High and Low (12:00–15:00 UTC), and New York Lunch High and Low (15:00–17:00 UTC). Additionally, it displays the Previous Day’s High and Low for context on recent price action, as well as automatically detected Equal Highs and Lows based on configurable proximity settings to highlight potential liquidity pools or engineered price levels. These session levels are widely used by institutional traders and are critical for analyzing market behavior during time-based volatility windows. Traders can use this indicator to anticipate breakouts, fakeouts, and reversals around session boundaries—such as liquidity grabs at Asia highs/lows before the London or New York sessions—or to identify key consolidation and expansion zones. Equal Highs and Lows serve as magnets for price, offering insight into potential stop hunts or inducement zones. This tool is ideal for day traders, scalpers, and smart money concept practitioners, and includes full customization for session timings, color schemes, line styles, and alert conditions. Whether you're trading price action, ICT concepts, or supply and demand, this indicator provides a powerful framework for intraday analysis.

RTH Session Highs & LowsA Pine Script indicator designed to track and plot the Regular Trading Hours (RTH) session highs and lows on a chart, typically for U.S. equity markets (e.g., S&P 500, Nasdaq, etc.), which operate from 9:30 AM to 4:00 PM Eastern Time.
Session High & Low Lines:
During the RTH session, the indicator draws green and red horizontal lines that represent the highest and lowest price seen so far within that trading session.
These levels help traders identify intraday support (low) and resistance (high) levels.
New High/Low Markers:
Small triangle markers are placed:
Above the bar when a new intraday high is made (green triangle).
Below the bar when a new intraday low is made (red triangle).
This visually flags when momentum may be building or reversing.
Intraday Strategy Support:
Use the session high/low as dynamic support/resistance for scalping or breakout strategies.
For example:
Breakouts above session highs may indicate bullish strength.
Breakdowns below session lows may suggest bearish momentum.
Mean Reversion Tactics:
Prices approaching these lines and then rejecting can be used for mean reversion setups.
Combine with volume or candlestick patterns for confirmation.
Risk Management:
Set stops or targets relative to session highs/lows.
For instance, use session high as a stop-loss level in a short position.
Volatility Gauge:
Tracking how frequently new highs/lows are formed can help assess intraday volatility or range expansion.
Complement with Indicators:
Combine this with our "McGinley Dynamic Channel with Directional Shading" indicator or our "EMA Crossover with Shading" indicator to add context to breakouts or rejections.

matrixx Global Sessions + Good/Premium Spread ZonesSimple (enough) Script that allows you to visualize the major trading sessions, with some QoL stuff, Includes a "Monday Open" bar for reference when zooming out.
By default no one 'session' is turned on; instead, we have;
Good Zone - where spread tends to close up enough for (me) to trade in the 1-minute timezones
Premium Zone - where the tightest spreads tend to happen and I (you?) can get more aggressive with Stop Losses, and moment-to-moment trade accuracy.
The Monday Open - for reference.
You are able to go into the settings and turn these on and off at will, making any combination of 'zones' you prefer, and can colour code them, as well.
Points of Difference;
You can turn on and off any group or set of sessions for an overview;
Additionally, this is coded so that if there is a "Daylight Saving" or other localized timezone shift, it should be reflected correcty, as timezones are calculated based on each sessions' data, not arbitrarily with +/- as most of the other scripts that do similar to this one.
Monday Open
you can toggle sessions, or instead toggle the 'off hour' zones, at will
