Adel Session Levels (London/NY/Tokyo)Overview This indicator is designed for SMC (Smart Money Concepts) and ICT traders who rely on session liquidity to find trade setups. It automatically marks the Open, High, Low, and Mid (Equilibrium) levels for the three major trading sessions: Tokyo (Asia), London, and New York.
Inspired by the clean visual style of the "Adel Levels" indicator, this script draws horizontal lines that extend to the right of the chart, keeping your workspace clean while making it easy to spot future reactions to past session levels.
Key Features
🛡️ Smart London Freeze Logic: Unlike standard session indicators, this script includes a "Freeze" feature for the London session. As soon as the New York session opens (default 14:30 UTC), the London High and Low levels stop updating. This preserves the true "London Range" established prior to the NY overlap, allowing you to see if NY price action respects or sweeps the original London liquidity.
🌏 UTC Default Times: The indicator comes pre-configured with the official stock exchange hours in UTC, removing the guesswork for Forex and Indices traders:
Tokyo (Asia): 00:00 - 06:00 UTC
London: 08:00 - 16:30 UTC
New York: 14:30 - 21:00 UTC
📏 Equilibrium (Mid) Levels: Automatically calculates the 50% level of each session's range. This is crucial for identifying "Discount" vs. "Premium" pricing within a specific session.
👀 Clean Visualization: Lines for the current session automatically extend into the empty space on the right (customizable distance), allowing you to plan trades before price reaches the level.
⚙️ Fully Customizable:
Toggle individual sessions on/off.
Adjust line width, colors, and text size.
Turn specific levels (Open, Mid, High/Low) on or off depending on your strategy.
How to Use
Liquidity Sweeps: Use the extended High/Low lines to identify areas where price may sweep session liquidity (Judas Swing) before reversing.
Retracements: Use the Mid (Dashed Line) as a target for retracements. If price breaks a session High, it often returns to retest the session Mid or Open.
The "London Freeze": Watch the London High/Low specifically after New York opens. Since these lines stop moving at the NY open, they serve as fixed static reference points for the initial London range.
Settings
Label Distance: Controls how far into the future the lines extend (in bars).
Timezones: All session inputs are fully adjustable to match your specific broker or strategy requirements.
Risk Disclaimer: This tool is for informational purposes only and does not constitute financial advice. Always manage your risk.
Cari dalam skrip untuk "session"

Trading Sessions (L3J) Trading Sessions Indicator (L3J)
Overview
This Pine Script indicator displays precise trading session boxes for the three major global trading sessions: Asia, London, and US (Cash). Unlike traditional session indicators that show continuous background colors, this script creates rectangular boxes that precisely delimit each session from start to finish.
Features
🌍 Global Timezone Support
- 39 timezone options covering all major financial centers
- Automatic daylight saving time adjustments for named timezones
- Universal compatibility with all TradingView charts
📦 Session Boxes
- Precise delimitation: Each session is contained within a rectangular box
- Dynamic sizing: Boxes automatically adjust to session high/low prices
- Visual distinction: Completed sessions (solid borders) vs ongoing sessions (dashed borders)
- Customizable borders: Toggle on/off with adjustable thickness (0-5px)
🎨 Visual Customization
- Individual session colors: Fully customizable for Asia, London, and US sessions
- Border matching: Border colors automatically match session box colors
- Transparency control: Built-in opacity settings for each session
- Clean interface: Minimal visual clutter with maximum information
⚙️ Management Options
- Box limit control: Set maximum number of historical boxes per session (1-50)
- Automatic cleanup: Old boxes are automatically removed to maintain performance
- Memory efficient: Optimized for long-term chart analysis
Default Session Times (EDT - Etc/GMT+4)
| Session | Default Hours | Markets Covered |
|---------|---------------|-----------------|
| Asia | 18:00 - 02:00 | Tokyo, Sydney, Hong Kong |
| London | 02:00 - 11:00 | London, Frankfurt, European markets |
| US Cash | 09:30 - 16:00 | NYSE, NASDAQ |
> Note: Default times are in EDT (Eastern Daylight Time). Adjust session hours according to your selected timezone.
Timezone Conversion Examples
For UTC Users:
- Asia: 22:00 - 06:00
- London: 06:00 - 15:00
- US: 13:30 - 20:00
For Europe/London Users:
- Asia: 23:00 - 07:00
- London: 07:00 - 16:00
- US: 14:30 - 21:00
Usage Instructions
1. Add to chart: Apply the indicator to any timeframe
2. Select timezone: Choose your local timezone from the dropdown
3. Adjust session hours: Modify session times if needed for your timezone
4. Customize appearance: Set colors, borders, and box limits
5. Enable/disable sessions: Toggle individual sessions on/off as needed
Technical Specifications
- Pine Script Version: v6
- Chart Type: Overlay indicator
- Maximum Objects: 150 boxes, 500 lines, 200 labels
- Performance: Optimized for real-time updates
- Compatibility: All TradingView chart types and timeframes
Integration with Other Scripts
This indicator is designed to work seamlessly with other L3J trading scripts:
- ICT Levels Indicators: Provides session context for key levels
- Market Structure Scripts: Session boxes help identify structural breaks
- Volume Profile Tools: Session delimitation for volume analysis
- Support/Resistance Scripts: Session-based level identification
> Recommended: Use this as a base layer with other L3J indicators for comprehensive market analysis.
Key Benefits
🎯 Precision Trading
- Exact session boundaries: No guesswork about session start/end times
- Clean visual reference: Clear session delimitation for strategy execution
- Multi-timeframe compatibility: Works on all chart timeframes
📊 Professional Analysis
- Institution-grade accuracy: Matches professional trading platforms
- Customizable for any strategy: Adaptable to various trading approaches
- Performance optimized: Minimal impact on chart loading times
🔄 Real-time Updates
- Live session tracking: Ongoing sessions update in real-time
- Automatic management: Old sessions are cleaned up automatically
- Memory efficient: Optimized for extended trading sessions
Author Information
Created by: L3J
Version: 1.0
Category: Session Analysis / Market Hours
License: For use with L3J trading script ecosystem
---
Support & Integration
This indicator is part of the L3J Trading Script Collection. For optimal results, combine with other L3J indicators:
- ICT Key Levels
- Market Structure Analysis
- Volume Profile Tools
- Support/Resistance Scripts
Note: This script is specifically designed to complement and enhance other L3J trading tools. Individual use is supported, but maximum effectiveness is achieved when used as part of the complete L3J trading system.
---
For technical support or integration questions, refer to the L3J script documentation or community resources.

Relative Average Extrapolation [ChartPrime]Relative Average Extrapolation (ChartPrime) is a new take on session averages, like the famous vwap . This indicator leverages patterns in the market by leveraging average-at-time to get a footprint of the average market conditions for the current time. This allows for a great estimate of market conditions throughout the day allowing for predictive forecasting. If we know what the market conditions are at a given time of day we can use this information to make assumptions about future market conditions. This is what allows us to estimate an entire session with fair accuracy. This indicator works on any intra-day time frame and will not work on time frames less than a minute, or time frames that are a day or greater in length. A unique aspect of this indicator is that it allows for analysis of pre and post market sessions independently from regular hours. This results in a cleaner and more usable vwap for each individual session. One drawback of this is that the indicator utilizes an average for the length of a session. Because of this, some after hour sessions will only have a partial estimation. The average and deviation bands will work past the point where it has been extrapolated to in this instance however. On low time frames due to the limited number of data points, the indicator can appear noisy.
Generally crypto doesn't have a consistent footprint making this indicator less suitable in crypto markets. Because of this we have implemented other weighting schemes to allow for more flexibility in the number of use cases for this indicator. Besides volume weighting we have also included time, volatility, and linear (none) weighting. Using any one of these weighting schemes will transform the vwap into a wma, volatility adjusted ma, or a simple moving average. All of the style are still session period and will become longer as the session progresses.
Relative Average Extrapolation (ChartPrime) works by storing data for each time step throughout the day by utilizing a custom indexing system. It takes the a key , ie hour/minute, and transforms it into an array index to stor the current data point in its unique array. From there we can take the current time of day and advance it by one step to retrieve the data point for the next bar index. This allows us to utilize the footprint the extrapolate into the future. We use the relative rate of change for the average, the relative deviation, and relative price position to extrapolate from the current point to the end of the session. This process is fast and effective and possibly easier to use than the built in map feature.
If you have used vwap before you should be familiar with the general settings for this indicator. We have made a point to make it as intuitive for anyone who is already used to using the standard vwap. You can pick the source for the average and adjust/enable the deviation bands multipliers in the settings group. The average period is what determines the number of days to use for the average-at-time. When it is set to 0 it will use all available data. Under "Extrapolation" you will find the settings for the estimation. "Direction Sensitivity" adjusts how sensitive the indicator is to the direction of the vwap. A higher number will allow it to change directions faster, where a lower number will make it more stable throughout the session. Under the "Style" section you will find all of the color and style adjustments to customize the appearance of this indicator.
Relative Average Extrapolation (ChartPrime) is an advanced and customizable session average indicator with the ability to estimate the direction and volatility of intra-day sessions. We hope you will find this script fascinating and useful in your trading and decision making. With its unique take on session weighting and forecasting, we believe it will be a secret weapon for traders for years to come.
Enjoy

Exchange Sessions - Bollinger Bands Version [FervTrades]This indicator visualizes the four major trading sessions (New York orange, London blue, Tokyo pink, Sydney yellow) using fixed UTC timings optimized for crypto/forex markets and UTC+8 equivalents noted in code. It overlays customizable session ranges (90% transparent boxes), Bollinger Bands (20-period, 2σ default), optional trendlines (linear regression with R²), session means, or max/min levels, plus daily dividers with weekday labels for clear session isolation during high-volume overlaps like London/NY.
Key Features
- Session Dashboard: Real-time table (top-right default) shows active/inactive status (green/red), trend strength (R² >0 bullish), BB width (expansion/contraction), and volatility (σ) for each session; toggle advanced mode for metrics.
- Bollinger Bands Per Session: Session-specific BB calculated incrementally during active hours only, plotted with basis (solid), upper/lower (translucent); ideal for spotting volatility squeezes or breakouts within sessions.
- Flexible Overlays: Enable/disable per session and type (range, BB, trendline, mean, max/min); trendlines use weighted linear regression for directional bias.
----------------Session Times (UTC)----------------
Session Time (UTC) PHT Equivalent
New York 13:00-22:00 9PM-6AM
London 08:00-16:30 4PM-12:30AM
Tokyo 00:00-09:00 8AM-5PM
Sydney 22:00-07:00 6AM-3PM (next day)
Refer to this image:
Perfect for orderflow traders focusing on institutional sessions—pair with volume/delta tools to time entries on BB touches or range breaks. No DST issues; works on any timeframe.

Market Structure & Session Alerts### Market Structure & Session Alerts Indicator
#### Overview
The "Market Structure & Session Alerts" indicator is a comprehensive tool designed to assist traders in identifying key market structure levels, detecting liquidity sweeps, and receiving alerts for specific trading sessions. This indicator is particularly useful for traders who want to keep an eye on previous high and low levels and be alerted during pre-London and pre-New York sessions.
#### Features
1. **Previous High/Low Levels:**
- **Daily, Weekly, and Monthly Highs and Lows:** The indicator plots the previous day, week, and month high and low levels on the chart. These levels can be crucial for identifying support and resistance zones.
- **Toggle Display:** Users can choose to show or hide these levels using the "Show Previous Day/Week/Month High/Low" option.
2. **Liquidity Sweep Detection:**
- **Liquidity Sweep Identification:** The indicator detects liquidity sweeps when the current price closes above the previous day's high. This can signal potential reversals or continuations in the market.
- **Visual Alerts:** When a liquidity sweep is detected, a green triangle is plotted below the bar.
3. **Session Alerts:**
- **Session Timings:** Users can set specific start and end times for the pre-London and pre-New York sessions to match their timezone.
- **Visual Background Highlight:** The background of the chart is highlighted in yellow during the defined session times to provide a visual cue.
- **Alert Messages:** The indicator can generate alerts to notify traders when the market enters the pre-London or pre-New York session.
4. **Current Price Line:**
- The current price is plotted as a black line, providing a clear visual reference for the current market price.
#### How to Use
1. **Input Parameters:**
- `Show Previous Day/Week/Month High/Low`: Enable or disable the display of previous high/low levels.
- `Show Liquidity Sweep`: Enable or disable the detection and display of liquidity sweeps.
- `Show Session Alerts`: Enable or disable session alerts and background highlights.
2. **Session Timing Adjustments:**
- Set the `Pre-London Start`, `Pre-London End`, `Pre-New York Start`, and `Pre-New York End` times according to your timezone to ensure accurate session alerts.
3. **Alerts:**
- Make sure alerts are enabled in your TradingView settings to receive notifications when the market enters the pre-London or pre-New York sessions.
#### Example Use Cases
- **Day Traders:** Identify potential support and resistance levels using the previous day's high and low.
- **Swing Traders:** Use weekly and monthly high and low levels to determine significant market structure points.
- **Scalpers:** Detect liquidity sweeps to identify potential quick trades.
- **Session Traders:** Be alerted when the market enters key trading sessions to align your trading strategy with major market activities.
This indicator combines multiple market analysis tools into one, providing a robust system for traders to enhance their trading decisions and market awareness.

ICT KillZones + Pivot Points [TradingFinder] Support/Resistance 🟣 Introduction
Pivot Points are critical levels on a price chart where trading activity is notably high. These points are derived from the prior day's price data and serve as key reference markers for traders' decision-making processes.
Types of Pivot Points :
Floor
Woodie
Camarilla
Fibonacci
🔵 Floor Pivot Points
Widely utilized in technical analysis, floor pivot points are essential in identifying support and resistance levels. The central pivot point (PP) acts as the primary level, suggesting the trend's likely direction.
The additional resistance levels (R1, R2, R3) and support levels (S1, S2, S3) offer further insight into potential trend reversals or continuations.
🔵 Camarilla Pivot Points
Featuring eight distinct levels, Camarilla pivot points closely correspond with support and resistance, making them highly effective for setting stop-loss orders and profit targets.
🔵 Woodie Pivot Points
Similar to floor pivot points, Woodie pivot points differ by placing greater emphasis on the closing price, often resulting in different pivot levels compared to the floor method.
🔵 Fibonacci Pivot Points
Fibonacci pivot points combine the standard floor pivot points with Fibonacci retracement levels applied to the previous trading period's range. Common retracement levels used are 38.2%, 61.8%, and 100%.
🟣 Sessions
Financial markets are divided into specific time segments, known as sessions, each with unique characteristics and activity levels. These sessions are active at different times throughout the day.
The primary sessions in financial markets include :
Asian Session
European Session
New York Session
The timing of these major sessions in UTC is as follows :
Asian Session: 23:00 to 06:00
European Session: 07:00 to 14:25
New York Session: 14:30 to 22:55
🟣 Kill Zones
Kill zones are periods within a session marked by heightened trading activity. During these times, trading volume surges and price movements become more pronounced.
The timing of the major kill zones in UTC is :
Asian Kill Zone: 23:00 to 03:55
European Kill Zone: 07:00 to 09:55
New York Kill Zone: 14:30 to 16:55
Combining kill zones and pivot points in financial market analysis provides several advantages :
Enhanced Market Sentiment Analysis : Aligns key price levels with high-activity periods for a clearer market sentiment.
Improved Timing for Trade Entries and Exits : Helps better time trades based on when price movements are most likely.
Higher Probability of Successful Trades : Increases the accuracy of predicting market movements and placing profitable trades.
Strategic Stop-Loss and Profit Target Placement : Allows for precise risk management by strategically setting stop-loss and profit targets.
Versatility Across Different Time Frames : Effective in both short and long time frames, suitable for various trading strategies.
Enhanced Trend Identification and Confirmation : Confirms trends using both pivot levels and high-activity periods, ensuring stronger trend validation.
In essence, this integrated approach enhances decision-making, optimizes trading performance, and improves risk management.
🟣 How to Use
🔵 Two Approaches to Trading Pivot Points
There are two main strategies for trading pivot points: utilizing "pivot point breakouts" and "price reversals."
🔵 Pivot Point Breakout
When the price breaks through pivot lines, it signals a shift in market sentiment to the trader. In the case of an upward breakout, where the price crosses these pivot lines, a trader might enter a long position, placing their stop-loss just below the pivot point (P).
Conversely, if the price breaks downward, a short position can be initiated below the pivot point. When using the pivot point breakout strategy, the first and second support levels can serve as profit targets in an upward trend. In a downward trend, these roles are filled by the first and second resistance levels.
🔵 Price Reversal
An alternative method involves waiting for the price to reverse at the support and resistance levels. To implement this strategy, traders should take positions opposite to the prevailing trend as the price rebounds from the pivot point.
While this tool is commonly used in higher time frames, it tends to produce better results in shorter time frames, such as 1-hour, 30-minute, and 15-minute intervals.
Three Strategies for Trading the Kill Zone
There are three principal strategies for trading within the kill zone :
Kill Zone Hunt
Breakout and Pullback to Kill Zone
Trading in the Trend of the Kill Zone
🔵 Kill Zone Hunt
This strategy involves waiting until the kill zone concludes and its high and low lines are established. If the price reaches one of these lines within the same session and is strongly rejected, a trade can be executed.
🔵 Breakout and Pullback to Kill Zone
In this approach, once the kill zone ends and its high and low lines stabilize, a trade can be made if the price breaks one of these lines decisively within the same session and then pulls back to that level.
🔵 Trading in the Trend of the Kill Zone
Kill zones are characterized by high trading volumes and strong trends. Therefore, trades can be placed in the direction of the prevailing trend. For instance, if an upward trend dominates this area, a buy trade can be entered when the price reaches a demand order block.

Price Action All In One IndicatorIf you are the one who is "Price Action" style & does not want to use many indicators or complex indicators or you are an ICT (The Inner Circle Trader)
student or ICT charter, this simple beautiful All In One Indicator is right for you.
The indicator has the following functions.
TIME ZONE SETTING
The default timezone is New York Time GMT-4, if you leave the time zone setting blank, it will use the symbol timezone. Note that the trading time changes with one hour delay in winter. so if you just trade forex, and leave the time zone setting blank, TradingView will adjust the symbol timezone automatically for you or don't forget to change the timezone setting GMT-4 or GMT-5 depending on daylight saving time.
STATISTIC PANEL
You can choose which panel to show through settings.
Session Info Panel : pips info of ADR, Asian, London, and New York sessions.
Trend Panel : showing trend (up/down) of
5m/15m/1h/4h/D/W time frames (TF)
4MA (default values: SMA with lengths: 20–50–100–200)
Money Management Panel : in trading, money management is very important. Just put the % risk, & stop loss value below, the indicator will calculate a suitable size/amount for each trade.
Size by Lots: input stop loss in pips
Size by Units: input stop loss in % (of price)
(*)Units size is calculated by % stop loss & current bar close price. You have to determine a stop-loss price to convert to % stop loss by yourself.
TIME SEPARATORS
We can choose which time separators we want to display. The indicator has 5 options: Anchor Time/Day/Week/Month/Quarter. Of course, we can choose to show just one or all 5 of them.
With Anchor Time you can choose which time you want to draw a vertical line for better timing analysis. This can show up to 2 Anchor Time lines. The default values are 00:00 (New York Midnight Opening) and 08:30 (New York Session Opening). You also have an option to show the past lines or not.
About Day Separator, cause TradingView has supported Session Breaks in Setting but if you don't like to use it or when enabling, it distracts you, you can use mine. My favorite trading dates are Tuesday & Wednesday.
PRICE LEVELS
For intraday trading, the high/low/close of the previous day, the previous week, ADR (default period is 5) are very important key levels. You can choose which one you like to show for better analysis. Of course, you can change the color & style of the lines. This is also my favorite indicator.
This indicator also has an option to show up to 2 price lines at a specific time, you can choose the price type (high/low/close/open) that you want to display. The default time values are:
Specific Time 1: 0:00. (New York Midnight Opening Price)
Specific Time 2: 8:30 am. (New York Session Opening Price)
ACCUMULATION ZONE
The market tends to reprice the higher/lower to the old high/low or imbalance/fair value price to promote buy/sell stops or to provide smart money pricing for long/short entries. Typically, it redistributes quickly and you must learn to anticipate them at key levels intraday. Weak short/long holders will be squeezed in the retracement.
Except for the open price, the price changes continuously until the closing time, so the accumulation area can also be changed in real-time, but if you combine it with other information when analyzing, you can predict/determine whether the zone has been established or not with high probability. In short, price needs time to be accumulated, I usually don't pay attention to this daily zone till London open/close or New York sessions
Not only daily zone, but the indicator also supports higher timeframes accumulation zone from
SESSION & STD
There are 3 sessions: Asian, London, New York. The default values are below (New York Time).
Asian: 19:00 ~ 00:00
London Open (London KillZone): 01:00 ~ 05:00
New York Open (New York KillZone): 07:00 ~ 10:00
If you do not want to show the label, just leave the label values blank or change them to whatever you want.
This is one of my favorite functions. I use it on 15m, 30m, 1h TF for Forex intraday trading. My favorite trading sessions are London Open & New York Open.
You also can choose to show or not Standard Deviations (STD). The default values are set for Asian Range STD and max STD levels can be shown are 5. I use the following 3 types of STD (New York Time):
CBDR (Central Bank Deviations) STD: 14:00 ~ 20:00
Flout STD: 15:00 ~00:00
Asian Range STD: 19:00 ~ 00:00
LOOKBACK HIGH/LOW/MID
Can show high/low/mid of the data ranges on the daily/4h chart. The default values are:
- 20–40–60 days back from today for daily TF.
- 30–60–90 bars back from the latest bar for 4h TF.
The default anchor bar for calculating the lookback is the latest one but with:
- 4h TF: we can change the lookback from the 1st day of the week.
- Daily TF: we can change the lookback from the 1st day of the month.
The indicator also has options showing the high/low/mid (equilibrium level) lines for better analysis. Especially, on daily TF, we have the option that can show up to 4 lines (25% for each one) of the data range.
Of course, you can change the colors or the style of the high/low/mid lines.
The lookback can be shown on the lower TFs for better detection when the market structure is shifted.
MAGIC BARS
Fractal bar : The bar's color is changed when the divergence occurs between the price & RSI. You can change the RSI period (default value is 14) & RSI source. (open/high/low/close,…)
Imbalance bar or liquidity void or fair value gap - whatever you call it. This is my favorite indicator when trading on all TFs.You can choose to extend the last n imbalance bars if you like in the settings. I make sure I covered all cases of imbalance/fair value gap.
OLD HIGH/LOW
First, this function is not used as the common Support & Resistance that retail traders usually use, so I call it Old High/Low. I usually use it in 2 ways:
Detect the next buy/sell stops that Market Makers aim to manipulate.
Detect whether market structure shifted or not (Break of structure)
In settings you can:
Set the period to detect high/low levels, the default value is 10. My other favorite values are 6 & 2.
On a lower time frame, you might want to set it to a large number to remove noise.
On a higher time frame, a small number is enough, I think.
Choose the numbers of the last lines you want to show on your chart.
Of course, the style of lines can be changed easily.
TRENDLINES
A very simple trendline with default pivot left strength is 10.
By default, trendline uses high/low price but you have the "Using close price" option.
LINEAR REGRESSION CHANNEL
The Linear Regression Channel is a three-line technical indicator used to analyze the upper and lower limits of an existing trend. It is a statistical tool used to predict the future from past data and is used to determine trend direction or when prices may be overextended.
You can choose
To fill the background or not
To show inner/outer lines or not
To change the colors/line styles of upper zone, lower zone, upper lines, lower lines, midline
DIRECTION BOX
Working on all TFs, this looks like the same with lookback function but if you would like to display them in a box for easily focusing/comparing with other symbols or for detecting divergence in a specific period. The indicator also has a setting to show or hide lines connecting between lows or highs.
Another example of how I use High/Low connecting lines to detect divergence between S&P 500 and NASDAQ 100.
ZIG ZAG
Can show up to 2 ZigZag lines.
This is suitable for traders who have difficulty in detecting key levels (recent high/low) of the prices to confirm market structure or just for drawing Fibonacci easily at those levels.
MA (Moving Average)
I believe that this is one of the most used indicators for every trader. There are 5 types of MA to choose from: EMA, SMA, WMA, VWMA, SMMA(RMA).
This can show up to 4 MAs. You can choose the source (close/high/low,…) for each one. My favorite values are 34 & 89 EMA.
This indicator also supports MA Bands. You can select which MA you want to display the bands, and the "width" of the bands can be changed via the settings.
WATERMARK
It's just a simple function but I think it's very useful for those who want to add Copyright info to the chart, to prevent others from copying it.
Others/known issues/limitations
In forex or stock (things that are traded only on weekdays), TradingView's does not include the latest bars till Monday so the Day Separator cannot fill that space. Because TradingView deals with those bars as Sunday's ones so I set the color of Sunday the same as Friday for good UI/UX. On Crypto charts, the indicator shows without problems.
If you see "Internal server study error", please try closing the current TradingView tab in your browser and reopening it in a new tab. The error will disappear.
Because TradingView does not provide any detailed error information when such "general error" occurs. It's very difficult to detect which function is causing this error or is there something that caused TradingView "overloaded" through a long time running/loading on that tab? Honestly, I don't know exactly the cause, but in my experience, this error often occurs in the following cases:
When you have the TradingView Tab open for hours. In my case, I usually leave TradingView tab open overnight & when I come back the next day, this error might appear. (I'm a Mac user & I almost never shut down my Mac)
When you change settings too many times, especially settings of drawing objects like line width in a using session, it might cause this error.
So, after changing the setting or when you come back for the next trade, please save & close that TradingView tab, and then open a new one, everything will work fine.
You can see the images below that show I have tested my indicator from 1-minute time frame, enabled all functions, change every setting to max values & everything still works fine.

TKFX Workout - Breakfast🪬🧿 TKFX Workout FX – Breakfast IN 🧿🪬
All-in-One Session Breakout • Smart Entries • HTF Candles • Dashboard
🔥 What this Indicator Does
TKFX Workout FX – Breakfast IN is a complete intraday trading system designed for Forex, Gold (XAUUSD), Indian Indices & Crypto, focused on session-based breakouts, momentum confirmation, and higher-timeframe market structure.
It combines:
📍 Liquidity Line Breakouts
🎯 Auto Buy/Sell Levels with TP Targets
📊 Trend & Sentiment Analysis
🕯️ Higher Timeframe Candle Projection
📋 Dashboard + VWAP + EMA Bias
🔔 Clear Visual Signals & Alerts
⏰ Session-Based Strategy (Core Logic)
This script automatically tracks important intraday sessions:
🏋️♀️ Workout FX | 🍽️ Breakfast IN | ₿ Crypto Session
After each session:
Buy Above / Sell Below levels are plotted
Mid Level calculated automatically
🎯 TP1–TP4 projected symmetrically
Perfect for London / NY pre-market breakouts.
🚀 Buy & Sell Signals
✅ Entry Logic
Buy → Price breaks above session high
Sell → Price breaks below session low
Confirmation with candle strength
🎨 Candle Highlights
🟦 White candle → First breakout
🟨 Yellow candle → Confirmation
🟠 / 🟡 → Retest & continuation clues
📍 Clear Chart Signals
⬆️ Buy arrows below candle
⬇️ Sell arrows above candle
🧠 Smart Trend Filter
📈 Trend, VWAP & Sentiment
Optional EMA Trend Line
🟢 Bullish / 🔴 Bearish sentiment table
Ideal for trail SL & bias filtering
🕯️ HTF Candle Projection (Advanced Feature)
Visualize Higher Timeframe candles on lower TF charts:
3m, 5m, 10m, 15m, 1H
Full candle body + wick
Fair Value Gaps (FVG)
Volume Imbalance zones
Countdown timer per HTF candle
Perfect for structure-based trading.
📊 TKFX Dashboard
Live dashboard showing:
🕒 Date & Time | 📉 Momentum (VWAP based)
🔔 Alerts
Buy / Sell breakout alerts
No repaint logic
Works on any timeframe
🚀 Developed by Trader Kalpesh FX (TKFX)
📚 Learn • Trade • Earn
traderkalpeshfx.com
⚠️ Disclaimer
This indicator is for educational purposes only.
Always use proper risk management.
No financial advice.

Power Hour Trendlines [LuxAlgo]The Power Hour Trendlines indicator is based on Power Hours detection, and includes up to three displayed trendlines derived from the closing prices of all the bars within the last user-selected Power Hours.
Users can edit the time of Power Hours, choose how many sessions to take into account, enable or disable any trendlines, and change their colors.
🔶 USAGE
The Power Hour is defined as the last hour of the trading session and is set by default from 3:00 p.m. to 4:00 p.m. New York time. During this period, volume and volatility enter the market. Traders using higher timeframes may use this period to enter or exit positions by placing MOC (Market on Close) orders.
This tool works under the hypothesis that prices made during power hours (periods with high trading activity) are more relevant when used for the construction of trendlines.
An initial trendline is fit using linear regression; prices from power hours located above this initial fit are used for the upper trendline, while the ones below the fit are used for the lower one.
As with any trendline, traders can analyze the slope to determine the market's direction:
Positive slope: The market is trending up.
Negative slope: The market is trending down.
No slope: The market is trending sideways.
As we can see in the image, Nasdaq and Bitcoin are clearly in downtrends, gold is clearly in an uptrend, and the euro/U.S. dollar is in a sideways market over the last visible sessions.
As you can see, the trend lines may or may not be parallel to each other. The wider the area, the more volatile the data. The narrower the area, the less volatile the data. Let's look at an example.
In the image, the Dow30 and the euro/U.S. dollar have opposite behaviors. The volatility above the middle trendline is growing in the first case but shrinking in the second. In both cases, the volatility in the bottom area seems steady, so there are no big surprises there.
Traders can adjust the number of sessions for calculations, making the tool ideal for analyzing price behavior over different time frames.
As the image shows, we can clearly see how the market behaves over different time periods. XLY has been moving down over the last 10, 20, and 40 sessions, with a steeper decline over shorter periods. However, it has been moving sideways over the last 70 sessions.
One of the main uses of trendlines is to provide key support and resistance. In the image, SPY is shown with trendlines over the last 20 sessions. These lines provide excellent reference points for trading and observing price behavior in those areas, such as whether prices are accepted or rejected, which may trigger a response from other traders.
🔹 Not Allowed Timeframes
For obvious reasons, timeframes larger than 1H are not allowed. The Power Hour is defined as the last hour of the trading session. The tool will display a warning message if the timeframe is longer than 60 minutes.
🔶 SETTINGS
Power Hour (NY Time): Choose a custom Power Hour in New York time
Sessions Memory: Select how many Power Hours to take into account for calculations.
🔹 Style
Top: Enable or disable the top line and choose the line and background colors.
Middle: Enable or disable the middle line and choose the line color.
Bottom: Enable or disable the bottom line and choose the line and background colors.
Background: Enable or disable the background color for top and bottom lines.

NQ 65 Point Futures Session 30 Second Opening RangeNQ 65 Point Futures Session Open Range Pro
Overview
This Pine Script indicator is designed specifically for NASDAQ-100 E-mini (NQ) futures traders who utilize opening range breakout strategies across multiple global trading sessions. The indicator provides comprehensive session-based opening range analysis with advanced 65-point interval projections.
Key Features
Multi-Session Opening Range Analysis
RTH (Regular Trading Hours): 8:30 AM CT - New York session opening range
Globex (Asian Session): 5:00 PM CT - Asian market session opening range
Europe Session: 2:00 AM CT - European market session opening range
Core Functionality
High/Low/Mid Lines: Displays opening range boundaries and midpoint for each session
Customizable Colors: Full color customization for each session's lines
Price Labels: Optional price display on all levels with session identification
Statistics Table: Real-time table showing high, low, and range width for active sessions
Advanced 65-Point Interval System
RTH-Specific Feature: Plots 5 levels above and below RTH opening range at 65-point intervals
Projection Levels: +65, +130, +195, +260, +325 above RTH high and corresponding negative levels below RTH low
Customizable Labels: Toggle price display and session names on interval lines
Color-Coded: Separate colors for upside and downside projections
Enhanced Trading Tools
Breakout Detection: Automatic identification of opening range breakouts with visual signals
Alert System: Built-in alerts for all session breakouts (up and down)
Range Boxes: Optional visual boxes highlighting opening ranges
Multiple Timeframe Support: Works across various chart timeframes
Display Options
Label Customization: Multiple size options (Tiny, Small, Normal, Large)
Session Toggle: Individual on/off controls for each session
Transparency Controls: Adjustable transparency for range boxes
Professional Styling: Clean, professional appearance suitable for live trading
Trading Applications
This indicator is particularly valuable for:
Gap Trading: Identifying key levels after overnight gaps
Breakout Trading: Clear visual confirmation of range breakouts
Support/Resistance: Using opening ranges as dynamic S/R levels
Session Transition: Understanding how price behaves across global sessions
Risk Management: Using 65-point intervals for position sizing and target setting
Technical Specifications
Version: Pine Script v5
Overlay: True (plots directly on price chart)
Max Lines: 500 (accommodates extensive level plotting)
Timezone: America/Chicago (Central Time)
Data Frequency: 30-second precision for opening range calculation
Usage Notes
Designed specifically for NQ futures but may work on other instruments
Best performance on intraday timeframes (1m, 5m, 15m, 30m)
Opening ranges calculated based on first 30 seconds of each session
All alerts are customizable through TradingView's alert system
Customization Options
The indicator offers extensive customization including:
Color schemes for each session
Label display preferences
Line transparency and thickness
Statistical table positioning
Alert message customization

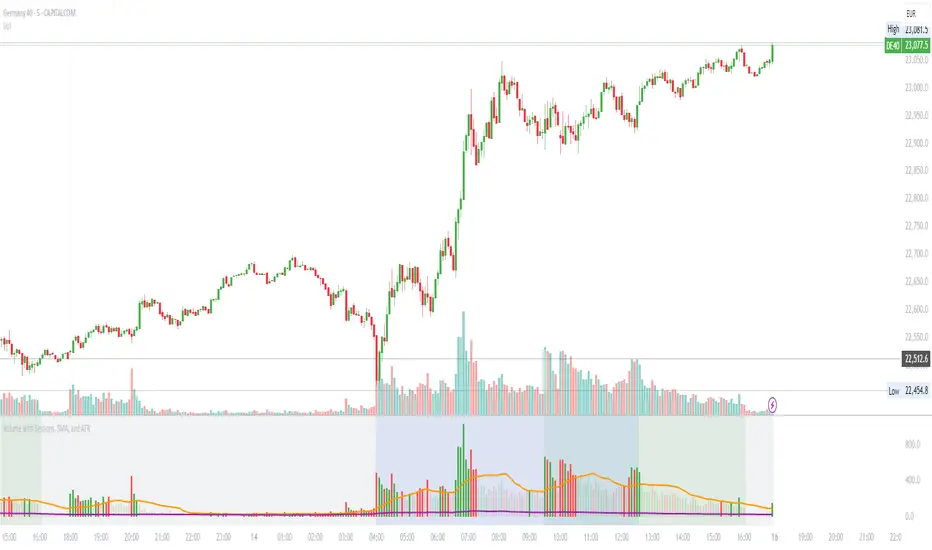
Volume with Sessions, SMA, and ATR Pine Script creates a custom volume indicator with several features, including:
SMA of Volume: It calculates the simple moving average (SMA) of the volume, which helps identify trends and determine if the current volume is above or below the average.
ATR (Average True Range): It calculates the ATR, which measures market volatility over a defined period.
Bullish/Bearish Volume Coloring: The script colors the volume bars depending on whether the price is moving up (bullish) or down (bearish), and whether the volume is above or below the SMA of volume.
Session Highlighting: It defines two major trading sessions:
NYSE (New York Stock Exchange) session from 9:30 AM to 4:00 PM Eastern Time.
LSE (London Stock Exchange) session from 8:00 AM to 4:30 PM GMT. These sessions are highlighted with background colors for easy identification.
Plotting: The volume is plotted as a histogram with varying colors depending on price movement and volume relative to its SMA. The ATR is also plotted as a purple line, and the SMA of volume is displayed as an orange line.
Background Colors: Background colors are applied during the NYSE and LSE sessions to visually differentiate between these trading periods.
Here's a breakdown of each section:
Key Inputs:
smaLength and atrLength: User-defined values for the lengths of the SMA and ATR calculations.
Main Calculations:
smaVolume: The SMA of the volume over the user-defined length (smaLength).
atrValue: The Average True Range over the user-defined length (atrLength).
Color Logic for Volume Bars:
If the current close is higher than the previous close, the volume is considered bullish, and the bar is colored green. If the volume is above the SMA, it’s a darker green; otherwise, it’s a lighter shade.
If the current close is lower than the previous close, the volume is considered bearish, and the bar is colored red. If the volume is above the SMA, it’s a darker red; otherwise, it’s a lighter red.
Plotting:
The script plots the volume as a histogram with dynamic coloring.
The SMA of the volume is plotted as a line.
ATR is plotted as a purple line for reference.
Background Color Highlighting:
The background is colored green during the NYSE session and blue during the LSE session.
MainFX session indicatorScript Title: MainFX Session Indicator with Customizable Lines
Overview:
This script is designed to help traders visually identify key market sessions on their TradingView charts. It marks both the opening and closing of major sessions (Frankfurt, London, New York, Sydney, and Tokyo) by drawing lines and labels on the chart. The indicator is highly customizable, allowing you to define specific session times, choose your preferred time zone, and adjust the visual appearance of all lines.
Key Features:
Custom Session Times:
Each session’s start and end times are defined by user inputs in a simple HHMM-HHMM format. This means you can adjust the sessions to match the exact market hours you follow, making the indicator flexible for different trading strategies and markets.
Time Zone Flexibility:
The "Chart/Local Time Zone" input lets you override the default time zone of your chart. By setting a specific time zone (e.g., "Africa/Lagos" or "Africa/Accra"), the script calculates session start and end events relative to that zone. This ensures that, regardless of where you are trading from, the session markers accurately reflect the intended market hours and adjust automatically for Daylight Saving Time if applicable.
Open Range Levels (ORH/ORL):
When a session opens or closes, the script draws horizontal lines at the high and low of the candle immediately before the event. These levels act as the Open Range High (ORH) and Open Range Low (ORL) markers. They serve as key reference points for traders to gauge price levels established just before a session change.
Customizable Visuals:
Every visual element is customizable. You can adjust the color, width, and style (defaulting to a dotted line) of both the ORH/ORL lines and the combined session lines that label open and close events. This allows you to tailor the indicator to match your charting style and ensure that the lines stand out clearly.
Session Event Detection:
The script utilizes helper functions to check each bar on the chart. It compares the current bar’s session status with that of the previous bar to determine whether a session has just started or ended. When such a transition is detected, it triggers the drawing of the appropriate lines and labels.
Optimized for Intraday Trading:
Since the script’s functionality is based on minute-level bar changes, it is best used on 1-minute or lower timeframes. This ensures precision in marking the exact moments when sessions transition, which is critical for intraday trading strategies.
How It Works:
Session Timing:
The script calculates the session periods using the time() function with the user-defined session strings and time zone. This makes it independent of the chart’s inherent time settings.
Event Triggering:
When the current bar transitions into or out of a session (i.e., the session status changes between bars), the script detects this change. It then draws horizontal lines at the previous candle’s high and low (marking ORH and ORL) and adds session labels for clarity.
Visual Customization:
Users can easily change the appearance of the drawn lines and session labels via the script’s input options, ensuring that the indicators are both aesthetically pleasing and functionally clear.
Usage:
For Traders:
Use this indicator to keep track of critical market sessions and to spot participants in the session.
Customization:
Adjust session times and the time zone to suit your local market or the specific market you are analyzing.
Visual Clarity:
Customize line styles to ensure that your chart remains clear and that the session markers are easy to interpret even during overlapping sessions.

Asia Sessions AutoPlotting**Asia Sessions AutoPlotting**
This script is designed to automatically detect and plot the Asia session high and low levels directly on your chart, providing key session data for trading analysis. It is highly customizable, making it an essential tool for traders who rely on session data for decision-making.
### Key Features:
- **Asia Session Detection**: Automatically identifies the Asia session based on user-defined time settings (default: 0000-0845 UTC).
- **High/Low Line Plotting**: Displays high and low price levels for the session with customizable colors and line styles.
- **Line Extensions**: Option to extend session high/low lines for future price action reference.
- **Session Background Fill**: Adds an optional colored background to highlight the Asia session period.
- **Day Labels**: Includes labels for the session high/low levels with the corresponding day of the week.
- **Dynamic Session History**: Limits the display to a user-specified number of past sessions (default: 7) to keep the chart clean and focused.
- **Customizable Colors**: Highlights Mondays with unique colors for easy identification, while other weekdays use a different scheme.
### Use Cases:
- Identify key session levels for trading strategies.
- Monitor Asia session dynamics and their impact on subsequent sessions.
- Spot significant price reactions around session highs/lows.
### Inputs:
- **Session Time**: Adjust the session time to match your preferred Asia trading hours.
- **Toggle High/Low Lines**: Enable or disable the plotting of session highs and lows.
- **Line Extensions**: Extend the session high/low lines into future bars for better visualization.
- **Background Highlight**: Toggle a colored background for the Asia session.
- **Maximum Sessions**: Define how many past sessions to display for clarity.
This script is perfect for intraday traders, scalpers, and swing traders looking to gain insight into the Asia session and its influence on global markets. Fully adjustable and easy to use, it enhances your chart with critical information at a glance.
Simply add it to your TradingView chart, configure your settings, and let it do the work for you!

ka66: FX Sessions High/LowThis indicator is specific to the 24-hour Forex Market. It provides 2 features:
Demarcating forex sessions with open and close lines. Note that looking at various sources online, we use the convention that the Asia session starts with the Tokyo market open, rather than the earlier Sydney session. Presumably this is better since we then have more liquidity in the market. Note that we have three sessions: Asia, London, New York.
At the end of each session, we begin plotting that (closed) session's high and low, which acts as a natural support and resistance for the Forex market. This is the key feature it provides. The first feature is mainly there for a visual guide, which can be turned off via the UI settings, but it certainly helps verifying the logic!
For more background, we are taking the idea of Previous Day High/Low (PDH/PDL), but adjusting it to a multi-session market like Forex. In essence, this is is a "Previous Session High/Low" indicator.
PDH/PDL works fine when you have a market with Regular Trading Hours, ignoring Extended Hours. However, in the Forex market, each session can have differing sentiments, e.g. we often see say London bringing prices up, and New York bringing them back down.
The break of session high/lows (or bouncing off them) can reflect where the potential direction price is going to take.
I also categorised this as a Sentiment indicator, because support and resistance areas where prices react do provide the sentiment of the market. They aren't just lines, they are prices of interest to major players.

New York, London and custom trading sessionsHi Traders
The script :
The Time sessions script plots the trading sessions of both New York and London markets (background fills), In addition to the above the script also plots a user defined trading session period (vertical lines). All plots may be toggled true or false inorder to ensure you can focus on the respective market / markets / custom session.
Market sessions are useful for technical or quantitative analysis, as the majority of trading activity and net daily volume occurs in these zones, in fact the U.S./London market overlap tends to have the greatest volume accumulation across that range of time / bars than that range at any other time within the daily session. For FX traders it may also be important to take into account for many currency pairs the average exchange rate pip movement is greatest within these zones.
The custom session, is intended to be used for traders who trade only within specific intervals within the market session or day for 24/7 traded asset classes
Additional notes :
Not as of now, I have only added three optional trading sessions. If you would like to change the sessions, copy the scripts code and change the "ctm_session" default time range value, insuring the second time value is 1 min > than the first.
As always i Hope this is a useful script, and I will be updating this script in the near future.
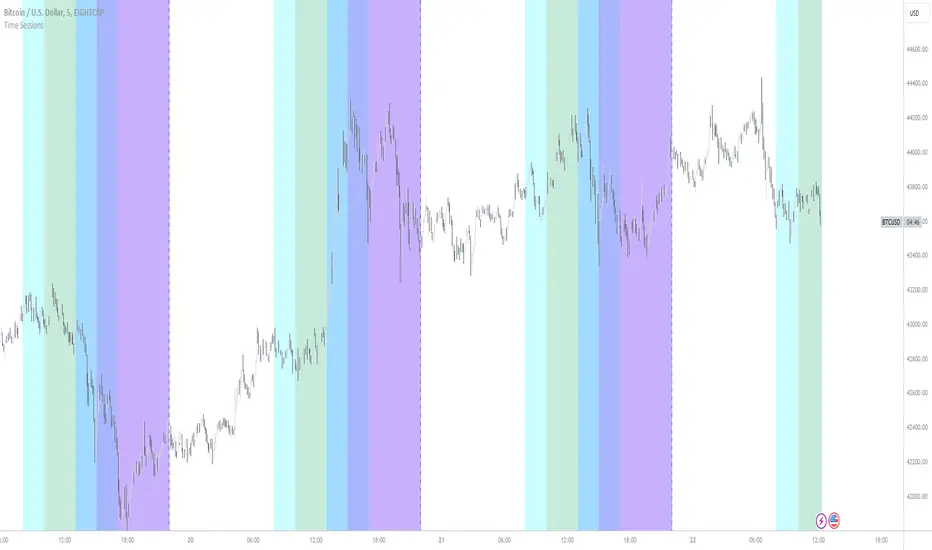
Market Sessions — VerticalA clean visual guide to global market sessions.
This indicator plots vertical lines at the opening and closing times of the four major forex sessions:
London, New York, Tokyo, and Sydney.
Fully customizable — toggle each session on/off, choose separate colors for open/close, and enable/disable labels.
Supports both Local (auto-DST) and GMT (fixed) modes — switch between realistic market-clock times or the standardized UTC schedule used by most trading resources.
Helps you visually identify session overlaps (e.g., London–New York) where volatility typically increases.
Ideal for forex, indices, and commodities traders who trade around session opens.
Default session times (GMT mode):
Sydney 21:00 – 06:00 GMT
Tokyo 00:00 – 09:00 GMT
London 08:00 – 17:00 GMT
New York 13:00 – 22:00 GMT
Tip: Set Anchor times by → Local (auto-DST) if you want the lines to follow each region’s real-world daylight-saving adjustments automatically.
Clean, lightweight, and built for traders who want precise, minimal clutter — just the key time windows that move the market.

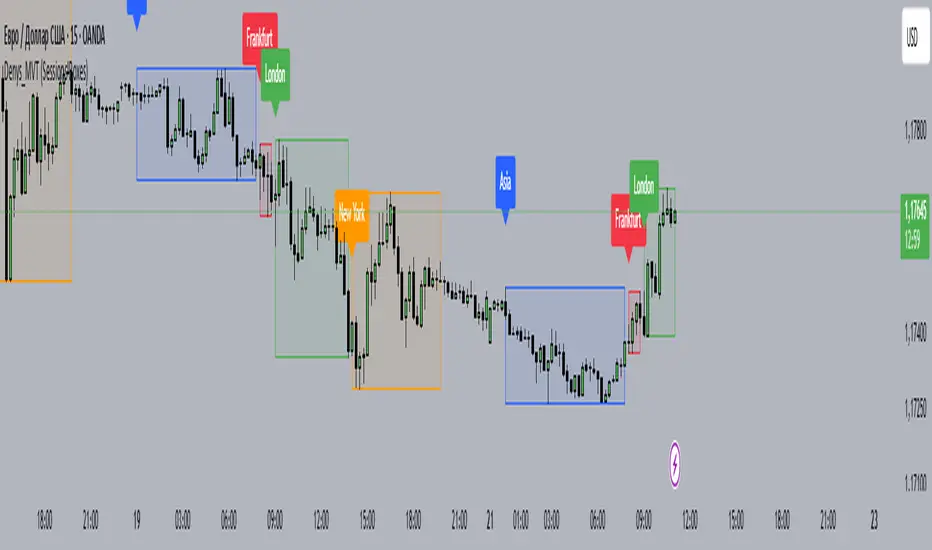
Denys_MVT (Sessions Boxes)Denys_MVT (Sessions Boxes)
This indicator highlights the main trading sessions — Asia, Frankfurt, London, and New York — directly on the chart.
It helps traders visually separate market activity during different times of the day and quickly understand which session is currently active.
🔹 How it works
You can choose between Box Mode (draws a box around the session’s high and low) or Fill Mode (background color for the session).
Each session has its own customizable time range and color.
Labels can be placed automatically at the beginning of each session.
The script uses the time() function with your selected UTC offset to precisely map session times.
🔹 Features
Displays Asia, Frankfurt, London, and New York sessions.
Option to toggle between boxes and background shading.
Adjustable transparency and session colors.
Session labels for easier visual reference.
Works on any symbol and timeframe.
🔹 How to use
Add the indicator to your chart.
Set your local UTC offset in the settings (default: UTC+2).
Enable/disable sessions, change colors, or switch between Box/Fill mode.
Use the session highlights to better understand when volatility typically increases and how different sessions interact.
RTH Session Range Position (0-100) with EMAA Pine Script indicator designed to help traders understand where the current price is located within the Regular Trading Hours (RTH) session range, from 0 (session low) to 100 (session high). It also plots a smoothed EMA of this position to provide insight into momentum or trend during the RTH session.
What the Indicator Does
Defines RTH (Regular Trading Hours):
Start: 9:30 AM
End: 4:00 PM
These are typical US equity market hours.
Tracks the session's high and low during RTH:
sessionHigh and sessionLow update only during RTH.
Calculates position of the current price within the RTH range:
Formula: ((close - sessionLow) / (sessionHigh - sessionLow)) * 100
Result is a percentage:
0 = at session low
100 = at session high
50 = middle of session range
Calculates an EMA of that position (posEMA):
Smooths out the raw position to help visualize momentum within the range.
Plots and table:
Plots pos and posEMA on a separate chart pane.
Adds horizontal lines at key levels (0, 30, 50, 70, 100).
Table shows current values for Position, EMA, and Range.
Visual cues:
bgcolor highlights when pos crosses over or under the EMA — potential momentum shifts.
Alerts:
Cross above/below 50 (session midpoint).
Cross above/below EMA.
How to Use It Effectively
1. Session Strength & Momentum
Position above 70: Price is near session highs — strong upward momentum.
Position below 30: Price is near session lows — strong downward momentum.
Use the EMA of position to filter out noise and identify trends.
2. Breakout or Reversal Detection
Cross above EMA: Momentum may be turning bullish.
Cross below EMA: Momentum may be turning bearish.
These crosses (especially near mid-levels like 50) can hint at session trend shifts.
3. Range Context for Entries
If you're a mean-reversion trader, look for:
Price > 70 + turning down below EMA → possible short.
Price < 30 + turning up above EMA → possible long.
For breakout traders, you might wait for:
Crosses above 70 with EMA support.
Crosses below 30 with EMA resistance.
4. Confirmation Tool
Use this indicator alongside others to confirm:
Whether price action has strength within the day.
Whether breakouts have real momentum or are extended already.

Forex Kill Zones - SMC IndicatorsWhat are Kill Zones?
Kill Zones are specific Time Windows of opportunity during the Session that have the potential for the highest volatility and where looking for trading opportunities is ideal.
The Forex Kill Zone Indicator is specifically designed for the Forex Market. What differentiates this script from other Kill Zones scripts is that this script is based on NY Midnight as the basis for the start of the day.
This is not the usual below-average Kill Zone indicator because this indicator does not only show the 3 main Kill Zones or Sessions, but it also offers extra Kill Zones that are called "Asian Range (AR)", "Central Bank Dealing Range (CBDR)", and "FLOUT".
Another key differentiator of this indicator's functionality is that it shows the highs and lows of each Kill zone allowing SMC traders to monitor Time-Based Liquidity above the highs and lows of each trading session.
Another added benefit of this indicator is the Standard Deviations features for the AR, CBDR, and FLOUT that we added. The Standard Deviations act as key levels where there is a high probability of price reacting when in confluence with 1H or higher key levels (PD Arrays). The Standard Deviations are not pivot levels but are ranges above and below the Kill Zones that rely on TIME and PRICE in their calculations.
Finally, we have also incorporated a Notification function to remind the trader of the start of the trading Kill Zones to not miss out on potential trade opportunities.
Key Functionalities
1) Universal Time Reference:
Every day starts at 00:00 NY Midnight, irrespective of the trader's local time, Instead of the Standard GMT Midnight. This allows all Kill Zones to be in line with the New York start of the day at Midnight, as thought by ICT.
Weekend Highlighter
This feature highlights time from Sunday Market Open at 5 PM NY Time to 00:00 NY Midnight.
It's useful for identifying the non-trading or the low volatility periods when trading should be avoided.
Features Breakdown
Lookback Period
Defaulted to 60 trading days, aligning with “IPDA Data Ranges”, which is ideal for backtesting.
Adjustable for trading, and it's recommended to keep it at 20 trading days to focus on most recent data only.
24-hour Daily Intervals
The 24-hour intervals are not the same as the usual daily candle. Instead, the start of each trading day is anchored to the 00:00 NY Midnight.
Highlights "Days of the Week" labels, "Weekend" Trading Time, and the daily high-low ranges based on the start of trading day mark being at 00:00 NY Midnight.
London Kill Zone (Green)
Starts from 01:00 NY Time to 05:00 NY Time.
London closes at 12:00 NY Time.
Highlight the high and low of the London Kill Zone to Identify Time-Based Liquidity above and below the London Kill Zone Range.
Marks the London Close Session to mark the end of London End of the trading day, where volatility drops.
Highlights the time when there is the highest volatility during the London Session Kill Zone.
New York Kill Zone (Blue)
Starts from 07:00 NY time to 10:00 NY Time.
Marks The CME Open at 08:30 (the opening of the Bond Market).
Highlight the high and low of the New York Kill Zone to Identify Time-Based Liquidity above and below the NY Kill Zone Range.
Highlights the time when there is the highest volatility during the New York Session.
The Central Bank Dealing Range or "CBDR" (Orange)
Starts From 14:00 NY Time to 20:00 NY Time.
Highlight the high and low of the CBDR Kill Zone to Identify Time-Based Liquidity above and below the CBDR Kill Zone Range.
Also, there is an added ability to add the CBDR Standard Deviations above and below the CBDR.
Can also extend the CBDR Standard Deviations key levels until the end of the next day's London Kill Zone.
What are the CBDR Standard Deviations?
The Standard Deviations are extensions of the CBDR above and below the CBDR original range. It takes the high and low of the range and adds the range above and below the original range by x times.
The CCBDR Standard Deviations are NOT pivot levels. They are used as points of reference where we could expect the price to react when in confluence with higher timeframe reference points.
The idea behind them is that if the price is Bearish, the price could rally to +1 CBDR Standard Deviation below dropping lower. As shown in the image below on Thursday, the two vertical lines before the start of Thursday mark the CBDR Kill Zone, then the price rallied to +1 CBDR SDv and then dropped.
Asian Range "AR" Kill Zone
Starts from 20:00 NY Time to 00:00 NY Time.
Highlight the high and low of the AR Kill Zone to Identify Time-Based Liquidity above and below the AR Kill Zone Range.
Also, there is an added ability to add the AR Standard Deviations above and below the AR.
This KillZone should be primarily used when CBDR exceeds 40 pips.
Similar to the CBDR, the AR Standard Deviations also can be used as points of reference where we could expect the price to react when in confluence with higher timeframe reference points.
The AR Standard Deviations can also be extended until the end of the next day's London Kill Zone.
FLOUT Range
It Combines AR and CBDR, spanning from 14:00 NY Time to 00:00 NY Time.
The FLOUT should only be used when both AR and CBDR have small ranges of less than 10 pips combined.
Highlight the high and low of the FLOUT Kill Zone to Identify Time-Based Liquidity above and below the FLOUT Kill Zone Range.
The FLOUT Standard Deviations also can be used as points of reference where we could expect the price to react when in confluence with higher timeframe reference points.
The Flout Standard Deviations can be extended until the end of the next day London Kill Zone.
Bonus Features
Daily & Weekly Open Price Levels
The Open Price levels draw a horizontal line from the start of the trading day at 00:00 NY midnight, and it extends it towards the end of the trading day.
This is useful for understanding where the price is relative to the daily candle.
When Bullish, the trader should look for setups at or below the daily or weekly open price.
When Bearish, the trader should look for setups at or above the daily or weekly open price.
Whether to choose the Daily or Weekly open price depends on the trader's trading style. If the trader is day trading or scaling, then it's more appropriate to choose the Daily Open Price.
However, Day Traders can also use the Weekly candle to align with the Weekly Candle's expected range direction.
On the other hand, if the trader is a Swing Trader and wants to capitalise on the weekly candle's trend, then it's more appropriate to choose the Weekly Open Price.
However, Swing Traders can also use the Daily Open Price when looking to take a trade to time better entries with a high risk-to-reward ratio.
Notifications
The trader can also receive alerts as a reminder at the start of the desired session to not miss out on the start of the trading session.

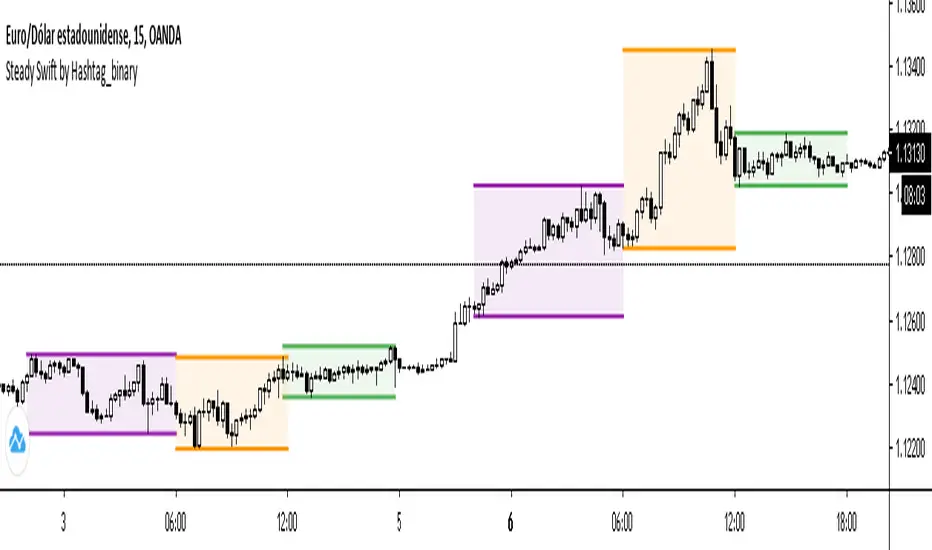
Steady Swift by Hashtag_binarySteady Swift is an indicator that shows the forex sessions and the highest and lowest points of each session of the day.
The sessions that appear on the indicator are Tokyo, London and New York.
The calculation of each session is per hour and goes from 0 to 24 hours, where point 0 begins in the Tokyo session.
In the settings part sessions can be selected or removed, just as you can choose if you want the high and low points to be measured from the wick or the body of the candle, and you can also place the colored background or remove it if you wish (as a preference it is better to leave the background color).
The lines (either current or past) of the high points and the low points of each session can be modified in thickness.
There is a variety to choose the color of the sessions. Even modify the term of each session.
Multi Ticker Session Opening High Low RangeThe Multi Ticker Session Opening High Low Range Indicator by the Caretaker.
The original idea for this indicator came out of a request from Krown's Crypto Cave community member ZFelds.
This indicator is designed to display the High / Low Ranges of the "on chart" asset, at a chosen resolution from the opening time of, and for the duration of, the chosen Ticker Sessions (up to 3) .
Its function is to allow the user to easily keep track of the session times of the major world indices, and the reaction of the on chart assets price from the opening of the ticker sessions over the duration of the ticker sessions.
Typically used for a guide when scalp trading on low time-frames by plotting the opening 1 or 5 minute High/Low trading range of an asset during the start of a major market opening up an d making trading decisions based on the reaction of Price Action around those levels.
It does this by plotting High / Low Range bands (plus mid-lines) which displays the High and Low range of the on chart assets opening candle at the chosen time resolution for the chosen ticker (Defaults : SPX, NI225, UKX).
The Range bands fill colour changes depending on whether the chart asset closes candles within, above, or below the range (Default : Silver, Green, Red).
It plots optional Background "Session Bars" and "Session Banners" which function to clearly show the session.
The background "Session bars" can be set to plot just the first bar as a signal or on all session bars.
The "Session Banners" are horizontal lines of chosen width which "float" above the chart data.
Optional info text-boxes also "float" above the chart data and function to display the session opening range information.
(Ticker symbol, Opening range time resolution, Session open high & low).
The text-boxes can be set to full label or short label.
The text-boxes can be set to the left or center of the session.
The height offset by which the text-boxes and banners float above the highest high of the range is alterable in the settings.
The text-boxes and banners also have a "clash avoidance" function which will offset their heights to help avoid them clashing on screen (This offset is alterable in the settings).
MarkethourXMarkethourX is a precision-based trading indicator designed to identify and visualize the New York trading session range, calculated using GMT-5 (New York Time).
This tool helps traders clearly mark high-probability price zones, session highs/lows, and potential breakout or rejection areas during one of the most volatile and liquid sessions in the Forex market.
The indicator is ideal for day traders, scalpers, and session-based strategy traders who focus on structured price behavior and institutional timing.
Key Features
• Automatically detects the New York session (GMT-5)
• Draws accurate session high and low range
• Highlights key price boundaries for breakout & reversal setups
• Works on all intraday timeframes (best on 1m–15m)
• Clean, non-repainting logic
• Fully automatic – no manual adjustment required
Best Use Cases
✔ Session range breakout trading
✔ Liquidity sweep & rejection setups
✔ Support & resistance confirmation
✔ Scalping during NY volatility
✔ Confluence with market structure & price action
Recommended Markets
• Forex pairs (especially USD pairs)
• Indices (US30, NAS100, SPX)
• Gold (XAUUSD)
Important Notes
⚠️ This indicator is a technical tool, not a buy/sell signal generator
⚠️ Always use proper risk management
⚠️ Best results when combined with price action & trend analysis
Time Zone Reference
📍 Session Time: New York Session (GMT-5)
📍 Indicator calculations are fixed to NY time for accuracy and consistency
Access & Usage
This is a protected, invite-only indicator.
Source code is hidden and cannot be copied or modified.


ICT Silver Bullet Zones (All Sessions)This Pine Script v6 indicator highlights the ICT Silver Bullet windows (10:00–11:00 local time) for all major forex/trading sessions: London, New York AM, New York PM, and Asia.
✅ Features:
Clearly visualizes Silver Bullet zones for each session.
Labels are centered inside each zone for easy identification.
Fully compatible with Pine Script v6 and TradingView.
Adjustable opacity and label size for better chart visibility.
Works on any timeframe and keeps historical zones visible.
Use Case:
Perfect for ICT strategy traders who want to identify high-probability trading windows during major market sessions. Helps in planning entries and understanding liquidity timing without cluttering the chart.
Instructions:
Add the script to your TradingView chart.
Adjust opacity and label size to suit your chart style.
Observe the SB zones for all sessions and plan trades according to ICT methodology.
