Sessions Full Markets [TradingFinder] Forex Stocks Index 7 Time🔵 Introduction
In global financial markets, particularly in FOREX and stocks, precise timing of trading sessions plays a crucial role in the success of traders. Each trading session—Asian, European, and American—has its own unique characteristics in terms of volatility and trading volume.
The Asian session (Tokyo), Sydney session, Shanghai session, European session (London and Frankfurt), and American session (New York AM and New York PM) are examples of these trading sessions, each of which opens and closes at specific times.
This session indicator also includes a Time Convertor, enabling users to view FOREX market hours based on GMT, UTC, EST, and local time. Another valuable feature of this indicator is the automatic detection of Daylight Saving Time (DST), which automatically applies time changes for the New York, London, and Sydney sessions.
🔵 How to Use
The indicator also displays session times based on the exact opening and closing times for each geographic region. Users can utilize this indicator to view trading hours either locally or in UTC time, and if needed, set their own custom trading times.
Additionally, the session information table includes the start and end times of each session and whether they are open or closed. This functionality helps traders make better trading decisions by using accurate and precise time data.
Key Features of the Session Indicator
The session indicator is a versatile and advanced tool that provides several unique features for traders.
Some of these features are :
• Automatic Daylight Saving Time (DST) Detection : This indicator dynamically detects Daylight Saving Time (DST) changes for various trading sessions, including New York, London, and Sydney, without requiring manual adjustments. This feature allows traders to manage their trades without worrying about time changes.
Below are the start and end dates for DST in the New York, London, and Sydney trading sessions :
1. New York :
Start of DST: Second Sunday of March, at 2:00 AM.
End of DST: First Sunday of November, at 2:00 AM
2. London :
Start of DST: Last Sunday of March, at 1:00 AM.
End of DST: Last Sunday of October, at 2:00 AM.
3. Sydney :
Start of DST: First Sunday of October, at 2:00 AM.
End of DST: First Sunday of April, at 3:00 AM.
• Session Display Based on Different Time Zones : The session indicator allows users to view trading times based on different time zones, such as UTC, the local time of each market, or the user’s local time. This feature is especially useful for traders operating in diverse geographic regions.
• Custom Trading Time Setup : Another notable feature of this indicator is the ability to set custom trading times. Traders can adjust their own trading times according to their personal strategies and benefit from this flexibility.
• Session Information Table : The session indicator provides a complete information table that includes the exact start and end times of each trading session and whether they are open or closed. This table helps users simultaneously and accurately monitor the status of all trading sessions and make better trading decisions.
🟣 Session Trading Hours Based on Market Mode and Time Zones
The session indicator provides precise information on the start and end times of trading sessions.
These times are adjusted based on different market modes (FOREX, stocks, and TFlab suggestions) and time zones (UTC and local time) :
🟣 (FOREX Session Time) Forex Market Mode
• Sessions in UTC (DST inactive) :
Sydney: 22:00 - 06:00
Tokyo: 23:00 - 07:00
Shanghai: 01:00 - 09:00
Asia: 22:00 - 07:00
Europe: 07:00 - 16:00
London: 08:00 - 16:00
New York: 13:00 - 21:00
• Sessions in UTC (DST active) :
Sydney: 21:00 - 05:00
Tokyo: 23:00 - 07:00
Shanghai: 01:00 - 09:00
Asia: 21:00 - 07:00
Europe: 06:00 - 15:00
London: 07:00 - 15:00
New York: 12:00 - 20:00
• Sessions in Local Time :
Sydney: 08:00 - 16:00
Tokyo: 08:00 - 16:00
Shanghai: 09:00 - 17:00
Asia: 22:00 - 07:00
Europe: 07:00 - 16:00
London: 08:00 - 16:00
New York: 08:00 - 16:00
🟣 Stock Market Trading Hours (Stock Market Mode)
• Sessions in UTC (DST inactive) :
Sydney: 00:00 - 06:00
Asia: 00:00 - 06:00
Europe: 07:00 - 16:30
London: 08:00 - 16:30
New York: 14:30 - 21:00
Tokyo: 00:00 - 06:00
Shanghai: 01:30 - 07:00
• Sessions in UTC (DST active) :
Sydney: 23:00 - 05:00
Asia: 23:00 - 06:00
Europe: 06:00 - 15:30
London: 07:00 - 15:30
New York: 13:30 - 20:00
Tokyo: 00:00 - 06:00
Shanghai: 01:30 - 07:00
• Sessions in Local Time:
Sydney: 10:00 - 16:00
Tokyo: 09:00 - 15:00
Shanghai: 09:30 - 15:00
Asia: 00:00 - 06:00
Europe: 07:00 - 16:30
London: 08:00 - 16:30
New York: 09:30 - 16:00
🟣 TFlab Suggestion Mode
• Sessions in UTC (DST inactive) :
Sydney: 23:00 - 05:00
Tokyo: 00:00 - 06:00
Shanghai: 01:00 - 09:00
Asia: 23:00 - 06:00
Europe: 07:00 - 16:00
London: 08:00 - 16:00
New York: 13:00 - 21:00
• Sessions in UTC (DST active) :
Sydney: 22:00 - 04:00
Tokyo: 00:00 - 06:00
Shanghai: 01:00 - 09:00
Asia: 22:00 - 06:00
Europe: 06:00 - 15:00
London: 07:00 - 15:00
New York: 12:00 - 20:00
• Sessions in Local Time :
Sydney: 09:00 - 16:00
Tokyo: 09:00 - 15:00
Shanghai: 09:00 - 17:00
Asia: 23:00 - 06:00
Europe: 07:00 - 16:00
London: 08:00 - 16:00
New York: 08:00 - 16:00
🔵 Setting
Using the session indicator is straightforward and practical. Users can add this indicator to their trading chart and take advantage of its features.
The usage steps are as follows :
Selecting Market Mode : The user can choose one of the three main modes.
Forex Market Mode: Displays the forex market trading hours.
oStock Market Mode: Displays the trading hours of stock exchanges.
Custom Mode: Allows the user to set trading hours based on their needs.
TFlab Suggestion Mode: Displays the higher volume hours of the forex market in Asia.
Setting the Time Zone : The indicator allows displaying sessions based on various time zones. The user can select one of the following options:
UTC (Coordinated Universal Time)
Local Time of the Session
User’s Local Time
Displaying Comprehensive Session Information : The session information table includes the opening and closing times of each session and whether they are open or closed. This table helps users monitor all sessions at a glance and precisely set the best time for entering and exiting trades.
🔵Conclusion
The session indicator is a highly efficient and essential tool for active traders in the FOREX and stock markets. With its unique features, such as automatic DST detection and the ability to display sessions based on different time zones, the session indicator helps traders to precisely and efficiently adjust their trading activities.
This indicator not only shows users the exact opening and closing times of sessions, but by providing a session status table, it helps traders identify the best times to enter and exit trades. Moreover, the ability to set custom trading times allows traders to easily personalize their trading schedules according to their strategies.
In conclusion, using the session indicator ensures that traders are continuously and accurately informed of time changes and the opening and closing hours of markets, eliminating the need for manual updates to align with DST changes. These features enable traders to optimize their trading strategies with greater confidence and up-to-date information, allowing them to capitalize on opportunities in the market.
Cari dalam skrip untuk "session"

Session VWAPs [cryptalent]This indicator provides a more granular and timely analysis of market structure compared to traditional daily Volume Weighted Average Price (VWAP). It splits the 24-hour trading day into four distinct, customizable sessions (T1, T2, T3, T4), calculating an independent Session VWAP and Standard Deviation Bands for each segment.
🌟 Key Features and Functionality
1. Segmented VWAP Calculation
Purpose: To track the true Volume Weighted Average Price (Fair Value) specific to the participants and trading activities within different global market sessions (e.g., Asian, European, US sessions).
Design: By default, the 24 hours (based on UTC time) are divided into T1 (00:00-06:00), T2 (06:00-12:00), T3 (12:00-20:00), and T4 (20:00-00:00).
Mechanism: The VWAP calculation resets at the start of each designated session, offering a clearer, segment-specific view of market consensus and volume absorption.
2. Standard Deviation Bands
Calculation: Each Session VWAP line is accompanied by upper and lower standard deviation bands.
Control: The width of these bands is controlled by the user input "Band Multiplier" (default is 1.0, representing one standard deviation).
Application: These bands measure the Volume-Weighted Volatility and define the expected "normal" trading range for the current session.
- Price within the bands suggests consolidation or a normal auction process.
- Price breaking out of the bands indicates strong directional momentum or an extreme/overbought/oversold condition for that specific session.
3. High Customization (User Inputs)
Session Timing: All four session start and end times (in UTC) are customizable, allowing traders to align the indicator with specific market hours or individual trading strategies.
Price Source: The source price used for the VWAP calculation is selectable (default is close).
💡 Trading Applications
1. Fair Value Identification: The VWAP line serves as the "Fair Value" or "Volume-Weighted Consensus Cost" for the active session.
Price above VWAP: Buyers are in control during that session.
Price below VWAP: Sellers are in control during that session.
2. Dynamic Support & Resistance: Both the VWAP and the Standard Deviation Bands often act as reliable dynamic support and resistance levels.
3. Volatility Assessment: The width of the bands reflects the volume-weighted volatility of the current session. Narrow bands suggest range-bound trading; wide bands imply strong directional activity.
4. Trend Strength: Sustained price action outside of the standard deviation bands is a key measure of the strength and commitment behind a current trend.

Session Volume Analyzer [JOAT]
Session Volume Analyzer — Global Trading Session and Volume Intelligence System
This indicator addresses the analytical challenge of understanding market participation patterns across global trading sessions. It combines precise session detection with comprehensive volume analysis to provide insights into when and how different market participants are active. The tool recognizes that different trading sessions exhibit distinct characteristics in terms of participation, volatility, and volume patterns.
Why This Combination Provides Unique Analytical Value
Traditional session indicators typically only show time boundaries, while volume indicators show raw volume data without session context. This creates analytical gaps:
1. **Session Context Missing**: Volume spikes without session context provide incomplete information
2. **Participation Patterns Hidden**: Different sessions have different participant types (retail, institutional, algorithmic)
3. **Comparative Analysis Lacking**: No easy way to compare volume patterns across sessions
4. **Timing Intelligence Absent**: Understanding WHEN volume occurs is as important as HOW MUCH volume occurs
This indicator's originality lies in creating an integrated session-volume analysis system that:
**Provides Session-Aware Volume Analysis**: Volume data is contextualized within specific trading sessions
**Enables Cross-Session Comparison**: Compare volume patterns between Asian, London, and New York sessions
**Delivers Participation Intelligence**: Understand which sessions are showing above-normal participation
**Offers Real-Time Session Tracking**: Know exactly which session is active and how current volume compares
Technical Innovation and Originality
While session detection and volume analysis exist separately, the innovation lies in:
1. **Integrated Session-Volume Architecture**: Simultaneous tracking of session boundaries and volume statistics creates comprehensive market participation analysis
2. **Multi-Session Volume Comparison System**: Real-time calculation and comparison of volume statistics across different global sessions
3. **Adaptive Volume Threshold Detection**: Automatic identification of above-average volume periods within session context
4. **Comprehensive Visual Integration**: Session backgrounds, volume highlights, and statistical dashboards provide complete market participation picture
How Session Detection and Volume Analysis Work Together
The integration creates a sophisticated market participation analysis system:
**Session Detection Logic**: Uses Pine Script's time functions to identify active sessions
// Session detection based on exchange time
bool inAsian = not na(time(timeframe.period, asianSession))
bool inLondon = not na(time(timeframe.period, londonSession))
bool inNY = not na(time(timeframe.period, nySession))
// Session transition detection
bool asianStart = inAsian and not inAsian
bool londonStart = inLondon and not inLondon
bool nyStart = inNY and not inNY
**Volume Analysis Integration**: Volume statistics are calculated within session context
// Session-specific volume accumulation
if asianStart
asianVol := 0.0
asianBars := 0
if inAsian
asianVol += volume
asianBars += 1
// Real-time session volume analysis
float asianAvgVol = asianBars > 0 ? asianVol / asianBars : 0
**Relative Volume Assessment**: Current volume compared to session-specific averages
float volMA = ta.sma(volume, volLength)
float volRatio = volMA > 0 ? volume / volMA : 1
// Volume classification within session context
bool isHighVol = volRatio >= 1.5 and volRatio < 2.5
bool isVeryHighVol = volRatio >= 2.5
This creates a system where volume analysis is always contextualized within the appropriate trading session, providing more meaningful insights than raw volume data alone.
Comprehensive Session Analysis Framework
**Default Session Definitions** (customizable based on broker timezone):
- **Asian Session**: 1800-0300 (exchange time) - Represents Asian market participation including Tokyo, Hong Kong, Singapore
- **London Session**: 0300-1200 (exchange time) - Represents European market participation
- **New York Session**: 0800-1700 (exchange time) - Represents North American market participation
**Session Overlap Analysis**: The system recognizes and highlights overlap periods:
- **London/New York Overlap**: 0800-1200 - Typically the highest volume period
- **Asian/London Overlap**: 0300-0300 (brief) - Transition period
- **New York/Asian Overlap**: 1700-1800 (brief) - End of NY, start of Asian
**Volume Intelligence Features**:
1. **Session-Specific Volume Accumulation**: Tracks total volume within each session
2. **Cross-Session Volume Comparison**: Compare current session volume to other sessions
3. **Relative Volume Detection**: Identify when current volume exceeds historical averages
4. **Participation Pattern Analysis**: Understand which sessions show consistent high/low participation
Advanced Volume Analysis Methods
**Relative Volume Calculation**:
float volMA = ta.sma(volume, volLength) // Volume moving average
float volRatio = volMA > 0 ? volume / volMA : 1 // Current vs average ratio
// Multi-tier volume classification
bool isNormalVol = volRatio < 1.5
bool isHighVol = volRatio >= 1.5 and volRatio < 2.5
bool isVeryHighVol = volRatio >= 2.5
bool isExtremeVol = volRatio >= 4.0
**Session Volume Tracking**:
// Cumulative session volume with bar counting
if londonStart
londonVol := 0.0
londonBars := 0
if inLondon
londonVol += volume
londonBars += 1
// Average volume per bar calculation
float londonAvgVol = londonBars > 0 ? londonVol / londonBars : 0
**Cross-Session Volume Comparison**:
The system maintains running totals for each session, enabling real-time comparison of participation levels across different global markets.
What the Display Shows
Session Backgrounds — Colored backgrounds indicating which session is active
- Pink: Asian session
- Blue: London session
- Green: New York session
Session Open Lines — Horizontal lines at each session's opening price
Session Markers — Labels (AS, LN, NY) when sessions begin
Volume Highlights — Bar coloring when volume exceeds thresholds
- Orange: High volume (1.5x+ average)
- Red: Very high volume (2.5x+ average)
Dashboard — Current session, cumulative volume, and averages
Color Scheme
Asian — #E91E63 (pink)
London — #2196F3 (blue)
New York — #4CAF50 (green)
High Volume — #FF9800 (orange)
Very High Volume — #F44336 (red)
Inputs
Session Times:
Asian Session window (default: 1800-0300)
London Session window (default: 0300-1200)
New York Session window (default: 0800-1700)
Volume Settings:
Volume MA Length (default: 20)
High Volume threshold (default: 1.5x)
Very High Volume threshold (default: 2.5x)
Visual Settings:
Session colors (customizable)
Show/hide backgrounds, lines, markers
Background transparency
How to Read the Display
Background color shows which session is currently active
Session open lines show where each session started
Orange/red bars indicate above-average volume
Dashboard shows cumulative volume for each session today
Alerts
Session opened (Asian, London, New York)
High volume bar detected
Very high volume bar detected
Important Limitations and Realistic Expectations
Session times are approximate and depend on your broker's server timezone—manual adjustment may be required for accuracy
Volume data quality varies significantly by broker, instrument, and market type
Cryptocurrency and some forex markets trade continuously, making traditional session boundaries less meaningful
High volume indicates participation level only—it does not predict price direction or market outcomes
Session participation patterns can change over time due to market structure evolution, holidays, and economic conditions
This tool displays historical and current market participation data—it cannot predict future volume or price movements
Volume spikes can occur for numerous reasons unrelated to directional price movement (news, algorithmic trading, etc.)
Different instruments exhibit different session sensitivity and volume patterns
Market holidays and special events can significantly alter normal session patterns
Appropriate Use Cases
This indicator is designed for:
- Market participation pattern analysis
- Session-based trading schedule planning
- Volume context and comparison across sessions
- Educational study of global market structure
- Supplementary analysis for session-based strategies
This indicator is NOT designed for:
- Standalone trading signal generation
- Volume-based price direction prediction
- Automated trading system triggers
- Guaranteed session pattern repetition
- Replacement of fundamental or sentiment analysis
Understanding Session Analysis Limitations
Session analysis provides valuable context but has inherent limitations:
- Session patterns can change due to economic conditions, holidays, and market structure evolution
- Volume patterns may not repeat consistently across different market conditions
- Global events can override normal session characteristics
- Different asset classes respond differently to session boundaries
- Technology and algorithmic trading continue to blur traditional session distinctions
— Made with passion by officialjackofalltrades

Session Volatility MonitorOverview
Session Volatility Monitor is a versatile volatility indicator tailored for intraday and session-based trading. It computes the average maximum price deviation (either up or down) from the session's opening price over a user-specified number of prior days, providing insights into expected "room to move" in the current session. This helps traders gauge potential exhaustion points, set realistic targets or stops, and identify when a directional move has reached historical norms (flagged as "REACHED" with the exact price level).
Displayed via a customisable table and optional horizontal target lines, it's ideal for markets like forex, crypto, futures, or stocks where session volatility matters. The indicator supports custom sessions with timezone adjustments, making it adaptable to global trading hours (e.g., London, NY, or Asia kill zones). For assets with small tick sizes (e.g., forex pairs at 0.0001), a multiplier scales values for readability (e.g., showing pips as 67.0 instead of 0.00670).
Key Features
Session-Based Calculations:
Defines sessions via presets (e.g., "NY Kill Zone: 07:00-10:00") or custom HHMM-HHMM inputs. (please note that preset sessions are mainly for futures e.g. "Full Day18:01-17:00", but also can be useful for forex and crypto)
Adjustable UTC offset (e.g., -5 for ET) to align with your asset's timezone—ensures accurate detection regardless of TradingView's UTC internal clock.
Tracks the max one-sided move (high - open or open - low) per session, averaging over 1–N previous days (default: 14).
Table Display:
Avg Max Move: Historical average deviation, labeled with days averaged and session time.
Current Move: Real-time displacement from session open (positive for up, negative for down).
Room to Go Up/Down: Remaining distance to reach the average, updating live; appends "REACHED (price)" if hit during the session.
Customisable: Text color, font size (tiny to huge), position (e.g., bottom_left), and value scaling via multiplier/decimal places.
Target Lines:
Optional horizontal lines at "Up Target" (open + avg move) and "Down Target" (open - avg move).
Lines start at the session open bar and extend only through the session duration (e.g., stops at 12:00 for a 07:00-12:00 session)—no further projection post-session.
Fully customisable: Toggle on/off, color, style (solid/dotted/dashed), width, label text/background.
Display Adjustments for Forex/Crypto:
Multiplier: Scales raw values (e.g., set to 10000 for EURUSD to show pips like 45.0 instead of 0.0045).
Decimals: Controls precision (0–5 places) for table values.
How to Use
Add to Chart: Search for "Session Volatility Monitor" in TradingView's indicators and apply to your symbol (e.g., EURUSD for forex, NQ1! for futures, BTCUSD for crypto).
Configure Settings:
Select a session preset or custom range; adjust UTC offset if needed (e.g., +0 for UTC symbols like crypto).
Set "Number of Previous Days to Average" (e.g., 14 for a two-week look back).
For small-tick assets, set Multiplier (e.g., 100 for crypto points, 10000 for forex pips) and Decimals (e.g., 0 for whole numbers).
Customise table position/size/color and target lines for visibility.
Interpret Outputs:
Monitor the table for "room to go"—if Room Up is low/negative, upside might be limited; "REACHED" signals a potential reversal or exhaustion.
Use target lines as visual S/R levels; they auto-start at session open and halt at close.
Combine with price action, volume, or other indicators for entries (e.g., buy near down target if bullish bias).
Example Scenario:
Forex (GBPUSD, 1-min): Set session to "London Kill Zone: 02:00-05:00" (UTC+0), multiplier=10000. Table shows pips; lines mark expected highs/lows.
Limitations and Tips
Historical Data Limits: Averages are capped by TradingView's bar history (e.g., ~14 days on 1-min for free plans). Upgrade for deeper look backs or use higher timeframes.
Session Accuracy: Ensure UTC offset matches your chart—test with the "In Session" plot (enable in Style tab, zoom y-axis if columns are tiny).
No Alerts/Signals: Purely informational; add custom alerts via TradingView for "REACHED" conditions.
Performance: On very low timeframes with long sessions, lines might consume line limits (max ~50)—toggle off if needed.
Tips: For crypto/forex, experiment with multiplier to match your preferred units (e.g., points vs. decimals). Hide debug plot in Style tab for clean charts. If "REACHED" doesn't trigger, verify on historical data where moves exceed averages.
This tool draws from concepts like Average Daily Range but focuses on directional, session-specific volatility for precise intraday decision-making. Feedback welcome!
Disclaimer
This indicator is for educational purposes only and does not constitute financial advice. Always consult a professional before trading.

Sessions and Killzones [Tradeuminati]Tradeuminati – Sessions & Killzones is a New York local time based session toolkit designed for traders who want clean, objective session structure on their chart: session boundaries, killzones, session highs/lows, and previous day levels plus a live “liquidity taken” checklist.
Key Features
1) Sessions (New York Time)
London Session (0:00 – 6:00 NY)
- Vertical start/end lines
- Live session High and Low tracking during the session
- High/Low levels extend until 16:00 NY
- Labels: Ls - H and Ls - L
- Option to display only the current day
Asia Session (Previous Day, 18:00 – 00:00 NY)
- Vertical start/end lines for the previous day session
- Live session High and Low tracking
- High/Low levels extend into the next day until 16:00 NY
- Labels: As - H and As - L
- Option to display only the current day
2) Killzones (New York Time)
London Killzone: 2:00 – 5:00 NY
- Optional DAX-only mode: If enabled, DAX uses 3:00 – 5:00 NY (DAX opening), while other assets remain 2:00 – 5:00 NY
New York Killzone (auto-adjust by asset type)
- Indices: 9:30 – 11:00 NY
- Other assets (FX / Commodities / Crypto): 7:00 – 10:00 NY
New York PM Killzone: 14:00 – 15:00 NY (all assets)
ll killzone lines are placed from the start of the NY day, so you can see upcoming killzones in advance (not only after candles appear).
3) Previous Day High / Low (PDH / PDL)
- Automatically calculates the full previous NY day range (00:00 – 23:59 NY)
- Plots PDH and PDL into the current day
- Labels: PDH and PDL
4) Live “Liquidity Taken” Table
- A compact table in the bottom-left shows whether price has:
- swept Asia High / Asia Low
- swept London High / London Low
- taken PDH / PDL
A green checkmark appears instantly once a level is broken.
Customization
Fully adjustable colors, widths, and line styles for:
- Session vertical lines
- Session high/low lines
- Killzones
- PDH/PDL
Adjustable label size
Day filtering options (current day only)
-----
Disclaimer
This indicator is for educational and technical analysis purposes only. It does not constitute financial or investment advice. Trading involves risk.

Sessions & ORB Pro | Bifrost InstituteSessions & ORB Pro | BI
Professional Session Analysis and Opening Range Breakout Tracker
This advanced indicator provides comprehensive session tracking and Opening Range Breakout (ORB) analysis across multiple global trading sessions. Designed for intraday traders, this tool helps identify key support and resistance levels, session volatility patterns, and potential breakout opportunities.
Overview
Session-based trading is crucial for understanding market behavior, as different global sessions (US, European, Asian) exhibit distinct characteristics in terms of volatility, volume, and price action. This indicator allows traders to:
Identify Session Highs and Lows: Track the boundaries of each trading session to spot key support/resistance levels
Monitor Opening Range Breakouts: Capture the first 5, 15, or 30 minutes of major exchange openings to identify early directional bias
Analyze Multi-Session Patterns: View up to 4 concurrent or sequential sessions with full historical data
Customize Visual Analysis: Tailor colors, styles, and overlays for each session independently
Key Features
Multi-Session Support
Configure up to 4 independent trading sessions (US, Europe, Asia, Custom)
Fully customizable session times with timezone support (UTC offset, Chart timezone, or Exchange timezone)
Daylight Savings Time adjustment for accurate session timing
Session range boxes with adjustable transparency and outline styles
Historical session tracking (1-20 previous sessions)
Opening Range Breakout (ORB)
Track Opening Range for major exchanges: NYSE, LSE, TSE, TSX, ASX, HKEX, SSE
Configurable ORB periods: 5-minute, 15-minute, or 30-minute ranges
Visual ORB boxes with customizable colors and outline styles
ORB High/Low lines with optional extension beyond session close
Individual color control for each session's ORB
Session Analytics
Session High/Low: Horizontal lines marking the session's price extremes
Trendline: Linear regression trendline showing session directional bias
Mean: Session average price for mean reversion analysis
VWAP: Volume-weighted average price for institutional level analysis
Range Boxes: Visual representation of each session's price range
Advanced Customization
Individual Color Pickers: Set unique colors for each overlay type per session
Line Styles: Choose between Solid, Dashed, or Dotted for all line types
Label Options: Customize labels to show Date (d/M), Day of Week (ddd), and/or Price
Extend Options: Extend Session H/L and ORB lines beyond current bar
Outline Styles: Independent control of Range and ORB outline appearance
Information Dashboard
Optional real-time dashboard displaying:
Session Status: Open/Closed indicator for each session
Trend: R² correlation coefficient showing directional strength
Volume: Cumulative session volume
σ (Sigma): Session standard deviation for volatility analysis
Range: Session High, Low, and Range in points
ORB: Opening Range High, Low, and Range in points
Dashboard is fully customizable with toggleable columns and adjustable size/position.
Flexible Configuration
Time Zone Management: Three modes for precise session timing
Historical Display: Show/hide previous sessions for cleaner charts
Label Customization: Independent label size and content options for Session H/L vs ORB
Range Settings: Adjustable transparency, outlines, and label positioning
Use Cases
Session Traders: Identify when specific markets are most active and volatile
ORB Traders: Capture early session momentum and breakout opportunities
Support/Resistance: Use session highs/lows as key price levels
VWAP Strategies: Track institutional activity through session VWAP
Multi-Market Analysis: Monitor overlap between global trading sessions
Default Configuration
The indicator comes pre-configured with US (NYSE), Europe (LSE), and Asia (TSE) sessions, making it immediately useful for forex, indices, and global equity traders. Session D is available for custom session requirements.
Perfect for day traders, scalpers, and swing traders who rely on session-based analysis and institutional order flow.

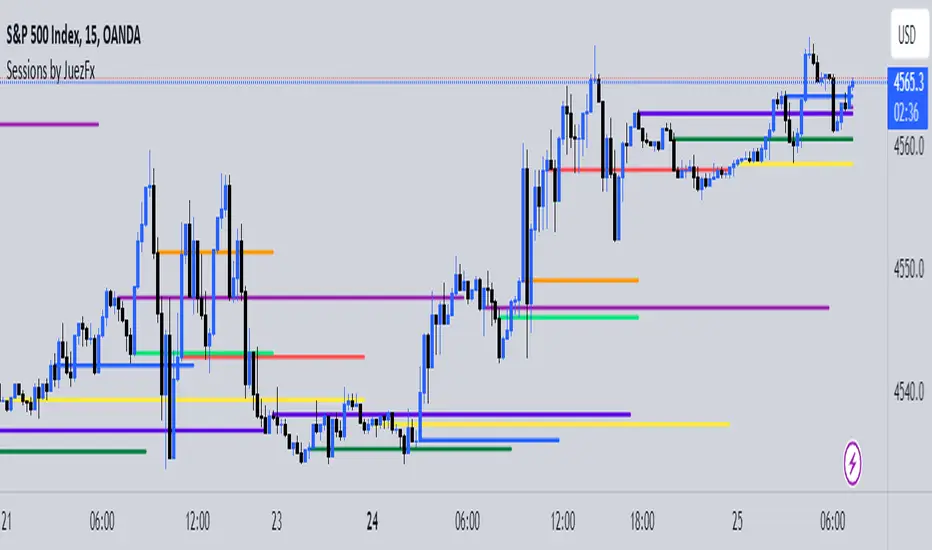
Sessions by JuezFxLines Plotted at the opening price of London, New York, New York Stock Exchange, and Asia. It could also plot lines of the closing price of the session.
The script is just plotting a line at those levels to give us a visual indicator of those specific levels as they could be very beneficial for your trading. Opening and closing of the session hold the most liquidity, attracting the market towards it.
I hope this script will help you in your trading and you can use those levels along with other confluences in order to identify key levels that the market could react from!
There are some similar scripts but this one have more lines to plot at could be identified by different color and line thickness!
LL Sessions & LevelsSessions High & Low Levels (EST)
This indicator plots key intraday session levels on US markets using Eastern Time, designed for futures and index traders who want clear structure without clutter.
It automatically tracks and displays:
Asia session high and low (7:00 PM – 4:00 AM EST)
Overnight high and low (12:00 AM – 2:59 AM EST)
London pre-market high and low (3:00 AM – 8:59 AM EST)
Previous day New York session high and low (9:00 AM – 4:00 PM EST)
New York opening print (9:00 AM EST)
All levels are drawn as dotted horizontal lines that extend across the entire chart, with text labels aligned to the right showing the exact price in standard market format. Labels automatically offset sideways when levels are close together, keeping everything readable.
The indicator redraws cleanly on each update, so levels stay accurate when zooming, panning, or changing bar spacing. Each session group can be toggled on or off from the settings panel, making it easy to focus only on the levels you trade.
This tool is built for traders who use session highs and lows as areas of interest for reactions, fades, and context, not as signals or trade automation.
No alerts. No signals. Just clean session structure.

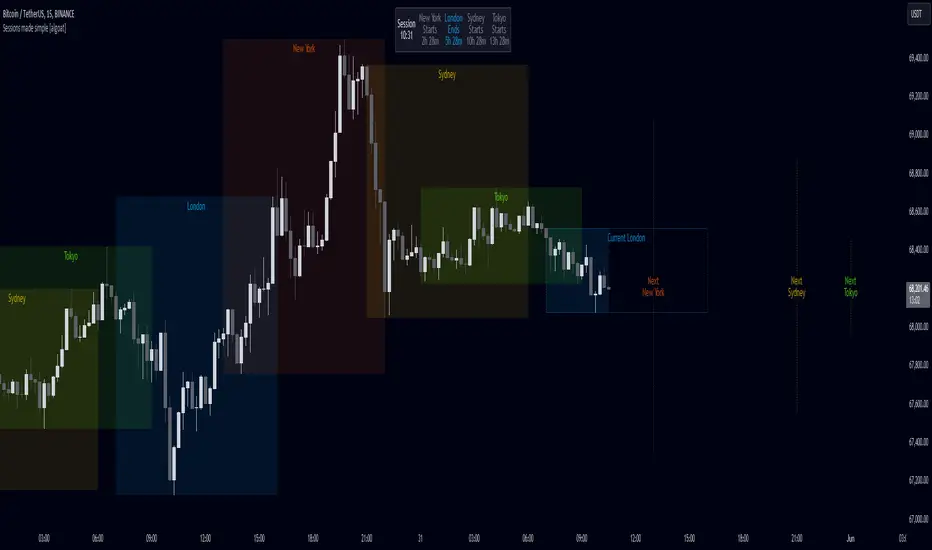
Sessions made simple [algoat]The indicator — by default — provides a clear and concise representation of the four major global trading sessions. Each session is distinctly marked on your trading chart, helping you visualize the specific time periods when these markets are most active. Whether you're a day trader looking to exploit intraday volatility or a long-term investor wanting to understand broader market trends, the Market Sessions feature can be a useful tool in your trading toolkit. The indicator comes with a dashboard, displaying the remaining time until the session end if the session is active and next start if the session is inactive.
Don't forget to align indicator timezone settings according to your region!
⭐ Key Features:
Visual Session Markers
Each of the four trading sessions is fully configurable by visibility, title, time range, and more. The enabled sessions are distinctly marked on the chart with customizable colors, various display options, current sessions' end time and next sessions' start time.
Session Dashboard
The indicator includes a dashboard that displays the remaining time until the session end if the session is active, and the next start time if the session is inactive. This feature provides a quick reference for traders to plan their trading activities.
Timezone Settings
Easily align the indicator's timezone settings with your region by entering your time zone's offset in UTC hours. This ensures that the session times are accurately displayed according to your local time.
Weekend Visibility
Optionally, you can choose to display or hide weekend sessions based on your trading preferences.
Flexible Configuration
The indicator allows for various configurations such as the maximum timeframe for session display, the position of the dashboard, and the text size for better readability.
══════════════════
🧠 General advice
Trading effectively requires a range of techniques, experience, and expertise. From technical analysis to market fundamentals, traders must navigate multiple factors, including market sentiment and economic conditions. However, traders often find themselves overwhelmed by market noise, making it challenging to filter out distractions and make informed decisions. By integrating multiple analytical approaches, traders can tailor their strategies to fit their unique trading styles and objectives.
Confirming signals with other indicators
As with all technical indicators, it is important to confirm potential signals with other analytical tools, such as support and resistance levels, as well as indicators like RSI, MACD, and volume. This helps increase the probability of a successful trade.
Use proper risk management
When using this or any other indicator, it is crucial to have proper risk management in place. Consider implementing stop-loss levels and thoughtful position sizing.
Combining with other technical indicators
Integrate this indicator with other technical indicators to develop a comprehensive trading strategy and provide additional confirmation.
Conduct Thorough Research and Backtesting
Ensure a solid understanding of the indicator and its behavior through thorough research and backtesting before making trading decisions. Consider incorporating fundamental analysis and market sentiment into your trading approach.
══════════════════
⭐ Conclusion
We hold the view that the true path to success is the synergy between the trader and the tool, contrary to the common belief that the tool itself is the sole determinant of profitability. The actual scenario is more nuanced than such an oversimplification. A word to the wise is enough: developed by traders, for traders — pioneering innovations for the modern era.
Risk Notice
Everything provided by algoat — from scripts, tools, and articles to educational materials — is intended solely for educational and informational purposes. Past performance does not assure future returns.
Sessions: Daily Close, Open, Initial Balance [diJMedia Trading]What This Script Does
This advanced session indicator displays critical trading levels for intraday traders, focusing on three main components:
Session Open and Close Lines - Tracks the opening and closing prices of your configured trading session
Initial Balance (IB) - Shows the high and low range formed during the first period of the session (configurable duration)
IB Extensions (IBx) - Dynamically displays extension levels above and below the initial balance based on the IB range
Previous Daily Close - Extends the previous session's close level into the current session
Key Features
Customizable Session Configuration: Define your preferred trading session (e.g., New York, London, Asia) with custom time zones
Initial Balance Period: Set the IB duration in minutes (default: 60 minutes)
Dynamic IB Extensions: Automatically calculates and displays IBH1, IBH2, IBH3... (above IB) and IBL1, IBL2, IBL3... (below IB) as price reaches these levels
IB Middle Lines: Optional middle lines between IB levels for precise entry/exit points (requires minimum IB range of 3 points)
High Precision: Uses lower timeframe (1-minute) data for accurate IB calculations
Full Customization: Each line type has independent color, width, and style (solid/dashed/dotted) settings
Session Range Display: Shows the total range in points for each session
How to Use It
Setup:
Add the indicator to your intraday chart (Note: does not work on daily/weekly/monthly timeframes)
Configure your trading session time and timezone in the "Session" settings group
Set your preferred Initial Balance duration in minutes
Understanding the Levels:
Open Line (cyan): Session opening price - often acts as support/resistance
Close Line (red): Session closing price - updates in real-time
Daily Close (red): Previous session's close - critical reference level
IB High/Low (blue/red dots): The range established during the initial balance period
IBHx/IBLx (orange): Extension levels measured by the IB range (e.g., IBH1 = IB High + 1 x IB range)
IBM, IBHm, IBLm (purple): Middle lines between IB levels for refined entries
Trading Applications:
Initial Balance Theory: Traders use IB as a measure of volatility; breakouts from IB often indicate trending days
Extension Levels: IBx levels act as natural profit targets and reversal zones
Open/Close Levels: Key support/resistance areas for intraday trading
Previous Daily Close: Essential reference point for gap trading and bias determination
Customization:
Toggle display of each component independently in "Display" settings
Customize colors, line widths, and styles in "Lines" and "Initial Balance" groups
Set maximum number of IBx extension levels (0-10)
Adjust minimum IB range required to display middle lines
Best Practices:
Works best on 5-minute to 60-minute charts
Default 60-minute IB period is standard for equity markets
Adjust IB period based on market volatility (shorter for volatile markets)
Use with volume analysis and price action for confirmation

Session breakThis indicator will show future lines before each session start. It will only show London session and US session start.
You can change the color of the lines and time as per day light savings.

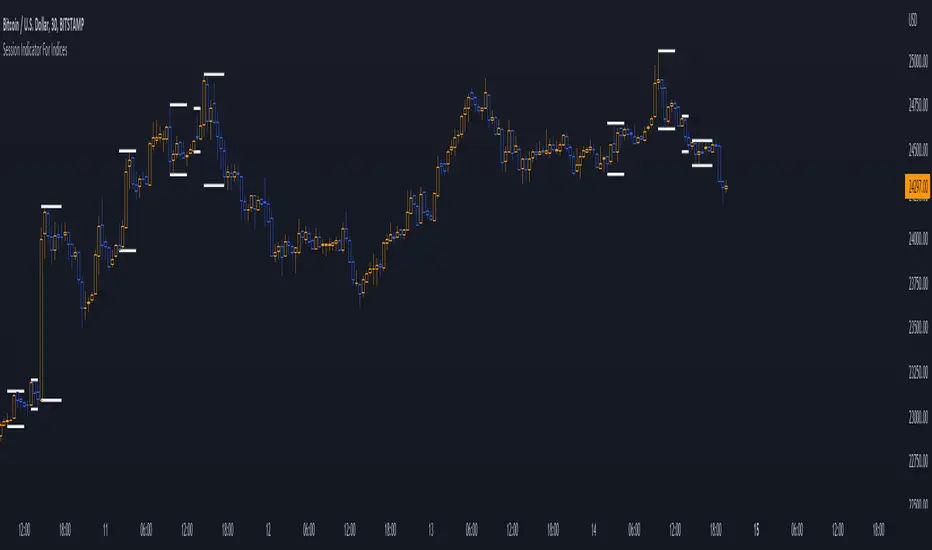
Session Indicator For Indices | @Jonas58328410Welcome guys,
I want to show you the session indicator for indices.
It is an easy, clean, and fast-loading indicator for indice sessions.
The indicator shows you the active sessions and plot those with high lines at the top and low lines at the bottom.
You can modify everything in the settings :
⚙️ Firstly you can modify the timezone, where you live to all supported timezones that tradingview has.
⚙️ Lines can be modified with "line width" and a special tool for backtesting is integrated (max lookback is 500).
⚙️ You can modify all session-related things in the last category.
⚙️ There is a Dashboard, where you can track active sessions.
❗ Note, if you change your timezone, it's recommendable to change the session settings too.
❓If you have any problems, questions, or new feature requests, please send a message in the tradingview comment section!
👌Feedback is greatly appreciated!
👾 Have fun!
Session Levels - Ultimate Range IndicatorSession Levels - Ultimate Range Indicator
Primarily developed for trading the E-MINI Futures Markets like NQ or ES from the CME Group,
but also more than suitable for Crypto or other instruments.
This indicator highlights the chosen session, which can be Globex, Asian, London and New York.
It plots the important levels and also renders the Opening Range as it forms (a.k.a. Initial Balance).
After the 1st hour Opening Range is finished, it can plot the Standard Deviations / Projections.
See below for a complete feature list.
All Opening Ranges on chart and for the New York session the Range Projections are turned on:
s3.tradingview.com
How to use (example):
If you are trading the Nasdaq Futures (NQ!)
Enable the Globex Overnight session. Basically in the Futures Market, the Globex session is everything outside of US trading hours of Stocks. This draws the important overnight levels, like the Low, 25%, 50%, 75% and the High.
Enable the New York Session with Levels and Opening Range. Generally, 70% of the time the 1st hour will put a Low or High of the day.
If the price is trading above the Globex Low, most likely the Low of the Day is formed and the price target for the day will be 1.5x Standard Deviation and 2x Standard Deviation.
[*} Deviation of the Initial Balance depends on the volume ad overall market structure.
** This is not financial advice or any guarantee **
Features:
Show each Session Highlighted on Intraday chart in it's own color (each session can be turned off and has customizable times and color)
Show Line Levels of each session: Low, 25%, 50%, 75% and the High (customizable color)
Show the Opening Range (Initial Balance) of the Asian, London and New York session. Note: NY has more options.
Opening Range is displayed as a box with level lines (customizable color)
Levels are drawn to the end of the NY Cash session (customizable time)
Show IB Standard Deviations 0.5 - 3.0. Calculated from the Opening Range (Initial Balance)
Option to display Higher Timeframe levels: Previous Day Open/Close and Previous Week Open/Close
All level lines and OR boxes size dynamically as the session progresses
Built in Alerts for when price hits key levels. e.g. Alert when price crosses the NY Opening Range High. Or an Alert when the first STDEV is hit.
Option to toggle display of drawings for Today's trading session only, or Show all recent session levels. This keeps the chart clean or not.
Extras:
The NY Opening Range also has a 50% level line
The NY Opening Bar can be highlighted separately
The Level Lines can have small labels turned on/off. Values are only shown on mouse over to keep a clean chart
Keep in mind:
1) This indicator works on all instruments, but on instruments with limited market hours, your chart setting
has to be set to "Extended Hours" otherwise. For example TSLA on NASDAQ.
2) The Exchange Time Zone for the CME Group is Chicago UTC-6. So the session times you configure in the settings menu are based on that timezone too.
3) Globex opens at 5pm CST and closes when the US session starts 8:30CST.
4) When enabling the Alerts in the Indicator settings, be sure to also create an alarm for this indicator using the Alarm function of Tradingview.

Sessions London, NY, Asian*UPDATED* 02/18/2019
I tweaked the code a bit to have a more accurate picture. Enjoy.
-
-
-
-
-
-
I created this indicator to help locate the most traded sessions without having to take the time to locate them.
In order to use this simply click the "favorite" button to the right; then open up your charts, click indicators at the top of your screen and locate your "favorites" tab.
If you trade either London, NY, or Asian session and do not want the other session colors - simple go to indicator settings and click the "checked" boxes that you do not want on you chart.
Also; I created/coded this indication on CST time. I did several time switches and it seem to work on all. IF it doesn't work for you please message me so that I can change that ASAP .
Any and all feedback will be much appreciated. Thanks.
-CP

Sessions (London, NY, Asian)I created this indicator to help locate the most traded sessions without having to take the time to locate them.
If you trade either London, NY, or Asian session and do not want the other session colors - simple go to indicator settings and click the "checked" boxes that you do not want on you chart.
Also; I created/coded this indication on CST time. I did several time switches and it seem to work on all. IF it doesn't work for you please message me so that I can change that ASAP.
Any and all feedback will be much appreciated. Thanks.
-CP

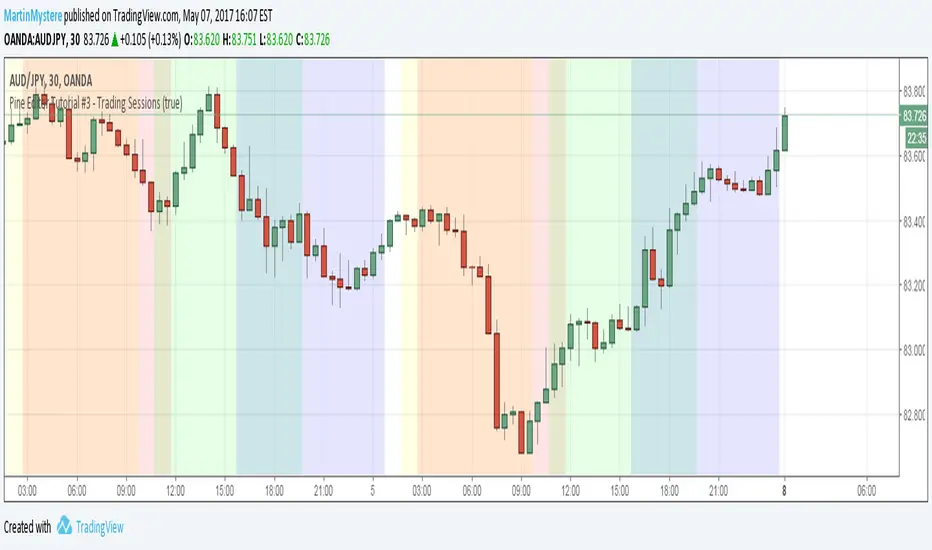
Pine Editor Tutorial #3 - Trading SessionsWelcome to Pine Editor Tutorial #3
On Tutorial #1 : We have plotted circles on each line
On Tutorial #2: We have highlighted a specific day
On this tutorial we will highlight sessions so that we can use them in our strategy at later stage.
Session is defined as an input first so that you can toggle it on and off.
Hope this helps,
Feel free to comment.
MartinMystere
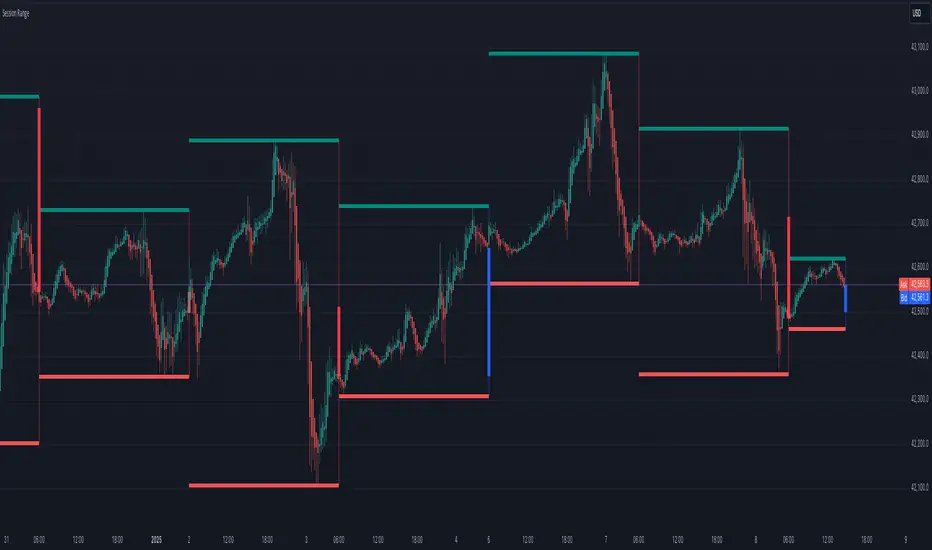
Session Range
Session Range Indicator
The Session Range Indicator is a powerful and flexible tool designed to highlight the high and low price levels of specific trading sessions. It visually marks these key levels on the chart and also displays session-specific candlesticks, helping traders to identify crucial price zones and trading opportunities.
Key Features:
- Customizable Session Timeframe:
Allows users to define the desired session timeframe, with a default setting of Daily. This ensures adaptability for analyzing various trading sessions (e.g., intraday, weekly).
- High-Low Range Highlight:
Displays the High and Low of each selected session as horizontal lines, providing a clear visual reference for support and resistance zones.
- Session Candlestick Representation:
The candlesticks corresponding to each session are distinctly marked, enabling traders to observe session-specific price action directly on the chart.
User-Friendly and Versatile:
Designed for traders of all levels, this indicator enhances decision-making by emphasizing critical price levels within the defined sessions.
Use Case:
This indicator is ideal for traders who rely on session-based analysis, such as day traders, swing traders, or those looking to incorporate session ranges into their trading strategies.
Default Settings:
- Timeframe: Daily
Users can modify the timeframe to suit their analysis needs.
With the Session Range Indicator, users gain an intuitive visualization of session dynamics, aiding in better market analysis and trade execution.
Session Breaks [Market Mindset]Session Break Indicator
This powerful tool marks session breaks on your chart based on your chosen timeframe, helping you quickly spot key points in market sessions.
Customize it to fit your trading style with the following settings:
Resolution: Select the timeframe you want session start and end lines for.
Wait: Turn this on to delay new line creation until the bar closes, keeping your chart clean in real-time.
Styling: Adjust line width and color for optimal clarity.
Perfect for traders wanting a clear view of session transitions and opportunities!

Session Killzone & Liquidity Sweep Engine [2025]A session-based market analysis tool designed to visualize key intraday trading sessions and monitor price interaction with session highs and lows.
The script draws configurable session ranges (Asia, London, New York AM, Lunch, and PM) using session-based boxes. For each session, the high and low levels are calculated in real time and projected forward as reference levels.
Each session high and low reacts dynamically to price behavior:
• If price wicks beyond a session level without a candle close beyond it, the level is marked as a liquidity sweep and stops extending.
• If price closes beyond a session level, the level is considered invalidated and removed.
Optional midpoint levels can be displayed for each session. Users can choose whether levels extend only until mitigation or continue beyond it, as well as whether only the most recent session or all past sessions are tracked.
Additional features include:
• Timezone support with proper session alignment
• Session drawing limits to manage chart clutter
• Timeframe filtering to restrict drawings to lower timeframes
• Optional alerts when session highs or lows are broken by a candle close
• Extensive customization for colors, line styles, labels, and visibility
This tool is intended for traders who analyze intraday price behavior around session highs and lows and want a structured way to observe wick-based interactions and level invalidations.

Session ZonesHow is this different?
After reviewing a handful of session zone based indicators I decided to create this one not seeing exactly what I wanted, even this one only comes partially to my goals. This indicator will add session coloring on the chart in a vertical orientation, up to five sessions currently can be utilized. Timezones can be supplied that are compatible with Trading View so that session times specified in settings can be non-market timezone specific. In a future update I plan to add alerts for price reaching certain sessions, styling of the session zones may change overtime as PineScript feature enhancement allows.
How to use this?
Supply session ranges, color and disable any unneeded, the table at the top right will display whether or not price action is in or out of enabled sessions.
Which market is it meant for?
Any market.
What market conditions does this apply to?
Any condition.

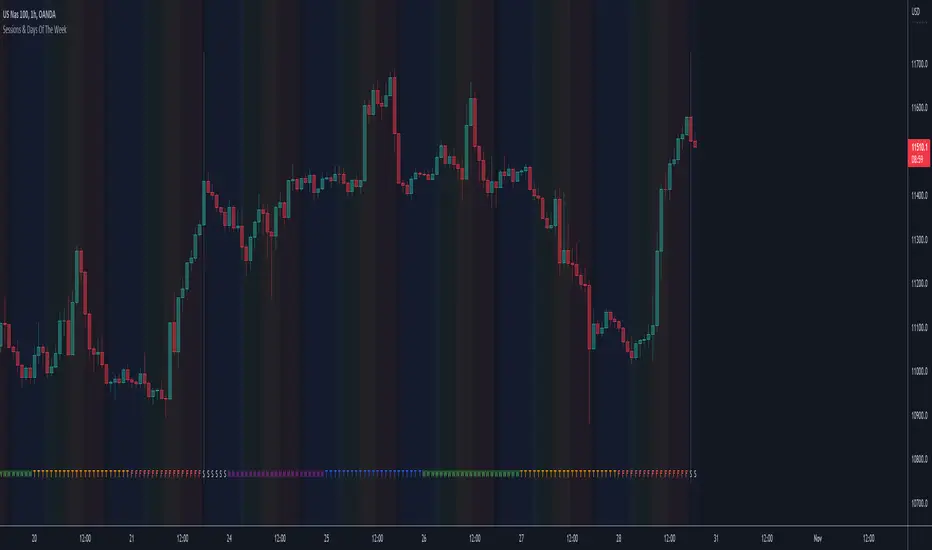
Sessions & Days Of The WeekTraders tend to focus their energy on specific sessions or time periods. This indicator will plot the days of the week, and also highlight the following sessions: Frankfurt (2:00am - 11:00am EST), London (3:00am - 12:00pm EST), New York (8:00am - 5:00pm EST), Sydney (5:00pm - 2:00am EST), Tokyo (7:00pm - 4:00am EST).
It’s important to be aware that Session Open and Close times will vary based on the time of year, as countries shift over to daylight savings time.
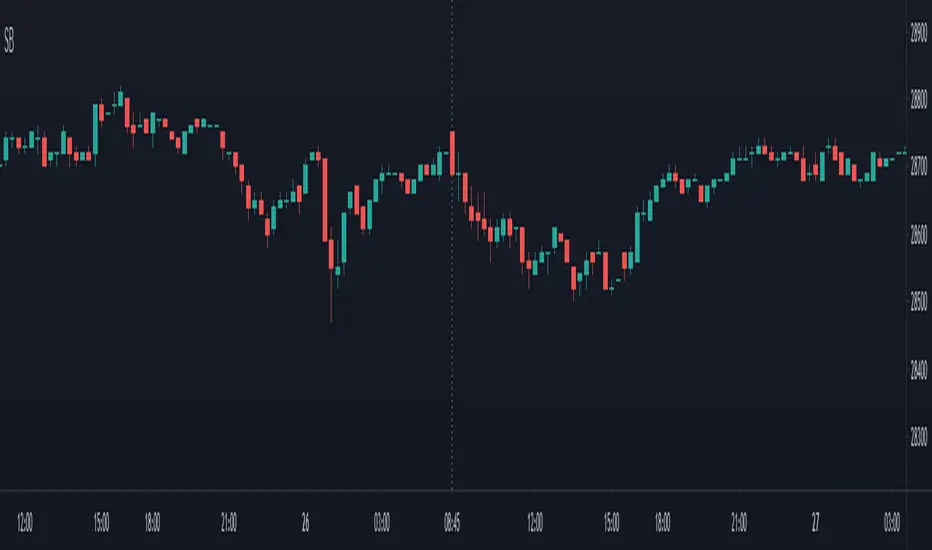
Session break 225The default session break line for the NIKKEI 225 INDEX FUTURES (NK225) is drawn at 16:30 (GMT+9), the start of the night session.
This indicator draws a vertical line at 8:45 a.m (GMT+9), the start of the day session.
It is also possible to change the time at which the vertical line is drawn.
Session LiquidityThe “Session Liquidity” TradingView indicator by Infinity Trading creates dynamic horizontal lines at the high and low points of a specified time span within the trading day. This indicator gives the user control of three separate time spans so the user can dynamically see the highs and lows of their favorite daily time spans.
Purpose
This indicator is similar to my TradingView indicator “Futures Exchange Sessions 3.0”. In that indicator the user gets control of dynamic price boxes. For me, these boxes made it difficult to spot ICT’s Orderblocks. So instead of boxes I made independently controllable lines and now I can spot ICT Orderblocks and easily identify Liquidity Pools.
Inputs and Style
Everything about the three dynamic lines can but independently configured. Start & End Times, Line Color, Line Style, Line Width, Text Characters, Text Size, Text Color can all be adjusted. The high and low lines as well as their text labels can be individually toggled on or off for maximum control.
Timezone
All of the start and end times are in EST. Additionally, each time span line needs a specific start of each day. This is controlled by a setting called “Line Start Day Timezone” where the user sets a timezone that corresponds with the start time. In general if a timespan resides within a particular Session pick the corresponding timezone. If the users line fits in the Asian Session then choose Asia/Shanghai. If the line is within the London Session then choose Europe/London. And the same goes for the New York Session.
Special Notes
If the Line Start Time is within one candle of the Start Day Timezone in the Settings, then the line/box won’t display. So choose the previous timezone
Lines only display when the timeframe is <= 30 minute
Gallery
