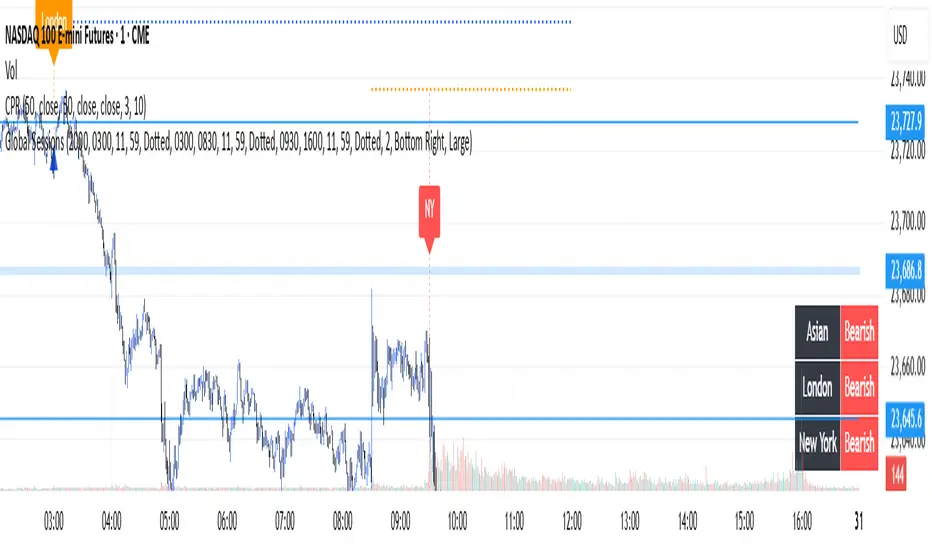
Global Sessions with Trend & Liquidity Features:
-Session ranges with customizable lines & colors
-Opening range markers and optional background shading
-Automatic trend detection per session (Bullish / Bearish / Neutral)
-Indicators when highs/lows are broken
-Clean visual design with toggles for minimal or detailed display
This Pine Script code is designed to help traders visualize and analyze different market sessions. It's a tool that displays the trading hours for the Asian, London, and New York sessions right on the chart.
The main purpose is to show when these key markets are open and to highlight their price ranges. It also includes features to track the trend within each session and to identify "liquidity sweeps" or moments when the price breaks the high or low of a previous session.
In simple terms, it helps a trader see what the market is doing and where the price is likely to go, all based on the major global trading times. It's especially useful for day traders who want to align their strategies with the activity of specific markets.
P.S. Apologies to users not in the EST timezone! This version is hardcoded to Eastern Standard Time, and I'm not currently sure how to automatically adjust it for different timezones. But you can adjust manually and click the dropdown menu to Save As Default.
Cari dalam skrip untuk "session"
ORB Pro SuiteORB Pro Suite v6 — Multi-Session + HTF ORB Build
ORB Pro Suite v6 is an advanced Opening Range Breakout (ORB) tool designed for traders who want clarity, structure, and adaptability across NY, London, and Asia sessions — without changing the core ORB logic that works.
This update expands the original ORB Pro Suite to support overnight markets and multi-timeframe workflows, while keeping the strategy behavior consistent and familiar.
✅ Multi-Session Presets
Choose from built-in session presets:
NY AM (RTH) — original behavior (unchanged)
London
Asia
Custom
Each preset aligns the ORB window with the selected session and pairs seamlessly with session-appropriate filters.
✅ ORB Build Mode
You now have two ways to build your ORB:
1️⃣ Time Window (Classic ORB)
Uses session start/end times
Identical to previous versions
2️⃣ HTF Candle Count (Advanced)
Build the ORB from 5m / 15m / 30m / 60m candles
Works on any chart timeframe
Ideal for traders who want ORB consistency across TFs
Example:
Build a 15-minute ORB from 1× 15m candle, even while trading on a 5m chart.
✅ Session Profile Defaults
ORB Pro Suite introduces Session Profiles that automatically tune filters for different market conditions — without changing the strategy logic.
Profiles include:
NY (Default)
London (Breakout)
Asia (Slow Session)
Custom
You can toggle Profile Defaults ON or OFF at any time.
🧠 Core ORB Logic (Unchanged)
Original ORB framework:
Opening range high/low
Breakout confirmation
Optional retest logic
Golden Pocket (0.5–0.618) validation
Local + higher-timeframe trend filters
Cooldown protection
Visual risk/reward mapping
If you traded NY with earlier versions, nothing has changed.
⚙️ Recommended Starting Settings
For most users:
ORB Build Mode: Time Window
Session Profile: Auto
Strictness: Balanced
Advanced users:
Enable HTF Candle Count
Select desired ORB TF (5m–60m)
Adjust candle count to match your style
All inputs remain fully customizable.
📊 Designed For
Futures (ES, NQ, YM, RTY)
Forex pairs
Gold & major indices
Intraday price-action traders
Session-based trading workflows
⚠️ Disclaimer
This indicator is for educational and informational purposes only.
It does not constitute financial advice or trade recommendations.
Trading involves risk. Always manage risk appropriately and trade responsibly.

TSS by AMAGADONTSS - THE SESSION SETUP
The Methodology
THE SESSION SETUP (TSS) is a price-action framework that utilizes session-specific volatility to define intraday expansion zones. By isolating the opening ranges of the Asia, London, and New York sessions on the 15-minute (M15) timeframe, TSS identifies clear institutional "interest zones."
The algorithm monitors these ranges for two specific price-action events:
Primary Breakouts: Decisive candle closes outside the session boundaries.
Liquidity Reversals (Counter-Signals): Identification of "fake-outs" where price traps initial breakout traders before reversing through the entire session range.
Features
Automated Session Boxes: Dynamic range calculation for all major global sessions.
Precision TP Levels: Systematic profit targets based on the measured session range (R).
Timeframe Integrity: Built-in guard to ensure the logic is only applied to the M15 timeframe, preserving the accuracy of the range calculations.
Visual Median: Dotted mid-lines to identify the "mean" price within a session.
CRITICAL DISCLOSURE - PLEASE READ CAREFULLY
HIGH RISK INVESTMENT WARNING: Trading Foreign Exchange (Forex) is highly speculative, carries a high level of risk, and may not be suitable for all investors. You may sustain a loss of some or all of your invested capital; therefore, you should not speculate with capital that you cannot afford to lose. NO FINANCIAL ADVICE: The TSS - THE SESSION SETUP indicator is a technical analysis tool provided for informational and educational purposes only. It does not constitute investment advice, financial advice, or a recommendation to buy or sell any currency pair or financial instrument.
LIMITATION OF LIABILITY:
Execution Risk: The author does not guarantee the accuracy of signals. Market conditions, including news-driven volatility, spreads, and slippage, can result in trades that differ significantly from the indicator's visual signals.
Backtesting Limitation: Past performance and historical signals are not indicative of future results.
User Responsibility: You are solely responsible for your trading decisions. The author of this script shall not be held liable for any loss or damage, including without limitation, any loss of profit, which may arise directly or indirectly from the use of or reliance on this tool.
BY USING THIS SCRIPT, YOU AGREE THAT YOU ARE TRADING AT YOUR OWN RISK.

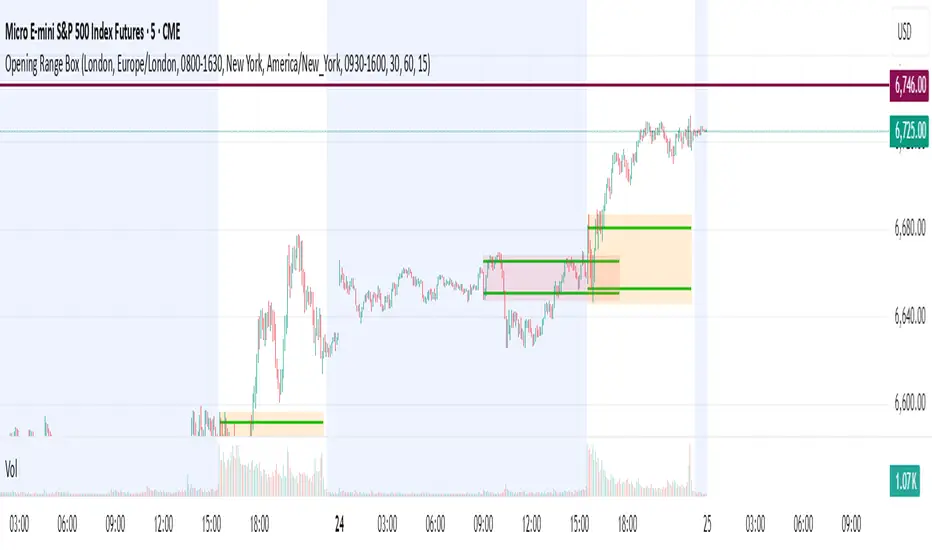
Opening Range Box, 2 SessionsOpening Range & Session Box Indicator
This indicator automatically draws Opening Range (OR) boxes and Session Boxes based on specific time zone settings, helping you visualize key trading periods across different global markets.
Key Features:
Custom Sessions: Define two independent trading sessions (e.g., New York and London).
Time Zone Selection: Choose the exact time zone for each session from a simple dropdown menu, ensuring accurate session mapping regardless of your chart's time zone.
Opening Range Definition: The initial portion of each session (defined by the Opening Range Minutes input) establishes the high and low of the box.
Offset Lines: Automatically draws two percentage offset lines inside the box, allowing you to easily track price movement relative to the Opening Range high and low (e.g., 10% retracement levels).
How to Use the Inputs:
Session A/B Timezone - Select the time zone for Session A (e.g., America/New_York).
Session A/B Time - Define the start and end time for Session A (e.g., 0930-1600).
Opening Range Minutes - Set how long the initial opening range period lasts (e.g., 30 minutes).
Percent from High/Low for Line - Set the percentage distance for the inner offset lines (e.g., 10.0 for 10% retracement).
Number of Boxes to Show - Controls the number of historical session boxes and lines that remain visible on the chart.
Custom Two Sessions H/L/50% LevelsTrack high/low/midpoint levels across two customizable time sessions. Perfect for monitoring H4 blocks, session ranges, or any custom time periods as reference levels for lower timeframe trading.
What This Indicator Does:
Tracks and projects High, Low, and 50% Midpoint levels for two fully customizable time sessions. Unlike fixed-session indicators, you define EXACTLY when each session starts and ends.
Key Features:
• Two independent sessions with custom start/end times (hour and minute)
• High/Low/50% midpoint tracking for each session
• Visual session boxes showing calculation periods
• Horizontal lines projecting levels into the future
• Historical session levels remain visible for reference
• Works on any chart timeframe (M1, M5, M15, H1, H4, etc.)
• Full visual customization (colors, line styles, widths)
• DST timezone support
Common Use Cases:
H4 Candle Tracking - Set sessions to 4-hour blocks (e.g., 6-10am, 10am-2pm) to track individual H4 highs/lows
H1 Candle Tracking - 1-hour blocks for scalping reference levels
Session Trading - ETH vs RTH, London vs NY, Asian session, etc.
Custom Time Periods - Any time range you want to monitor
How to Use:
The indicator identifies key price levels from higher timeframe periods. Use previous session H/L/50% as reference levels for:
Identifying sweep and reclaim setups
Lower timeframe structural flip confirmations
Support/resistance zones for entries
Delivery targets after breaks of structure
Settings:
Configure each session's start/end times independently. The indicator automatically triggers at the first bar crossing into your specified time, making it compatible with all chart timeframes.
BluePrint SessionsBlueprint Sessions is a multi-session visual tool designed to help traders identify the three most important global market opens with precision.
Features:
Adaptive to chart timezone — sessions automatically adjust to the time zone you select in TradingView.
Three Key Market Sessions:
Asian Session
London Session
New York Session

Global Session Zones (Asia / Europe / US) — KSTThis indicator highlights global market sessions (Asia, Europe, US) based on KST (Korea Standard Time).
Each session is displayed with a different background color for better visibility of price flows.
Asia Session: 09:00 – 16:00 KST
Europe Session: 16:00 – 23:00 KST
US Session: 23:00 – 09:00 KST
색상은 사용자 설정 가능하며, 각 시장 세션별 가격 흐름과 패턴을 가시적으로 분석할 수 있도록 도와줍니다.
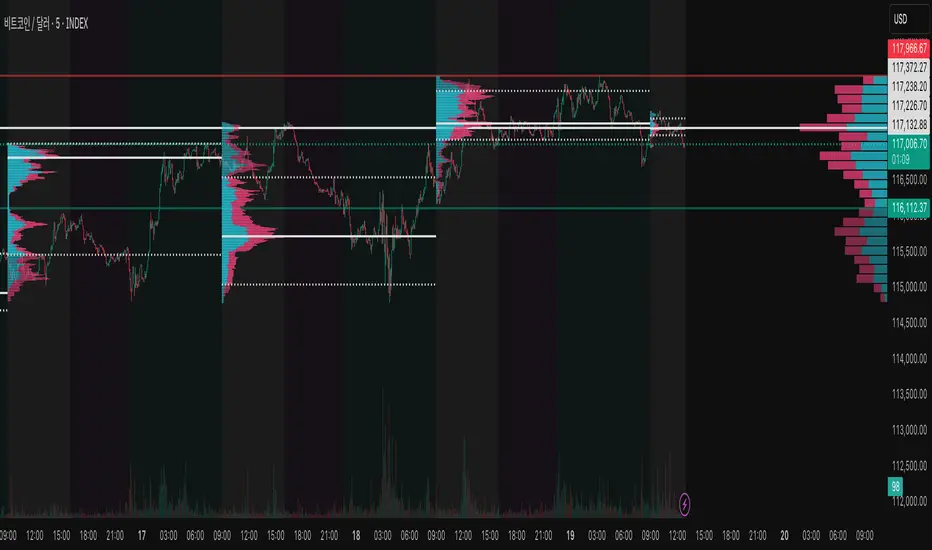
Key levels + Session Range (Sweep-Aware Levels)Overview
This indicator provides a single, clean view of two core intraday contexts that day traders rely on:
Daily Liquidity Levels: prior day high/low (PDH/PDL), prior day open/close, weekly highs/lows, and other commonly referenced reference points.
Session Ranges: clearly plotted high/low for each active session (e.g., Asia, London, New York), tracked live as the session evolves.
By unifying these two information layers, traders can immediately see when price is sweeping a session’s extremes into known daily liquidity—a frequent precursor to reversals or continuation moves. This saves chart space, reduces cognitive overload, and turns two separate checks into one coherent read.
What it does
Plots daily liquidity references: previous day high/low, previous day open/close, and optional higher-timeframe levels (open, high, mid and low 4H ,Day, Week, month, year and quarterly).
Tracks session high/low live: as each session unfolds, the indicator updates that session’s running High and Low, then locks them at session end.
Maps interaction between the two layers: you can instantly spot session sweeps that tag PDH/PDL (or weekly extremes), highlight potential liquidity grabs, and frame risk with objective boundaries.
Keeps the chart clean: just essential lines/zones and concise labels—no extra clutter.
Why it’s useful & original
Single-purpose integration: Rather than a generic mashup, this is a purpose-built fusion where session dynamics are read in the context of daily liquidity. That relationship is the core edge—seeing when a session sweep aligns with known liquidity pools.
Workflow efficiency: One overlay replaces two indicators, simplifying visibility and reducing conflicting visuals.
Decision clarity: The combination highlights setups many intraday traders already watch manually (e.g., NY session high sweep into PDH), but makes them obvious in real time.
How it works (plain-English logic)
Daily Liquidity Engine
At the start of each day, the indicator records PDH, PDL, prior open/close and (optionally) prior week high/low.
These levels are plotted and extended across the session as static references.
Session Range Tracker
For each defined session (e.g., Asia/London/New York), the script initializes session High/Low at session open.
Throughout the session, it updates those extremes in real time and locks them on session close.
Interaction Layer
When price reaches or sweeps a session High/Low near a daily level (e.g., within your chosen tolerance), the confluence becomes visually obvious.
Traders can then decide whether it’s a likely liquidity grab (fade/reversal idea) or a continuation through the pool (breakout idea), per their plan.
How to use it
Identify session context: Start by noting where price is trading relative to the current session’s High/Low.
Locate nearby daily liquidity: Check distance to PDH/PDL, prior open/close, and weekly extremes.
Look for confluence:
Sweep-and-fade idea: Session High swept into PDH (or Session Low into PDL) with failure to hold → potential reversal context.
Break-and-go idea: Strong close through PDH/PDL following a session extreme break → potential continuation context.
Risk framing: Session High/Low and PDH/PDL provide objective anchors for stops and targets. Adapt to your own risk model (e.g., use ATR or structure-based stops).
Keep it clean: Use this as your primary overlay to avoid clutter; add confirmations (volume, structure) only if they genuinely help your process.
Settings (typical options)
Sessions: Choose which sessions to display (e.g., Asia/London/NY) and their time zones/hours.
Daily Levels: Toggle PDH/PDL, prior open/close, prior week High/Low, and other references you rely on.
Visuals: Colors, line styles, label visibility, and optional band shading for quick recognition.
Confluence Tolerance (optional): Define how near a session extreme must be to a daily level to consider it a “liquidity touch/sweep” in your visuals.
Alerts (optional): First touch/sweep of session High/Low, break/close beyond PDH/PDL, or custom distance conditions.
Chart & Publishing Notes (for reviewers and users)
Clean chart by design: Only essential lines/labels for session extremes and daily references.
Plain-English description: Explains what, why, and how so non-coders can use it confidently.
Original integration: The value here is the purposeful interaction—seeing session sweeps in context of daily liquidity in one place—rather than a cosmetic mashup.
Limitations & good practice
This tool is contextual, not predictive. It highlights structure and liquidity landmarks; trade decisions are yours.
Session definitions vary by asset/exchange; ensure your session times match your market.
Past behavior at these levels does not guarantee future outcomes; always use proper risk management.
Disclaimer
This indicator is for educational and informational purposes only and is not financial advice. Trading involves risk; always test and evaluate with your own methods and risk parameters.
kings sessions and openEnhanced Liquidity, Sessions & Opens Indicator
📊 What it does:
A comprehensive trading indicator that combines three powerful features to help identify key market levels and timing.
⚡ Core Features:
🔥 Liquidity Sweeps (Default: ON)
Automatically detects pivot highs and lows
Draws horizontal lines at these levels
Removes lines when price "sweeps" the liquidity (breaks through)
Customizable colors, line styles, and maximum number of lines
🌍 Market Sessions (Default: ON)
Highlights major trading sessions: Asia, London, NY AM, NY PM
Shows session high/low levels with colored lines
Customizable session times and colors
Clean session labels without clutter
📈 Key Open Levels (Default: OFF)
Marks important market open times (8:30, 9:30, 10:00, etc.)
Shows horizontal lines at open prices
Customizable labels and lookback period
Optional feature - enable in settings if needed
🎯 Perfect for:
Scalpers looking for liquidity grabs
Day traders tracking session boundaries
Anyone wanting cleaner charts with key levels
Multi-timeframe analysis

Full Session ATR Range (Live) - with Position ToggleBelow is a publication-ready text for the "Full Session ATR Range (Live) - with Position Toggle" indicator, written in a professional yet accessible style suitable for a trading community (e.g., TradingView or a blog). The text highlights the indicator's features, usage, and benefits, while avoiding overly technical jargon for a broad audience.
---
### Introducing the Full Session ATR Range (Live) Indicator with Position Toggle
Enhance your trading strategy with the **Full Session ATR Range (Live) Indicator**, a powerful tool designed to provide real-time insights into market volatility and session dynamics. This customizable indicator, now available with a position toggle feature, compares the current session's range to a 10-day Average True Range (ATR), helping traders gauge market activity and anticipate potential movements.
#### Key Features
- **Live Range Tracking**: Displays the current session's range (high minus low) alongside a 10-day ATR, updated in real-time during market hours.
- **Session Mode Flexibility**: Includes an auto-toggle option to switch between Electronic Trading Hours (ETH) and Regular Trading Hours (RTH), adapting to your preferred trading session. Manually select ETH or RTH, or let the indicator auto-detect based on market hours.
- **Comprehensive Metrics**: Offers a detailed breakdown including:
- Range/Avg %: Percentage of the current range relative to the 10-day ATR.
- Points Left: Remaining points to reach the average range.
- 100% Range Up/Dn: Potential upper and lower targets based on the ATR difference.
- **Position Customization**: Adjust the table's location on your chart with options like top-left, top-right, middle-center, or bottom-right for optimal visibility.
- **Visual Appeal**: Features a customizable background and text color to match your chart theme.
#### How It Works
The indicator calculates the 10-day ATR using daily data and tracks the current session's range, resetting at the start of each day or session change. During market hours (e.g., 6 AM - 8 PM CDT, adjustable), it updates live, providing actionable insights. When the market is closed, it displays historical ATR while marking live metrics as "n/a" to avoid confusion. The ETH/RTH toggle ensures the range reflects either the full extended session or the core trading hours, tailored to your strategy.
#### Why Use It?
Whether you're a day trader monitoring intraday volatility or a swing trader assessing longer-term trends, this indicator helps you:
- Identify overextended or underactive sessions compared to historical norms.
- Plan entries and exits with targets based on the 100% Range Up/Dn levels.
- Stay informed with a clean, adjustable display that fits your workflow.
#### Installation & Customization
1. Add the indicator to your TradingView chart.
2. Adjust the ATR length (default: 10 days) and table position via the input settings.
3. Choose your session mode (Auto, ETH, or RTH) and customize colors to suit your style.
4. Test during market hours for live updates—note that static values may appear outside trading sessions.
#### Feedback & Support
This indicator is designed for flexibility and ease of use. Share your feedback or request enhancements by commenting below or contacting the developer. Happy trading!

Custom Daily Session Zones by KoenigseggCustom Daily Session Zones
🟣 Description
This indicator displays customizable trading session time zones as background highlights on your chart, on any timeframe you choose. The inline info tooltip provides the precise start and end times of the three largest market sessions—the US, the EU, and ASIA—for quick reference. It provides flexible control over session times for different days of the week, making it ideal for traders who need to visualize specific market hours or trading sessions.
🟣 Key Features
- Flexible Session Configuration: Set a common session time for all days or customize individual sessions for each day of the week
- Per-Day Control: Enable or disable sessions for specific days (Monday through Sunday)
- Color Customization: Choose unique colors for each day's session zones
- UTC Timezone Standard: All session times are defined in UTC to ensure consistency across charts
- Clean Visual Display: Non-intrusive background highlighting that doesn't interfere with price action
🟣 How to Use
- Common Session Mode: Use the default mode to apply the same session time across all enabled days
- Manual Per-Day Mode: Enable "Manual per-day sessions" to set different session times for each day
- Day Selection: Toggle individual days on/off based on your trading schedule
- Color Coding: Customize colors for each day to easily distinguish between different sessions
🟣 Technical Details
- Uses Pine Script v6 for optimal performance
- Implements proper session time detection using TradingView's built-in time functions
- Operates in UTC timezone for all session calculations
- Lightweight code that doesn't impact chart performance
🟣 Use Cases
- Highlight specific trading sessions (London, New York, Tokyo, etc.)
- Mark important market hours for your trading strategy
- Visualize different session overlaps
- Create custom trading time windows
- Track market activity during specific hours
🟣 Compatibility
- Works on all timeframes
- Compatible with all asset classes (Forex, Stocks, Crypto, Futures, etc.)
- Supports all TradingView chart types
- Responsive design that adapts to different screen sizes
🟣 Image Descriptions
- First Image (main image): Shows multiple New York Stock Exchange sessions from 1:30 p.m. to 8:00 p.m. (UTC), on the 15-minute timeframe, with each day’s zone colored differently to demonstrate the indicator’s customizable color settings.
- Second Image: A zoomed‑in fractal chart view of the same New York session on the 15-minute timeframe, illustrating how the background session zone appears even at higher detail levels.
Third Image: A close‑up of the New York session (1:30 p.m. to 8:00 p.m.) on the 3-minute timeframe, reaffirming the consistency of zone highlighting across different zoom levels.
🟣 Future Updates (v2)
In the next release, you’ll be able to define multiple session blocks per day—displaying two distinct colored zones within the same trading day. This will help you visualize when one market session ends and another begins without losing chart clarity.
🟣 Conclusion
This indicator is perfect for traders who need precise control over Market Session visualization and want to maintain a clean, professional chart appearance.
🟣 Disclaimer
This script is provided for educational and illustrative purposes only. It is not financial or trading advice, nor a recommendation to buy or sell any asset. Always conduct your own research and consult a professional before making any trading decisions.

FeraTrading Sessions High/LowThe FeraTradiang Sessions High/Low Indicator plots precise high and low levels for the New York, London, and Asian trading sessions — without any clutter.
We designed this tool for simplicity, clarity and accuracy, automatically adjusting to any timeframe and time zone — no manual setup required.
🔍 Key Features:
Clean horizontal lines marking session highs and lows
Lines start at the actual high/low
Session times:
New York: 09:30 – 17:00
London: 03:00 – 08:00
Asian: 18:00 – 03:00
Real-time updates that trail live candles
Only shows the most relevant sessions:
Yesterday’s NY
Last night’s Asia + morning continuation
Today’s London
Fully customizable:
Session colors
Session toggles
Label toggles
Line extension settings
Enable extended trading hours on your chart for best results.
Whether you're trading futures, forex, or crypto, this indicator provides clean session context without the mess. Open-source for extra customization and designed for real-time usability.

ATR & Session & Pivot & Note – MultiTF Utility**ATR & Session & Pivot – MultiTF Utility**
**Description**:This versatile indicator is designed for technical analysis in Forex, Crypto, Gold, and Silver markets. It displays ATR (Average True Range) values across multiple timeframes (Current, 1m, 5m, 15m, 1H, 4H, 1D, 1W) with TP/SL levels, alongside Pivot Point analysis (minor and major), Structure Lines, and Trading Session Boxes.
**Features:**
- **Multi-Timeframe ATR Table:** Shows ATR values for various timeframes with customizable table position (top/middle/bottom, left/center/right) and decimal precision.
- **Custom Text Colors:** Distinct colors for 5m (red), 1H (blue), My ATR (green), and LQ Close (purple).
- **Pivot Points:** Identifies minor pivots (HH, LH, LL, HL) with 9 left and 4 right bars, and major pivots with 18 left and 9 right bars.
- **Structure Lines:** Displays lines connecting pivots with adjustable style and width.
- **Session Boxes:** Highlights New York, London, Tokyo, and Sydney sessions (Tehran timezone +3:30) with customizable background transparency and day-of-week labels.
- **Special Calculations:** Includes My ATR, ATI, SCEP, LQ Close, Min LQ, Max LQ, My CL, and Min Reward.
**How to Use:**
1. Add the indicator to your chart.
2. Customize table position, colors, decimal precision, and enable/disable sessions or pivots via settings.
3. Use ATR values for setting TP/SL levels and leverage pivots and session boxes to identify key market levels.
**Settings:**
- **Table Position & Style:** Adjust table placement and font size.
- **ATR Options:** Enable/disable specific timeframes or special calculations.
- **Sessions:** Toggle visibility of trading sessions and adjust transparency.
- **Pivots:** Enable/disable minor/major pivots and set bar counts.
- **Structure Lines:** Activate lines and customize color, width, and style.
**Ideal For**:Traders seeking a comprehensive tool for ATR analysis, pivot identification, and session-based trading across multiple timeframes.
**Note:** Tailor the settings to align with your trading strategy and market for optimal results.

Advanced Session Profile Predictor with SR Boxes & ORAdvanced Session Profile Predictor with Momentum Arrows
Designed for intraday traders, this indicator analyzes price action across Asia, London, and New York sessions to predict market profiles and highlight key trading opportunities. By combining session-based profiling, Opening Range (OR) visualization, and momentum signals from Traders Dynamic Index (TDI), it offers a unique tool for anticipating trends, reversals, and breakouts. Ideal for forex, indices, and crypto on 15M–1H charts.
What Makes This Indicator Unique?
Unlike typical session indicators that only mark time zones or standard TDI scripts that focus on momentum, this tool:
Predicts market profiles (e.g., "Trend Continuation," "NY Manipulation") by analyzing session ranges and directional moves, offering actionable insights into how sessions interact.
Visualizes Opening Range (OR) boxes for the first 15 minutes of each session, helping traders spot early breakout levels.
Integrates TDI with momentum to generate precise bullish/bearish arrows, filtered by session context for improved reliability.
Simplifies decision-making with dynamic profile labels showing real-time long/short conditions based on price levels.
How Does It Work?
Session Tracking:
Asia (00:00–08:00 UTC, yellow), London (08:00–16:00 UTC, red), and New York (13:00–21:00 UTC, blue) sessions are highlighted with background colors and high/low lines (crosses).
OR boxes (first 15 minutes) are drawn for each session: yellow for Asia, red for London, blue for NY.
Profile Prediction:
Compares Asia and London session ranges and directions (e.g., trending if range > 1.5x 5-period SMA).
Examples:
Trend Continuation: Asia and London trend in the same direction—long above Asia high (uptrend) or short below Asia low (downtrend).
NY Manipulation: Asia trends, London consolidates—watch for NY breakouts at London high/low.
Displays the predicted profile and entry conditions in labels (e.g., "IF price hits 1.2000 LONG").
Momentum Arrows:
Uses TDI (RSI period 21, bands 34, fast MA 2) and 12-period momentum.
Green up arrow: Fast MA > upper band (>68) and momentum rising (bullish).
Red down arrow: Fast MA < lower band (<32) and momentum falling (bearish).
Support/Resistance (SR):
Plots dynamic SR boxes based on pivot highs/lows, filtered by volume (inspired by ChartPrime’s methodology, credited below).
How to Use It
Setup: Apply to a 15M–1H chart. Adjust time zone (default: UTC) and session times if needed. Customize TDI/momentum settings for sensitivity.
Trading:
Check the top-right labels for the current profile and entry conditions (e.g., "IF price hits LONG/SHORT").
Confirm entries with green up arrows (bullish) or red down arrows (bearish).
Use OR boxes and session high/low lines to identify breakout or reversal levels.
Example: In "NY Manipulation," wait for price to hit London high (long) or low (short) during NY session, confirmed by an arrow.
Best Markets: Forex (EUR/USD), indices (SPX500), crypto (BTC/USD) with sufficient intraday volatility.
Underlying Concepts
Session Profiling: Detects trends (range > SMA * threshold) and manipulation (e.g., London breaking Asia’s high/low) to predict NY behavior.
OR Boxes: Marks the first 15 minutes’ high/low as a breakout zone (time-based, 900,000 ms).
TDI + Momentum: Combines RSI-based bands with price change (close – close ) for momentum signals.
SR Boxes: Identifies pivots over a lookback period (default 20), scaled by ATR and filtered by volume thresholds.
Credits
The SR box logic is inspired by ChartPrime’s volume-filtered support/resistance methodology, adapted with custom breakout/hold detection. Original authors are credited for their foundational work.
Chart Setup
Displays session backgrounds, OR boxes, high/low lines, TDI arrows, and profile labels. Keep other indicators off for clarity.

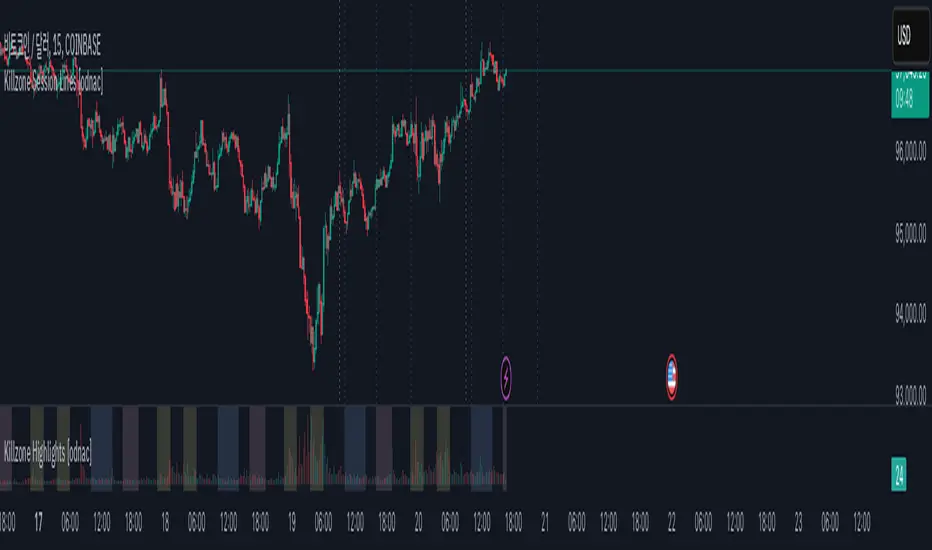
Killzone Session Lines [odnac]This Pine Script indicator displays vertical lines marking the start of key market sessions, known as Killzones, for both today and yesterday. These lines help traders identify important trading hours for the Asia, Europe, and New York sessions.
Killzone Vertical Lines:
Draws vertical lines for the start of the Asia, Europe, and New York sessions.
Displays lines for both today and the previous day to compare price action across sessions.
Customizable Time Settings:
Users can set the exact start hour and minute for each Killzone.
Time zones adjust automatically based on the chart's time zone.
Visual Customization:
Change the color, width, and style of the vertical lines (solid, dotted, dashed).
Toggle each session's lines individually for a cleaner chart.
Previous Start Lines:
Optional lines for the opening of today, the previous day, and the previous week, providing historical context for support and resistance levels.
Why Use This Indicator?
Session Awareness: Know exactly when major market sessions start to identify potential volatility spikes.
Historical Context: Compare today’s price action with previous sessions to spot recurring patterns.
Clean Charting: Automatic updates prevent clutter, keeping your workspace organized.
Flexible Customization: Tailor the display to fit your trading style and preferences.
New York Sessions Morning, Lunch and afternoon. AMKDescription
The script is designed to highlight the New York Stock Exchange's trading day, broken down into three specific sub-sessions: morning, lunchtime, and afternoon. Each sub-session is color-coded to provide an immediate visual cue about which portion of the trading day is currently active. Additionally, this script allows the user to adjust the time zone offset, making it adaptable for traders in different time zones around the world.
Originality
While there are scripts that highlight the entire trading day or specific market hours, this script adds granularity by breaking down the New York trading session into its typical behavioral parts: the morning rush, the lunchtime lull, and the afternoon action. The addition of an adjustable time zone offset is a unique feature that makes the tool more versatile and accommodating to a global user base.
Usefulness
The ability to visualize these different trading sessions can be valuable for various types of traders:
Day Traders: The script helps to immediately identify which session they are in, aiding in their trading strategy as market behavior can vary between these periods.
Swing Traders: They may use these sub-sessions to time their entries or exits, especially if they're based in different time zones.
Market Analysts: The color-coded sessions provide a quick way to analyze the historical performance and volatility of an asset during different trading periods.
Global Traders: The time zone adjustment feature makes it easy for traders outside of the Eastern Time Zone to customize the script according to their local time, increasing its utility across different markets.
Educational Purpose: For new traders, this could serve as an educational tool to understand the typical behavior of the stock market at different times of the day.
So, whether you're timing an intraday entry or looking for patterns tied to specific market sessions, this script offers a straightforward, visual way to keep track of where you are in the trading day.
Futures Exchange SessionsIn the 24-hour trading of the futures market, this indicator provides the user with full customization concerning the most important factor: time. This indicator is centered around three main visualizations: labels, backgrounds, and lines that minimalistically allows the user to keep track of the many time intervals that occur during a futures market 24-hour trading cycle. It also artfully displays the previous days highs and lows. And everything can be individually toggled and configured so the user can get exactly what they want.
Labels
There are three main futures market sessions in a 24-hour period: the London, New York, and Asian Sessions. Each session is given an independent label for the open and close times. The six labels (LO, LC, NYO, NYC, AO, AC) can be individually toggled on or off, the label background color changed, the text switched between black or white, and the height can be lowered or raised. These customizations are intended to give the user full control of the session they are interested in at the moment.
Backgrounds
Backgrounds are the heart of this indicator. There are different colored transparent backgrounds for each of the futures sessions. So the user can clearly see the session they want to highlight without cluttering their chart and getting in the way of analyzing the candles.
If you are familiar with the London and New York killzones, these backgrounds are each individually configured.
If you are familiar with the Inner Circle Trader’s (ICT) NY Morning and Afternoon sessions, these are available. Also, most times weird price action occurs during the lunch hour of these sessions. The London and New York have a background for their respective lunch hours so the user is never caught of guard during these periods.
Lines
The markets are constantly looking for liquidity. To help the user see runs on liquidity, this indicator projects the previous days highs and lows on to the current day with a line and a price label. The line make it very easy to see where price may be headed. See the image below for the perfect example of this phenomenon. Each of the lines can be independently controlled by color, style, and width. And even the labels can be toggled on or off if the user would prefer just to see the lines. Lastly, there is a line that marks the midnight open price in EST.
Special Notes
This indicator is specifically designed for futures tickers.
All of the backgrounds are not designed to be turned on a once (there are many that overlap). They are designed to give the user ultimate control over exactly what timeframe backgrounds to display on their charts.
The labels only appear when timeframe is 1 hour or less.

Volume by SessionThis indicator shows volume separated by session. The aim is clarify which session a volume bar occurred in and how it compares to the average of that session - NOT ALL SESSIONS.
The logic is that there is little value comparing for example the volume of the London session against volume of the London-NY session - the London-NY will always have higher volume. But how does today's london compare to yesterdays london or the london average.
The indicator has moving averages that only consider the average of previous episodes of the same session - so the average on the london session is the average of the past 5 london sessions (NY and asia and London-NY are not included in the calculation of the MA).
The indicator goes as high as 1H timeframe and the average line does not function below 5 mins - thats a limitation on available data to calculate it.
There's also a 'dark screen' function. Thats because I like a black background so the colours need to be inverted.
Hope its useful. Good luck.
John

New York | Asia | London - Session Range + ORB - [EntryLab]Session Ranges & 15min ORB – Asia, London, New YorkShort Title
This indicator plots the high and low of the three major trading sessions (Asia, London, New York) as well as the Opening Range Breakout (ORB) levels based on the first 15 minutes of each session.
Features: Full session high/low ranges for Asia (00:00–09:00 UTC), London (07:00–16:00 UTC), and New York (~13:30–20:00 UTC). Times are approximate UTC and may need adjustment depending on broker timezone or DST.
ORB: high and low calculated from the first 15-minute period (or equivalent bars) at the start of each session.
Customizable: toggle sessions on/off, change ORB duration, line styles, colors.
How to use:
Traders often monitor price action around prior session highs and lows to identify potential liquidity grabs or sweeps. The ORB provides additional confluence for gauging the session's potential directional bias or breakout levels.For example:A sweep of a prior session high/low can signal liquidity being taken.
Price breaking above/below the session's ORB high/low may indicate momentum in that direction for the current session.
This script combines multi-session range visualization with per-session ORB levels in one tool, which can help assess where liquidity pools may exist and where price could be drawn to fill or sweep certain areas.Best used on lower timeframes (e.g., 1m–15m) for intraday analysis. Session times are fixed (no automatic DST handling); users can modify them in the code if needed.Not financial advice. Trading involves significant risk of loss. Use at your own discretion and always test thoroughly.

AM/PM Session LevelsAM/PM Session Levels with Real-Time Updates
This indicator plots intraday high, low, and midpoint levels for the AM and PM trading sessions, with live-updating visuals designed for precision and clarity.
Features
AM Session: 9:30 AM to 10:00 AM EST
PM Session: 1:30 PM to 2:00 PM EST
Live High/Low Tracking: Lines begin at the exact candle where session highs or lows are formed and update dynamically.
Session Boxes: Visual boxes extend from session start to the most recent bar, adjusting in real time to reflect the current session range.
Midpoint Lines: The 50% level (CE) is calculated and displayed after each session ends.
Customization Options:
Line styles, widths, and colors for each session
Label texts
Box visibility, fill, and border styling
Intended Use
This tool is ideal for intraday traders looking to reference session-based levels for decision-making. It provides clear visual separation of session structure and helps identify key reaction areas throughout the trading day.
Developed by Ralvarez
Version 1.0 — December 2025

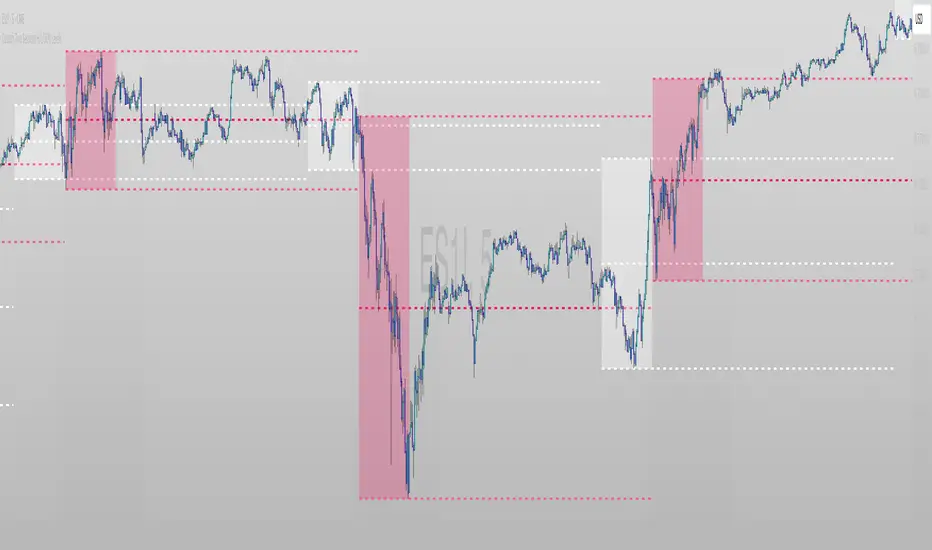
FX Session High/Low Bands - Last 5 EST Days
FX Session High/Low Bands - Last 5 Days
Description:
This indicator plots horizontal bands representing the high and low price levels from the major forex trading sessions over the last 5 days. It helps traders identify key support and resistance zones based on recent session activity.
Features:
Multiple Session Tracking: Displays high/low levels for major FX sessions:
Asian Session (Tokyo)
European Session (London)
US Session (New York)
5-Day Lookback: Captures the highest high and lowest low from each session over the previous 5 trading days
Visual Bands: Clear horizontal lines or filled zones showing session boundaries
Dynamic Updates: Automatically recalculates as new session data becomes available
How to Use:
Support/Resistance: Previous session highs/lows often act as key price levels
Breakout Trading: Watch for price breaking above/below session bands
Range Trading: Trade within the bands during consolidation periods
Session Overlap: Pay attention to multiple session bands converging
Ideal For:
Forex day traders
Session-based trading strategies
Support/resistance identification
Multi-timeframe analysis

Essa - Market Structure Crystal Ball SystemEssa - Market Structure Crystal Ball V2.0
Ever wished you had a glimpse into the market's next move? Stop guessing and start anticipating with the Market Structure Crystal Ball!
This isn't just another indicator that tells you what has happened. This is a comprehensive analysis tool that learns from historical price action to forecast the most probable future structure. It combines advanced pattern recognition with essential trading concepts to give you a unique analytical edge.
Key Features
The Predictive Engine (The Crystal Ball)
This is the core of the indicator. It doesn't just identify market structure; it predicts it.
Know the Odds: Get a real-time probability score (%) for the next structural point: Higher High (HH), Higher Low (HL), Lower Low (LL), or Lower High (LH).
Advanced Analysis: The engine considers the pattern sequence, the speed (velocity) of the move, and its size to find the most accurate historical matches.
Dynamic Learning: The indicator constantly updates its analysis as new price data comes in.
The All-in-One Dashboard
Your command center for at-a-glance information. No need to clutter your screen!
Market Phase: Instantly know if the market is in a "🚀 Strong Uptrend," "📉 Steady Downtrend," or "↔️ Consolidation."
Live Probabilities: See the updated forecasts for HH, HL, LL, and LH in a clean, easy-to-read format.
Confidence Level: The dashboard tells you how confident the algorithm is in its current prediction (Low, Medium, or High).
🎯 Dynamic Prediction Zones
Turn probabilities into actionable price areas.
Visual Targets: Based on the highest probability outcome, the indicator draws a target zone on your chart where the next structure point is likely to form.
Context-Aware: These zones are calculated using recent volatility and average swing sizes, making them adaptive to the current market conditions.
🔍 Fair Value Gap (FVG) Detector
Automatically identify and track key price imbalances.
Price Magnets: FVGs are automatically detected and drawn, acting as potential targets for price.
Smart Tracking: The indicator tracks the status of each FVG (Fresh, Partially Filled, or Filled) and uses this data to refine its predictions.
🌍 Trading Session Analysis
Never lose track of key session levels again.
Visualize Sessions: See the Asia, London, and New York sessions highlighted with colored backgrounds.
Key Levels: Automatically plots the high and low of each session, which are often critical support and resistance levels.
Breakout Alerts: Get notified when price breaks a session high or low.
📈 Multi-Timeframe (MTF) Context
Understand the bigger picture by integrating higher timeframe analysis directly onto your chart.
BOS & MSS: Automatically identifies Breaks of Structure (trend continuation) and Market Structure Shifts (potential reversals) from up to two higher timeframes.
Trade with the Trend: Align your intraday trades with the dominant trend for higher probability setups.
⚙️ How It Works in Simple Terms
1️⃣ It Learns: The indicator first identifies all the past swing points (HH, HL, LL, LH) and analyzes their characteristics (speed, size, etc.).
2️⃣ It Finds a Match: It looks at the most recent price action and searches through hundreds of historical bars to find moments that were almost identical.
3️⃣ It Analyzes the Outcome: It checks what happened next in those similar historical scenarios.
4️⃣ It Predicts: Based on that historical data, it calculates the probability of each potential outcome and presents it to you.
🚀 How to Use This Indicator in Your Trading
Confirmation Tool: Use a high probability score (e.g., >60% for a HH) to confirm your own bullish analysis before entering a trade.
Finding High-Probability Zones: Use the Prediction Zones as potential areas to take profit, or as reversal zones to watch for entries in the opposite direction.
Gauging Market Sentiment: Check the "Market Phase" on the dashboard. Avoid forcing trades when the indicator shows "😴 Low Volatility."
Confluence is Key: This indicator is incredibly powerful when combined with your existing strategy. Use it alongside supply/demand zones, moving averages, or RSI for ultimate confirmation.
We hope this tool gives you a powerful new perspective on the market. Dive into the settings to customize it to your liking!
If you find this indicator helpful, please give it a Boost 👍 and leave a comment with your feedback below! Happy trading!
Disclaimer: All predictions are probabilistic and based on historical data. Past performance is not indicative of future results. Always use proper risk management.

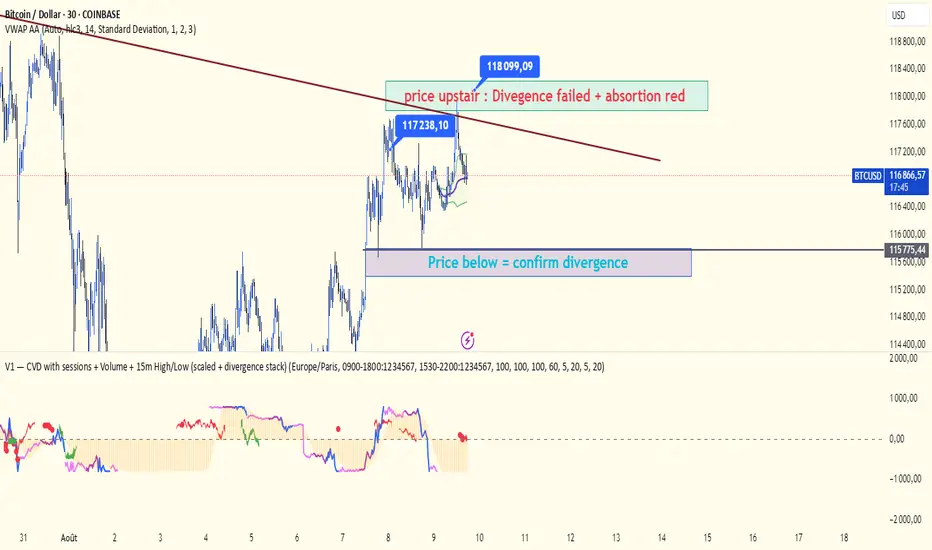
V1 — CVD with sessions scaled + divergence stackCVD with session: the three different session colors (fuchsia, purple, and blue).
There are two areas — green and red — which represent divergences with the price.
Be careful: both divergence and confirmation require a valid structure change.
The bubble is a visual aid to help validate or reject the divergence.
A bubble is calculated based on the previous session. You can adjust the volatility using lookbackCloseLL and lookbackHighBR.