EAOBS by MIGVersion 1
1. Strategy Overview Objective: Capitalize on breakout movements in Ethereum (ETH) price after the Asian open pre-market session (7:00 PM–7:59 PM EST) by identifying high and low prices during the session and trading breakouts above the high or below the low.
Timeframe: Any (script is timeframe-agnostic, but align with session timing).
Session: Pre-market session (7:00 PM–7:59 PM EST, adjustable for other time zones, e.g., 12:00 AM–12:59 AM GMT).
Risk-Reward Ratios (R:R): Targets range from 1.2:1 to 5.2:1, with a fixed stop loss.
Instrument: Ethereum (ETH/USD or ETH-based pairs).
2. Market Setup Session Monitoring: Monitor ETH price action during the pre-market session (7:00 PM–7:59 PM EST), which aligns with the Asian market open (e.g., 9:00 AM–9:59 AM JST).
The script tracks the highest high and lowest low during this session.
Breakout Triggers: Buy Signal: Price breaks above the session’s high after the session ends (7:59 PM EST).
Sell Signal: Price breaks below the session’s low after the session ends.
Visualization: The session is highlighted on the chart with a white background.
Horizontal lines are drawn at the session’s high and low, extended for 30 bars, along with take-profit (TP) and stop-loss (SL) levels.
3. Entry Rules Long (Buy) Entry: Enter a long position when the price breaks above the session’s high price after 7:59 PM EST.
Entry price: Just above the session high (e.g., add a small buffer, like 0.1–0.5%, to avoid false breakouts, depending on volatility).
Short (Sell) Entry: Enter a short position when the price breaks below the session’s low price after 7:59 PM EST.
Entry price: Just below the session low (e.g., subtract a small buffer, like 0.1–0.5%).
Confirmation: Use a candlestick close above/below the breakout level to confirm the entry.
Optionally, add volume confirmation or a momentum indicator (e.g., RSI or MACD) to filter out weak breakouts.
Position Size: Calculate position size based on risk tolerance (e.g., 1–2% of account per trade).
Risk is determined by the stop-loss distance (10 points, as defined in the script).
4. Exit Rules Take-Profit Levels (in points, based on script inputs):TP1: 12 points (1.2:1 R:R).
TP2: 22 points (2.2:1 R:R).
TP3: 32 points (3.2:1 R:R).
TP4: 42 points (4.2:1 R:R).
TP5: 52 points (5.2:1 R:R).
Example for Long: If session high is 3000, TP levels are 3012, 3022, 3032, 3042, 3052.
Example for Short: If session low is 2950, TP levels are 2938, 2928, 2918, 2908, 2898.
Strategy: Scale out of the position (e.g., close 20% at TP1, 20% at TP2, etc.) or take full profit at a preferred TP level based on market conditions.
Stop-Loss: Fixed at 10 points from the entry.
Long SL: Session high - 10 points (e.g., entry at 3000, SL at 2990).
Short SL: Session low + 10 points (e.g., entry at 2950, SL at 2960).
Trailing Stop (Optional):After reaching TP2 or TP3, consider trailing the stop to lock in profits (e.g., trail by 10–15 points below the current price).
5. Risk Management per Trade: Limit risk to 1–2% of your trading account per trade.
Calculate position size: Account Size × Risk % ÷ (Stop-Loss Distance × ETH Price per Point).
Example: $10,000 account, 1% risk = $100. If SL = 10 points and 1 point = $1, position size = $100 ÷ 10 = 0.1 ETH.
Daily Risk Limit: Cap daily losses at 3–5% of the account to avoid overtrading.
Maximum Exposure: Avoid taking both long and short positions simultaneously unless using separate accounts or strategies.
Volatility Consideration: Adjust position size during high-volatility periods (e.g., major news events like Ethereum upgrades or macroeconomic announcements).
6. Trade Management Monitoring :Watch for breakouts after 7:59 PM EST.
Monitor price action near TP and SL levels using alerts or manual checks.
Trade Duration: Breakout lines extend for 30 bars (script parameter). Close trades if no TP or SL is hit within this period, or reassess based on market conditions.
Adjustments: If the market shows strong momentum, consider holding beyond TP5 with a trailing stop.
If the breakout fails (e.g., price reverses before TP1), exit early to minimize losses.
7. Additional Considerations Market Conditions: The 7:00 PM–7:59 PM EST session aligns with the Asian market open (e.g., Tokyo Stock Exchange open at 9:00 AM JST), which may introduce higher volatility due to Asian trading activity.
Avoid trading during low-liquidity periods or extreme volatility (e.g., major crypto news).
Check for upcoming events (e.g., Ethereum network upgrades, ETF decisions) that could impact price.
Backtesting: Test the strategy on historical ETH data using the session high/low breakouts for the 7:00 PM–7:59 PM EST window to validate performance.
Adjust TP/SL levels based on backtest results if needed.
Broker and Fees: Use a low-fee crypto exchange (e.g., Binance, Kraken, Coinbase Pro) to maximize R:R.
Account for trading fees and slippage in your position sizing.
Time zone Adjustment: Adjust session time input for your time zone (e.g., "0000-0059" for GMT).
Ensure your trading platform’s clock aligns with the script’s time zone (default: America/New_York).
8. Example Trade Scenario: Session (7:00 PM–7:59 PM EST) records a high of 3050 and a low of 3000.
Long Trade: Entry: Price breaks above 3050 (e.g., enter at 3051).
TP Levels: 3063 (TP1), 3073 (TP2), 3083 (TP3), 3093 (TP4), 3103 (TP5).
SL: 3040 (3050 - 10).
Position Size: For a $10,000 account, 1% risk = $100. SL = 11 points ($11). Size = $100 ÷ 11 = ~0.09 ETH.
Short Trade: Entry: Price breaks below 3000 (e.g., enter at 2999).
TP Levels: 2987 (TP1), 2977 (TP2), 2967 (TP3), 2957 (TP4), 2947 (TP5).
SL: 3010 (3000 + 10).
Position Size: Same as above, ~0.09 ETH.
Execution: Set alerts for breakouts, enter with limit orders, and monitor TPs/SL.
9. Tools and Setup Platform: Use TradingView to implement the Pine Script and visualize breakout levels.
Alerts: Set price alerts for breakouts above the session high or below the session low after 7:59 PM EST.
Set alerts for TP and SL levels.
Chart Settings: Use a 1-minute or 5-minute chart for precise session tracking.
Overlay the script to see high/low lines, TP levels, and SL levels.
Optional Indicators: Add RSI (e.g., avoid overbought/oversold breakouts) or volume to confirm breakouts.
10. Risk Warnings Crypto Volatility: ETH is highly volatile; unexpected news can cause rapid price swings.
False Breakouts: Breakouts may fail, especially in low-volume sessions. Use confirmation signals.
Leverage: Avoid high leverage (e.g., >5x) to prevent liquidation during volatile moves.
Session Accuracy: Ensure correct session timing for your time zone to avoid misaligned entries.
11. Performance Tracking Journaling :Record each trade’s entry, exit, R:R, and outcome.
Note market conditions (e.g., trending, ranging, news-driven).
Review: Weekly: Assess win rate, average R:R, and adherence to the plan.
Monthly: Adjust TP/SL or session timing based on performance.
Cari dalam skrip untuk "session"

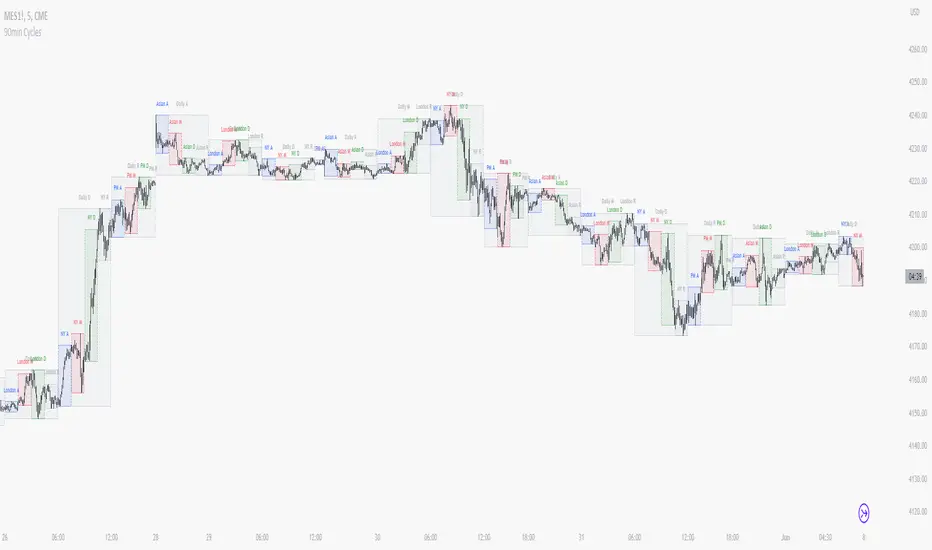
90 Minute Cycles + MTFCredit goes to LuxAlgo for the inspiration from 'Sessions' which allowed users to analyse specific price movements within a user defined period with tools such as trendline, mean and vwap.
Settings
Sessions
Enable Session: Allows to enable or disable all associated elements with a specific user set session.
Session Time: Opening and closing times of the user set session in the hh:mm format.
Range: Highlights the associated session range on the chart.
Ranges Settings
Range Area colour: Set each range to a specific colour.
Range Label: Shows the session label at the mid-point of the session interval.
Usage
By breaking 24hrs in quarters, starting with an Asian range of 18:00 NY time you can visualise the principles of Accumulation, Manipulation, Distribution and Rebalance. Know as AMD or PO3 (Power of Three), the principle is that the Manipulation phase will break above or below the Accumulation, before moving in an apposing direction and then rebalancing. This only works when there is a higher timeframe PD array or liquidity to support an apposing move.
Further to the daily quarters, each one can then be broken down again into 90min cycles. Again, each represents AMD, allowing the user an opportunity to watch for reversals during the 90min manipulation phase.
Note: Ensure the Asian Cycle always begins at 18:00 NY time.
The example shows that the 90min cycle occurs, followed by an apposing move away in price action
Here is the Daily cycle, highlighting the Manipulation phase.
Enjoy!
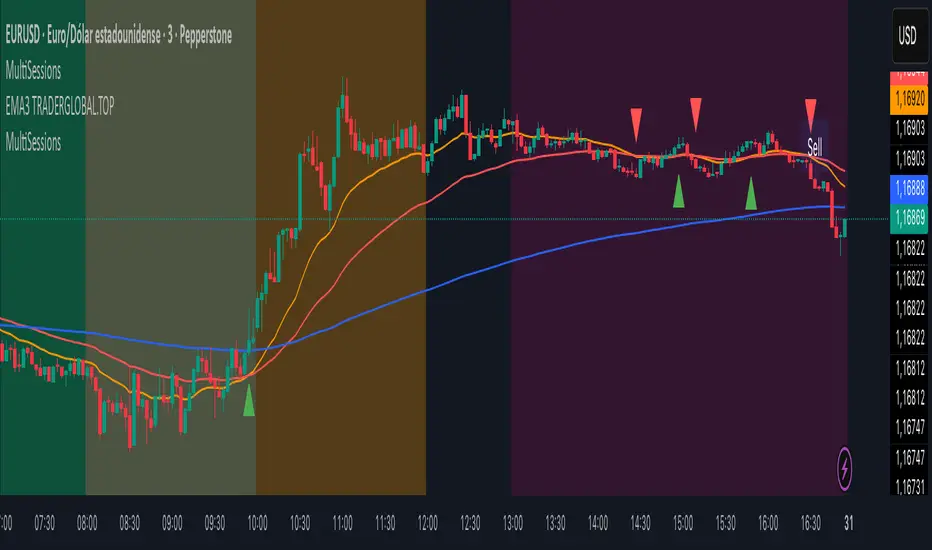
MultiSessions traderglobal.topEste indicador de sesiones está diseñado para traders intradía que desean visualizar con precisión la actividad y la volatilidad característica de cada mercado. Basado en Pine Script v5 y optimizado para la zona horaria “America/New_York”, divide el día en sub-sesiones configurables y resalta sus rangos de precio en tiempo real. En particular, incorpora tres bloques para New York (NY1, NY2, NY3), dos para Londres (LON1, LON2), dos para Tokio (TKO1, TKO2) y mantiene Sídney como sesión opcional. Cada bloque puede activarse o desactivarse de forma independiente y cuenta con su propio color ajustable, lo que permite construir mapas visuales claros para estrategias basadas en horario, solapamientos y micro-estructuras de mercado.
El panel de inputs incluye la opción “Activate High/Low View”. Cuando está activada, el indicador calcula de manera incremental el mínimo y máximo de cada sub-sesión y sombrea el área entre ambos con fill, proporcionando una referencia inmediata del rango intrasesión (útil para medir compresión/expansión y posibles rompimientos). Cuando está desactivada, emplea un simple bgcolor por bloque, ideal para traders que prefieren un gráfico más limpio y solo desean distinguir visualmente los tramos horarios.
La lógica central utiliza dos funciones auxiliares: is_session(sess), que detecta si la vela actual pertenece a un tramo horario concreto, e is_newbar(sess), que determina el inicio de una nueva barra de referencia según la resolución elegida (D, W o M). Gracias a esta combinación, en cada sub-sesión el indicador reinicia sus contadores de alto y bajo al comenzar el período y los actualiza vela a vela mientras el bloque siga activo. Este enfoque evita mezclas de datos entre sesiones y asegura que el rango que se muestra corresponda estrictamente al segmento horario configurado.
Los horarios por defecto están pensados para Forex y contemplan casos que cruzan medianoche (por ejemplo, Tokio 2 y Sídney). Pine Script admite rangos como 2200-0200; no obstante, si tu bróker o la zona horaria del gráfico generan un sombreado parcial, basta con dividir el tramo en dos: 2200-2359 y 0000-0200. Asimismo, cada input.session incluye el patrón :1234567 para habilitar los siete días; puedes restringir días según tu operativa.
En cuanto al uso práctico, el indicador facilita identificar: (1) la estructura del rango por sub-sesión (útil para estrategias de breakout/mean-reversion), (2) los solapamientos entre Londres y New York, donde suele concentrarse la liquidez, y (3) períodos de menor volatilidad (tramos tardíos de Asia o previos a noticias). El color independiente por bloque te permite codificar visualmente la importancia o tu plan de trading (por ejemplo, tonos más intensos en ventanas de alta probabilidad).
Finalmente, su diseño modular hace sencilla la personalización: puedes ajustar colores, activar/desactivar bloques, cambiar horarios y modificar la resolución de reseteo del rango. Como posible mejora, se pueden añadir alertas de ruptura de máximos/mínimos de sub-sesión o etiquetas con la altura del rango (pips) al cierre. Este indicador no sustituye el juicio del trader ni constituye recomendación financiera, pero ofrece una base visual robusta para integrar el factor tiempo en la toma de decisiones.
This sessions indicator is built for intraday traders who want a precise, time-aware view of market activity and typical volatility patterns across the day. Written in Pine Script v5 and optimized for the “America/New_York” timezone, it divides the trading day into configurable sub-sessions and highlights their price ranges in real time. Specifically, it provides three blocks for New York (NY1, NY2, NY3), two for London (LON1, LON2), two for Tokyo (TKO1, TKO2), and keeps Sydney as an optional session. Each block can be enabled or disabled independently and comes with its own adjustable color, letting you build clear visual maps for time-based strategies, overlaps, and microstructure nuances.
In the inputs panel you’ll find the “Activate High/Low View” option. When enabled, the indicator incrementally computes each sub-session’s low and high and shades the area between them with fill, giving you an immediate reference to the intra-session range (useful for gauging compression/expansion and potential breakouts). When disabled, it switches to a clean bgcolor background by block—ideal if you prefer a minimal chart and simply want to distinguish time windows at a glance.
The core logic relies on two helper functions: is_session(sess), which detects whether the current bar falls within a given time window, and is_newbar(sess), which identifies the start of a new reference bar according to your chosen reset resolution (D, W, or M). With this combination, each sub-session resets its high/low at the beginning of the period and updates them bar by bar while the block remains active. This prevents cross-contamination between sessions and ensures the range you see belongs strictly to the configured segment.
Default hours are suited to Forex and include segments that cross midnight (e.g., Tokyo 2 and Sydney). Pine Script supports ranges like 2200-0200; however, if your broker or chart timezone causes partial shading, simply split the segment into two: 2200-2359 and 0000-0200. Each input.session uses the :1234567 suffix to enable all seven days; you can easily restrict days to match your plan.
Practically speaking, the indicator helps you identify: (1) range structure by sub-session (great for breakout or mean-reversion frameworks), (2) overlaps between London and New York, where liquidity and directional moves often concentrate, and (3) lower-volatility windows (late Asia or pre-news lulls). Independent colors per block let you visually encode priority or your trading plan (for example, richer tones in high-probability windows).
Thanks to its modular design, customization is straightforward: adjust colors, toggle blocks, change hours, and tweak the range-reset resolution to suit your routine. As a natural extension, you can add alerts for sub-session high/low breakouts or labels that display the range height (in pips) at session close. While no indicator replaces trader judgment or constitutes financial advice, this tool offers a robust visual foundation for incorporating the time factor directly into your decision-making, helping you contextualize price action within the rhythm of global trading sessions.
Intraday vs Overnight OBV🔍 Purpose
This indicator provides a volume-weighted cumulative flow model that mimics On-Balance Volume (OBV) logic but splits the volume impact into intraday vs. overnight sessions. It allows traders to track how volume contributes to price movement in each session and identify whether buying/selling pressure is stronger during or outside of regular trading hours.
This indicator attempts to alleviate some of the downfalls of the standard OBV indicator, which only looks at total volume and total direction. The price of stocks generally behaves extremely differently during market hours and outside market hours, and many of the large moves happen outside of regular market hours on low volume.
⚙️ Core Features
1) OBV-style calculation:
If price increases → volume is added to the OBV stream.
If price decreases → volume is subtracted.
If price is flat → OBV remains unchanged.
2) Session splitting:
Intraday session: movement from today's open to close.
Overnight session: movement from yesterday’s close to today’s open.
Volume is split proportionally between these two periods based on user input.
3) Four visualization modes:
"Intraday" — plots only OBV from intraday price movement.
"Overnight" — plots only OBV from overnight price movement.
"Aggregate" — plots the sum of intraday and overnight OBV for a holistic view.
"Both Intraday and Overnight" — plots intraday and overnight OBV separately on the same chart.
📐 Inputs
1) Synthetic OBV Type:
"Intraday" — Show OBV from open to close only.
"Overnight" — Show OBV from prior close to today's open only.
"Aggregate" — Show a single line combining both.
"Both Intraday and Overnight" — Show both lines on the same chart.
2) Estimated Overnight Volume %:
Percentage of total daily volume assumed to occur during extended hours.
The rest is allocated to regular session (intraday).
Default: 20% overnight, 80% intraday.
🧮 How It Works
Volume Splitting:
Total bar volume is split into overnight Volume and intraday Volume:
Intraday change is the difference between today’s close and open.
Overnight change is the difference between today’s open and yesterday’s close.
Session OBV Calculations:
OBV is incremented/decremented by the session's allocated volume, depending on whether the session’s price change was positive or negative.
Aggregate OBV:
Combines both session deltas for a holistic volume flow view.
📊 Interpretation
Rising OBV (any stream) suggests accumulation; falling OBV suggests distribution.
Divergences between price and OBV lines (especially overnight vs. intraday) can reveal where hidden buying/selling is occurring.
Comparing intraday vs overnight OBV can help:
Spot whether institutional demand is building off-hours.
Detect retail vs. institutional behavior (retail trades often dominate intraday; institutional may prefer after-hours).
💡 Use Cases
Identify whether overnight gaps are supported by overnight volume momentum.
Detect accumulation in low-volume overnight sessions.
Compare intraday and overnight strength during earnings season or news events.
Complement traditional OBV by seeing session-based breakdowns.

OpeningRange (Trading_Tix)Purpose:
The indicator highlights the high, low, and middle (50%) price levels of a specified session's opening range. These levels can serve as key support and resistance zones for trading strategies. The indicator also offers options to extend these levels beyond the session into later timeframes, making it useful for tracking breakout or trend continuation setups.
Key Features:
1. Session Detection:
The indicator identifies a specific session period using the user-defined Session Time. It calculates the start time, high, and low prices during this period:
rangeTime: Defines the session time range (default: 5:00 PM to 2:59 AM).
extendTime: Defines the extended time range where lines/backgrounds can be prolonged.
2. Opening Range Calculation:
High (high_val) and Low (low_val)**:
Tracks the highest and lowest prices during the session.
Middle Line:
A midpoint is calculated by averaging high_val and low_val.
3. Visual Elements:
Horizontal Lines:
Drawn at the high, low, and middle levels.
Customizable in width and color.
Shaded Background Box:
Covers the range between high and low prices.
The box’s color and transparency can be adjusted.
Line and Box Extension:
Optionally extends these elements into the extended time range.
4. Customization:
Users have the flexibility to:
Toggle visibility of lines, middle line, and background box.
Adjust colors, line thickness, and style.
Enable or disable the extension of lines and backgrounds into the extended period.
How It Works:
Initialization:
The script initializes variables to store range data (startTime, high_val, low_val) and drawing objects (lines, boxes).
It detects whether the current bar falls within the session (inSession) or extended timeframe (inExtend).
Plotting:
During the session:
Deletes previous lines and boxes from prior sessions.
Draws new lines at the high, low, and middle levels.
Creates a background box covering the range, if enabled.
During the extended period:
Extends the session lines and box, if the user has opted for extensions.
Updates:
Continuously adjusts the high/low values and updates the lines as new price data arrives.
Use Cases:
This indicator can be valuable for traders who:
Use the opening range to identify potential breakout zones.
Trade based on price consolidation within the range.
Want a visual representation of key price levels to plan entries and exits.
Would you like help refining this script further or adjusting its settings to match your trading style?

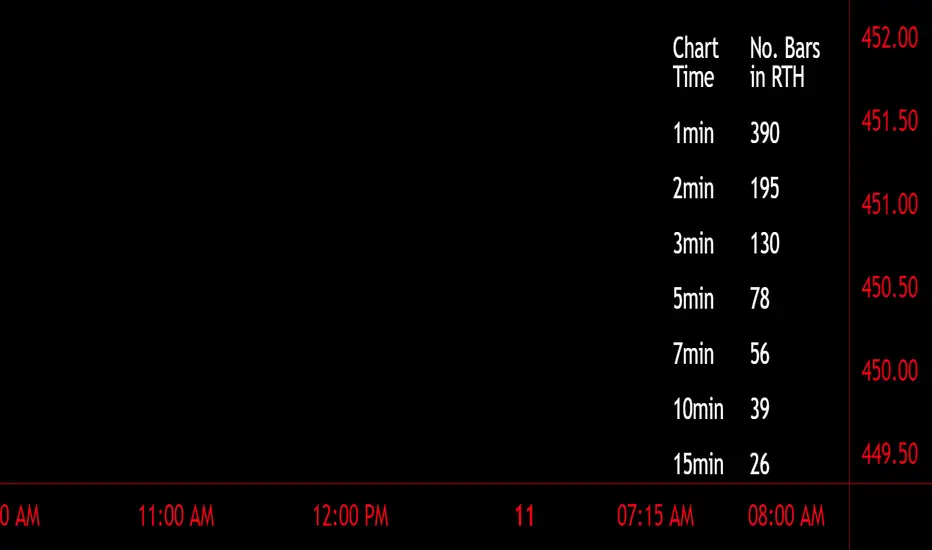
Number of Bars CheatSheetA regular trading day on the New York Stock Exchange (NYSE) consists of two main sessions: the Opening Auction and the Closing Auction, separated by a continuous trading session. Here's a breakdown of the trading day:
1. **Pre-Opening Session**: This session starts at 4:00 AM Eastern Time (ET) and lasts until 9:30 AM ET. During this time, there is limited trading activity, and orders can be entered and canceled. However, most of the trading activity doesn't occur until the regular trading session begins.
2. **Regular Trading Session**: The regular trading session on the NYSE starts at 9:30 AM ET and lasts until 4:00 PM ET. This is the primary trading session where the majority of price bars are formed.
3. **Closing Auction**: After the regular trading session ends at 4:00 PM ET, there is a closing auction period that typically lasts until 4:10 PM ET. During this time, there is a final price discovery process where orders are matched to determine the closing price for each security.
So, during the regular trading session, which is the main focus for most traders and investors, there are a total of 6.5 hours of trading. Trading occurs continuously during this time, with price bars being formed based on the time frame you're looking at. The most common time frames for price bars are one minute, five minutes, 15 minutes, 30 minutes, and one hour, among others. Therefore, the number of price bars in a regular trading day on the NYSE will depend on the time frame you are using for your analysis. For example, if you are using one-minute bars, there will be 6.5 x 60 = 390 price bars in a regular trading day.
True Open CalculationsIndicator Description: True Open Calculations
This custom Pine Script indicator calculates and plots key "True Open" levels based on specific time intervals and trading sessions. The True Open levels represent significant price points on the chart, helping traders identify key reference points tied to various market opening times. These levels are important for understanding price action in relation to market sessions and trading cycles. The indicator is designed to plot lines corresponding to different "True Opens" on the chart and display labels with the associated information.
Key Features:
True Year Open:
This represents the opening price on the first Monday of April each year. It serves as a reference point for the yearly price level.
Plot Color: Green.
True Month Open:
This represents the opening price on the second Monday of each month. It helps in identifying monthly trends and provides a key reference for monthly price movements.
Plot Color: Blue.
True Week Open:
This represents the opening price every Monday at 6:00 PM. It gives traders a level to track weekly opening movements and can be useful for weekly trend analysis.
Plot Color: Orange.
True Day Open:
This represents the opening price at 12:00 AM (midnight) each day. It serves as a daily benchmark for price action at the start of the trading day.
Plot Color: Red.
True New York Session Open:
This represents the opening price at 7:30 AM (New York session start time). This level is crucial for traders focused on the New York trading session.
Plot Color: Purple.
Additional Features:
Labels: The indicator displays labels to the right of each plotted line to describe which "True Open" it represents (e.g., "True Year Open," "True Month Open," etc.).
Dynamic Plotting: The lines are only plotted on the current candle, and the lines are dynamically updated for each time period based on the corresponding "True Open."
Visual Cues: The colors of the plotted lines (green, blue, orange, red, purple) help quickly distinguish between different "True Open" levels, making it easy for traders to track price action and make informed decisions.
Use Cases:
Yearly, Monthly, Weekly, Daily, and Session Benchmarking: This indicator provides traders with important price levels to use as benchmarks for the current year, month, week, and day, helping to identify trends and potential reversals.
Session Awareness: It is particularly useful for traders who want to track key market sessions, such as the New York session, and their impact on price movement.
Long-term Analysis: By including the yearly open, this indicator helps traders gain a broader perspective on market trends and provides context for analyzing shorter-term price movements.
Benefits:
Helps identify important reference points for longer-term trends (yearly, monthly) as well as shorter-term moves (daily, weekly, and session).
Visually intuitive with color-coded lines and labels, allowing quick and easy identification of key market open levels.
Dynamic and real-time: The indicator plots and updates the True Open levels dynamically as the market progresses.

DCSessionStatsOHLC_v1.0DCSessionStatsOHLC_v1.0
© dc_77 | Pine Script™ v6 | Licensed under Mozilla Public License 2.0
This indicator overlays customizable session-based OHLC (Open, High, Low, Close) statistics on your TradingView chart. It tracks price action within user-defined sessions, calculates average manipulation and distribution levels based on historical data, and visually projects these levels with lines and labels. Additionally, it provides a session count table to monitor bullish and bearish sessions.
Key Features:
Session Customization: Define session time (e.g., "0000-1600") and time zone (e.g., UTC, America/New_York). Analyze up to 20 historical sessions.
Anchor Line: Displays a vertical line at session start with customizable style, color, and optional label.
Session Open Line: Plots a horizontal line at the session’s opening price with adjustable appearance and label.
Manipulation Levels: Calculates and projects average price extensions (high/low relative to open) for manipulative moves, shown as horizontal lines with labels.
Distribution Levels: Displays average price ranges (high/low beyond open) for distribution phases, with customizable lines and labels.
Visual Flexibility: Adjust line styles (solid, dashed, dotted), colors, widths, label sizes, and projection offsets (bars beyond session start).
Session Stats Table: Optional table showing counts of bullish (close > open) and bearish (close < open) sessions, with configurable position and size.
How It Works:
Tracks OHLC data within each session and identifies session start/end based on the specified time range.
Computes averages for manipulation (e.g., low below open in bullish sessions) and distribution (e.g., high above open) levels from past sessions.
Projects these levels forward as horizontal lines, extending them by a user-defined offset for easy reference.
Updates a table with real-time bullish/bearish session counts.
Use Case:
Ideal for traders analyzing intraday or custom session behavior, identifying key price levels, and gauging market sentiment over time.
Toggle individual elements on/off and fine-tune visuals to suit your trading style.

ICT Macro Slot Algo Event📊 Overview
A powerful multi-timeframe trading indicator that combines Institutional Macro Session Tracking identify optimal trading windows throughout the day. This tool helps traders align with institutional flow patterns and algorithmic activity across major sessions.
🎯 Key Features
1. Macro Algo Event Sessions
Tracks 6 key institutional time windows during NY Session:
NY Sweep (08:50-09:10) - Opening balance flows
Silver Bullet #1 (09:50-10:10) - First major macro move
Silver Bullet #2 (10:50-11:10) - Second chance/retest opportunity
Lunch Macro (11:50-12:10) - Mid-day repositioning
Post-Lunch Rebalance (13:10-13:40) - Post-lunch adjustments
NY Closing Macros (15:15-15:45) - End-of-day flows

ICT Macro Slot Algo Event📊 Overview
A powerful multi-timeframe trading indicator that combines Institutional Macro Session Tracking to identify optimal trading windows throughout the day. This tool helps traders align with institutional flow patterns and algorithmic activity across major sessions.
🎯 Key Features
1. Macro Algo Event Sessions
Tracks 6 key institutional time windows during NY Session:
NY Sweep (08:50-09:10) - Opening balance flows
Silver Bullet #1 (09:50-10:10) - First major macro move
Silver Bullet #2 (10:50-11:10) - Second chance/retest opportunity
Lunch Macro (11:50-12:10) - Mid-day repositioning
Post-Lunch Rebalance (13:10-13:40) - Post-lunch adjustments
NY Closing Macros (15:15-15:45) - End-of-day flows

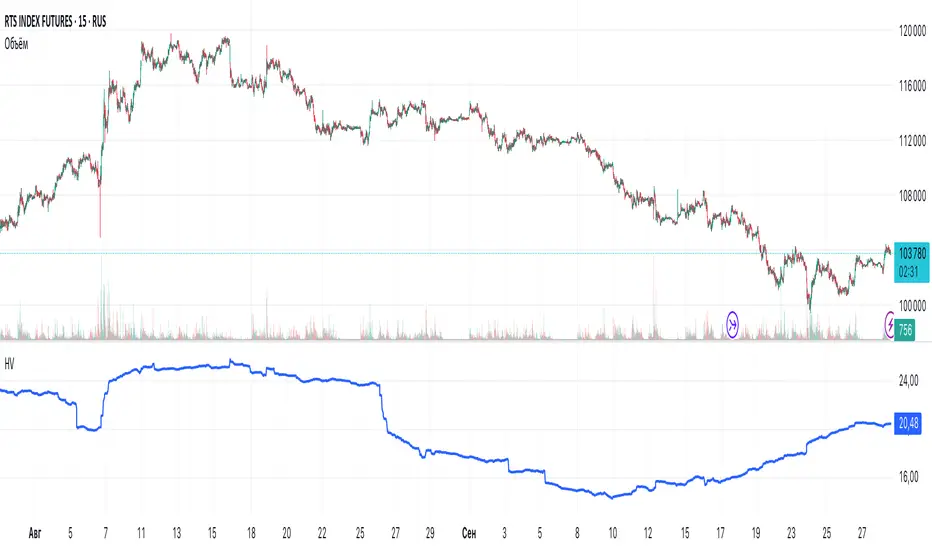
Historical VolatilityHistorical Volatility Indicator with Custom Trading Sessions
Overview
This indicator calculates **annualized Historical Volatility (HV)** using logarithmic returns and standard deviation. Unlike standard HV indicators, this version allows you to **customize trading sessions and holidays** for different markets, ensuring accurate volatility calculations for options pricing and risk management.
Key Features
✅ Custom Trading Sessions - Define multiple trading sessions per day with precise start/end times
✅ Multiple Markets Support - Pre-configured for US, Russian, European, and crypto markets
✅ Clearing Periods Handling - Account for intraday clearing breaks
✅ Flexible Calendar - Set trading days per year for different countries
✅ All Timeframes - Works correctly on intraday, daily, weekly, and monthly charts
✅ Info Table - Optional display showing calculation parameters
How It Works
The indicator uses the classical volatility formula:
σ_annual = σ_period × √(periods per year)
Where:
- σ_period = Standard deviation of logarithmic returns over the specified period
- Periods per year = Calculated based on actual trading time (not calendar time)
Calculation Method
1. Computes log returns: ln(close / close )
2. Calculates standard deviation over the lookback period
3. Annualizes using the square root rule with accurate period count
4. Displays as percentage
Settings
Calculation
- Period (default: 10) - Lookback period for volatility calculation
Trading Schedule
- Trading Days Per Year (default: 252) - Number of actual trading days
- USA: 252
- Russia: 247-250
- Europe: 250-253
- Crypto (24/7): 365
- Trading Sessions - Define trading hours in format: `hh:mm:ss-hh:mm:ss, hh:mm:ss-hh:mm:ss`
Display
- Show Info Table - Shows calculation parameters in real-time
Market Presets
United States (NYSE/NASDAQ)
Trading Sessions: 09:30:00-16:00:00
Trading Days Per Year: 252
Trading Minutes Per Day: 390
Russia (MOEX)
Trading Sessions: 10:00:00-14:00:00, 14:05:00-18:40:00
Trading Days Per Year: 248
Trading Minutes Per Day: 515
Europe (LSE)
Trading Sessions: 08:00:00-16:30:00
Trading Days Per Year: 252
Trading Minutes Per Day: 510
Germany (XETRA)
Trading Sessions: 09:00:00-17:30:00
Trading Days Per Year: 252
Trading Minutes Per Day: 510
Cryptocurrency (24/7)
Trading Sessions: 00:00:00-23:59:59
Trading Days Per Year: 365
Trading Minutes Per Day: 1440
Use Cases
Options Trading
- Compare HV vs IV - Historical volatility compared to implied volatility helps identify mispriced options
- Volatility mean reversion - Identify when volatility is unusually high or low
- Straddle/strangle selection - Choose optimal strikes based on historical movement
Risk Management
- Position sizing - Adjust position size based on current volatility
- Stop-loss placement - Set stops based on expected price movement
- Portfolio volatility - Monitor individual asset volatility contribution
Market Analysis
- Regime identification - Detect transitions between low and high volatility environments
- Cross-market comparison - Compare volatility across different assets and markets
Why Accurate Trading Hours Matter
Standard HV indicators assume 24-hour trading or use simplified day counts, leading to significant errors in annualized volatility:
- 5-minute chart error : Can be off by 50%+ if using wrong period count
- Options pricing impact : Even 2-3% HV error affects option values substantially
- Intraday vs overnight : Correctly excludes non-trading periods
This indicator ensures your HV calculations match the methodology used in professional options pricing models.
Technical Notes
- Uses actual trading minutes, not calendar days
- Handles multiple clearing periods within a single trading day
- Properly scales volatility across all timeframes
- Logarithmic returns for more accurate volatility measurement
- Compatible with Pine Script v6
Author Notes: This indicator was designed specifically for options traders who need precise volatility measurements across different global markets. The customizable trading sessions ensure your HV calculations align with actual market hours and industry-standard options pricing models.
Opening Range BoxThis indicator, called the "Opening Range Box," is a visual tool that helps you track the start of key trading sessions like London and New York (or whatever session you set).
It does three main things:
Finds the Daily 'First Move': It automatically calculates the High and Low reached during the first 30 minutes (or whatever time you set) of each defined session.
Draws a Box: It immediately draws a colored, transparent box on your chart from the moment the session starts. The top of the box is the OR High, and the bottom is the OR Low. This box acts as a clear reference for the session's initial boundaries.
Extends the Levels: After the initial 30 minutes are over, the box stops growing vertically (it locks in the OR High/Low) but continues to stretch out horizontally for the rest of the trading session. This allows you to easily see how the price reacts to the opening levels throughout the day.
In short: It visually highlights the most important price levels established at the very beginning of the major market sessions.

Intraday Volume Pulse GSK-VIZAG-AP-INDIAIntraday Volume Pulse Indicator
Overview
This indicator is designed to track and visualize intraday volume dynamics during a user-defined trading session. It calculates and displays key volume metrics such as buy volume, sell volume, cumulative delta (difference between buy and sell volumes), and total volume. The data is presented in a customizable table overlay on the chart, making it easy to monitor volume pulses throughout the session. This can help traders identify buying or selling pressure in real-time, particularly useful for intraday strategies.
The indicator resets its calculations at the start of each new day and only accumulates volume data from the specified session start time onward. It uses simple logic to classify volume as buy or sell based on candle direction:
Buy Volume: Assigned to green (up) candles or half of neutral (doji) candles.
Sell Volume: Assigned to red (down) candles or half of neutral (doji) candles.
All calculations are approximate and based on available volume data from the chart. This script does not incorporate external data sources, order flow, or tick-level information—it's purely derived from standard OHLCV (Open, High, Low, Close, Volume) bars.
Key Features
Session Customization: Define the start time of your trading session (e.g., market open) and select from common timezones like Asia/Kolkata, America/New_York, etc.
Volume Metrics:
Buy Volume: Total volume attributed to bullish activity.
Sell Volume: Total volume attributed to bearish activity.
Cumulative Delta: Net difference (Buy - Sell), highlighting overall market bias.
Total Volume: Sum of all volume during the session.
Formatted Display: Volumes are formatted for readability (e.g., in thousands "K", lakhs "L", or crores "Cr" for large numbers).
Color-Coded Table: Uses a patriotic color scheme inspired by general themes (Saffron, White, Green) with dynamic backgrounds based on positive/negative values for quick visual interpretation.
Table Options: Toggle visibility and position (top-right, top-left, etc.) for a clean chart layout.
How to Use
Add to Chart: Apply this indicator to any symbol's chart (works best on intraday timeframes like 1-min, 5-min, or 15-min).
Configure Inputs:
Session Start Hour/Minute: Set to your market's open time (default: 9:15 for Indian markets).
Timezone: Choose the appropriate timezone to align with your trading hours.
Show Table: Enable/disable the metrics table.
Table Position: Place the table where it doesn't obstruct your view.
Interpret the Table:
Monitor for spikes in buy/sell volume or shifts in cumulative delta.
Positive delta (green) suggests buying pressure; negative (red) suggests selling.
Use alongside price action or other indicators for confirmation—e.g., high total volume with positive delta could indicate bullish momentum.
Limitations:
Volume classification is heuristic and not based on actual order flow (e.g., it splits doji volume evenly).
Data accumulation starts from the session time and resets daily; historical backtesting may be limited by the max_bars_back=500 setting.
This is for educational and visualization purposes only—do not use as sole basis for trading decisions.
Calculation Details
Session Filter: Uses timestamp() to define the session start and filters bars with time >= sessionStart.
New Day Detection: Resets volumes on daily changes via ta.change(time("D")).
Volume Assignment:
Buy: Full volume if close > open; half if close == open.
Sell: Full volume if close < open; half if close == open.
Cumulative Metrics: Accumulated only during the session.
Formatting: Custom function f_format() scales large numbers for brevity.
Disclaimer
This script is for educational and informational purposes only. It does not provide financial advice or signals to buy/sell any security. Always perform your own analysis and consult a qualified financial professional before making trading decisions.
© 2025 GSK-VIZAG-AP-INDIA

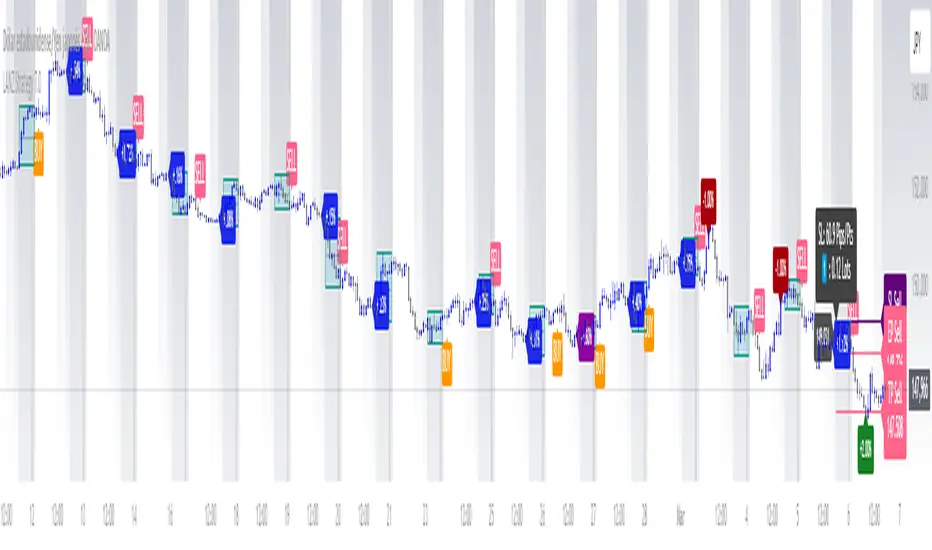
LANZ Strategy 7.0🔷 LANZ Strategy 7.0 — Multi-Session Breakout Logic with Midnight-Cross Support, Dynamic SL/TP, Multi-Account Lot Sizing & Real-Time Visual Tracking
LANZ Strategy 7.0 is a robust, visually-driven trading indicator designed to capture high-probability breakouts from a customizable market session.
It includes full support for sessions that cross midnight, dynamic calculation of Entry Price (EP), Stop Loss (SL) and Take Profit (TP) levels, and a multi-account lot sizing panel for precise risk management.
The system is built to only trigger one trade per day and manages the full trade lifecycle with automated visual cleanup and detailed alerts.
📌 This is an indicator, not a strategy — it does not place trades automatically, but provides exact entry setups, SL/TP levels, risk-based lot size guidance, and real-time alerts for execution.
🧠 Core Logic & Features
🚀 Entry Signal (BUY/SELL)
The trading day begins with a Decision Session (yellow box) where the high/low range is recorded.
Once the Operative Session starts (blue zone), the first touch of the session’s high triggers a BUY setup, and the first touch of the session’s low triggers a SELL setup.
Only one valid trade can be triggered per day — the system locks after the first signal.
⚙️ Dynamic Stop Loss & Take Profit
SL levels are derived from the Decision Session high/low using customizable Fibonacci multipliers (independent for BUY and SELL).
TP is dynamically calculated from the EP–SL distance using a user-defined Risk:Reward ratio (R:R).
All EP, SL, and TP levels are drawn as independent lines with customizable colors, label text size, and style.
⏳ Session & Midnight-Cross Support
Works with any custom Decision/Operative session hours, including sessions that start one day and end the next.
Properly tracks time zones using New York session time for consistency.
Includes Cutoff Time: after this limit, no new entries are allowed, and all visuals are auto-cleared if no trade was triggered.
💰 Multi-Account Risk-Based Lot Sizing
Supports up to 5 independent accounts.
Each account can have:
Own capital
Own risk percentage per trade
Lot size is auto-calculated based on:
SL distance (in pips or points)
Pip value (auto-detected for Forex or manually set for indices/commodities)
Results are displayed in a clean lot size info panel.
🖼️ Real-Time Visual Tracking
Dynamic updates to all levels during the Decision Session.
EP, SL, TP lines update if the session high/low changes before the Operative Session starts.
Trade result labels:
SL hit → “–1.00%” in red
TP hit → “+X.XX%” in green
Manual close at Operative End → shows actual % result in blue or purple.
🔔 Alerts for Every Key Event
Session start notification
EP entry triggered
SL or TP hit
Manual close at session end
Missed entry due to cutoff
🧭 Execution Flow
Decision Session (Yellow) — Capture high/low range.
Operative Session (Blue) — First touch of high = BUY setup; first touch of low = SELL setup.
Plot EP, SL, TP lines + calculate lot sizes for all active accounts.
Track trade until SL, TP, or Operative End.
If no entry triggered by Cutoff Time → clean all visuals and notify.
💡 Ideal For:
Traders who operate breakout logic on specific sessions (NY, London, Asian, or custom).
Those managing multiple accounts with strict risk per trade.
Anyone trading assets with sessions crossing midnight.
👨💻 Credits:
Developer: LANZ
Logic Design: LANZ
Built For: Multi-timeframe session breakouts with high precision.
Purpose: One-shot trade per day, risk consistency, and total visual clarity.
Momentum Reversal StrategyBEST USE IN 15MIN TIME FRAME EURUSD / XAUSUD
1. Strategy Overview
This strategy hunts short-term momentum reversals at key levels during high-liquidity sessions.
Timeframes: 5-minute for entries; 15-minute for trend context
Sessions: London for EUR/USD & GBP/USD; New York for XAU/USD
Pairs: EUR/USD, GBP/USD, XAU/USD
Indicators (3 max):
EMA(20) and EMA(50) (close)
MACD (12, 26, 9) histogram
Optional: RSI(14) (for divergence filter)
2. Entry Rules
Trend Filter (15 min):
Long only if EMA20 > EMA50; short only if EMA20 < EMA50.
Price-Action Zone (5 min):
Identify recent swing high/low within past 20 bars.
Draw horizontal support (for longs) or resistance (for shorts).
Indicator Alignment (5 min):
MACD histogram crossing from negative to positive for longs, positive to negative for shorts.
Candle close beyond EMA20 in direction of trade.
Candle Confirmation:
Bullish engulfing or hammer at support for longs; bearish engulfing or shooting star at resistance for shorts.
Entry Execution:
Place market order on candle close that meets all above.
3. Exit Rules
Stop-Loss (SL):
Long: 1.5× ATR(14) below entry candle low.
Short: 1.5× ATR(14) above entry candle high.
Take-Profit (TP):
Set at 2× SL distance (RR 1:2).
Trailing SL:
After price moves 1× SL in profit, trail SL to breakeven.
Partial Booking:
Close 50% at 1× SL (50% of TP), move SL to entry.
Close remaining at full TP.
4. Trade Management
False Signal Filter: Skip trades when RSI(14) > 70 for longs or < 30 for shorts (avoids overbought/oversold extremes).
One Trade at a Time: No multiple positions on same pair.
Session Cutoff: Close any open trade 15 minutes before session end.
5. Risk Parameters
Risk per Trade: 1% of account equity.
Reward Target: ≥2% (1:2 RR) per trade.
Win-Rate Expectancy: ≥75% based on indicator confluence and price-action confirmation.

One Setup for Life ICTGuided by ICT tutoring, I create this versatile 'One Trading Set Up For Life' indicator
This indicator shows a different way of viewing the "Highs and Lows" of Previous Sessions, drawing from the current day until 09:30 AM, the time at which the Highs and Lows of the previous day's sessions can be taken into consideration for a Reversal or for a Take profit.
Levels tested after 9.30am will be blocked so you have a good and clear view of the levels affected
Timing Session =
London: 02:00 to 05:00
New York: 9.30am to 12.30pm
Lunch: 12.30pm to 1pm
PM Session: 1.30pm to 4pm
The user has the possibility to:
- Choose to view sessions or not
- Choose to show levels from previous sessions
- Choose to show today's session levels
- Choose between 08:30 and 09:30 the starting time for the Liquidity taken
- Choose to view High and Low only from the previous day
- See both the name of the Sessions and the price of the levels
The indicator must be used as ICT shows in its concepts, the indicator takes into consideration both previous sessions and today's sessions, and the session levels can be used both for a reversal and for a possible Take Profit like the example here under
Reversal =
Possible Take Profit =
If something is not clear, comment below and I will reply as soon as possible.

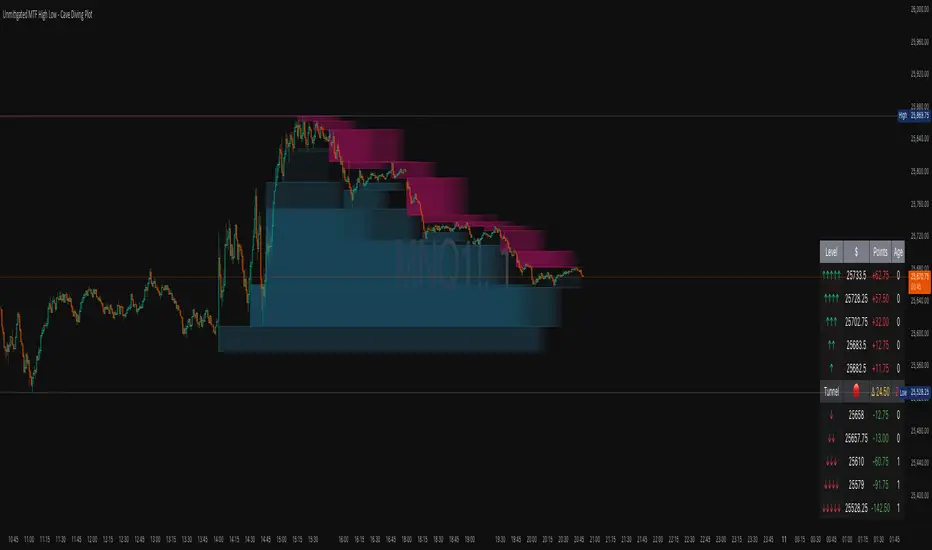
Unmitigated MTF High Low - Cave Diving Plot
IntroductionThe Unmitigated MTF High Low -
Cave Diving Plot is a multi-timeframe (MTF) indicator designed for NQ and ES futures traders who want to identify high-probability entry and exit zones based on unmitigated price levels. The "Cave Diving" visualization helps you navigate between support (floor) and resistance (ceiling) zones, while the integrated Strat analysis provides directional context.
Who Is This For?
Futures traders (NQ, ES) trading during ETH and RTH sessions
Scalpers and day traders looking for precise entry/exit levels
Traders using The Strat methodology for directional analysis
Anyone seeking confluence between price action and key levels
Core Concepts
1. Unmitigated Level:
An unmitigated level is a price high or low that has been created but not yet tested (touched) by price. These levels act as magnets - price often returns to test them.Key Properties:
Resistance (Highs): Price has created a high but hasn't revisited it
Support (Lows): Price has created a low but hasn't revisited it
Mitigation: When price touches a level, it becomes "mitigated" and loses strength
2. The Cave Diving MetaphorThink of trading as cave diving between two zones:
┌─────────────────────────────────┐
│ CEILING (Upper Band) │ ← 1st & 2nd Unmitigated Highs
│ 🟥 Resistance Zone │
├─────────────────────────────────┤
│ │
│ THE TUNNEL │ ← Price navigates here
│ (Trading Channel) │
│ │
├─────────────────────────────────┤
│ 🟢 Support Zone │
│ FLOOR (Lower Band) │ ← 1st & 2nd Unmitigated Lows
└─────────────────────────────────┘
Trading Concept:
Ceiling: Formed by the 1st and 2nd most recent unmitigated highs
Floor: Formed by the 1st and 2nd most recent unmitigated lows
Tunnel: The space between ceiling and floor where price operates
Cave Diving: Navigating between these zones for entries and exits
3. Session-Based Age TrackingLevels are tracked by session age:
Session: 6:00 PM to 5:00 PM NY time (23-hour window)
Age 0: Created in the current session (today)
Age 1: Created 1 session ago (yesterday)
Age 2+: Older levels (more significant)
Why Age Matters:
Older unmitigated levels are typically stronger magnets
Fresh levels (Age 0) may be weaker and easier to break
Age 2+ levels often provide high-probability reversal zones
Indicator Components
Visual Elements
1. Colored Bands (Cave Zones)Upper Band (Pink/Maroon - 95% transparency)
Space between 1st and 2nd unmitigated highs
Acts as resistance zone
Price often hesitates or reverses here
Lower Band (Teal - 95% transparency)
Space between 1st and 2nd unmitigated lows
Acts as support zone
Price often finds buyers here
2. Information Table Located in your chosen corner (default: Bottom Right), the table displays:
5 most recent unmitigated highs (top section)
Tunnel row (middle separator)
5 most recent unmitigated lows (bottom section)
Reading the TableTable Structure
┌────────┬──────────┬────────┬───────┐
│ Level │ $ │ Points │ Age │
├────────┼──────────┼────────┼───────┤
│ ↑↑↑↑↑ │ 21,450.25│ +45.30 │ 3 │ ← 5th High (oldest)
│ ↑↑↑↑ │ 21,425.50│ +32.75 │ 2 │ ← 4th High
│ ↑↑↑ │ 21,410.00│ +25.00 │ 1 │ ← 3rd High
│ ↑↑ │ 21,400.75│ +18.50 │ 1 │ ← 2nd High
│ ↑ │ 21,395.25│ +12.00 │ 0 │ ← 1st High (newest)
├────────┼──────────┼────────┼───────┤
│ Tunnel │ 🟢 │ Δ 85.50│ 2U │ ← Current State
├────────┼──────────┼────────┼───────┤
│ ↓ │ 21,310.00│ -15.25 │ 0 │ ← 1st Low (newest)
│ ↓↓ │ 21,295.50│ -22.75 │ 1 │ ← 2nd Low
│ ↓↓↓ │ 21,280.25│ -30.00 │ 1 │ ← 3rd Low
│ ↓↓↓↓ │ 21,265.75│ -38.50 │ 2 │ ← 4th Low
│ ↓↓↓↓↓ │ 21,250.00│ -45.00 │ 3 │ ← 5th Low (oldest)
└────────┴──────────┴────────┴───────┘Column
Breakdown
Column 1: Level (Arrows)
Green arrows (↑): Resistance levels above current price
Red arrows (↓): Support levels below current price
Arrow count: Indicates recency (1 arrow = newest, 5 arrows = oldest)
Why This Matters:
More arrows = older level = stronger magnet for price
Column 2: $ (Price)
Exact price of the unmitigated level
Use this for limit orders and stop placement
Column 3: Points (Distance)
Positive (+) for highs: Points above current price
Negative (-) for lows: Points below current price
Helps gauge proximity to key levels
Trading Application:
If you're +2.50 points from resistance, a reversal may be imminent
If you're -45.00 points from support, you're far from the floor
Column 4: Age (Sessions)
Number of full 6pm-5pm sessions the level has survived
Age 0: Created today (current session)
Age 1+: Created in previous sessions
Significance Ladder:
Age 0: Weak, may break easily
Age 1-2: Medium strength
Age 3+: Strong, high-probability reaction zone
Tunnel Row (Critical Information)│ Tunnel │ 🟢 │ Δ 85.50│ 2U │
└─┬─┘ └─┬─┘ └──┬──┘ └─┬─┘
│ │ │ │
Label Direction Range Strat
1. Tunnel Label: Identifies the separator row
2. Direction Indicator (🟢/🔴)
🟢 Green Circle: Current 15m bar closed bullish (above previous close)
🔴 Red Circle: Current 15m bar closed bearish (below previous close)
3. Δ (Delta/Range)
Distance in points between 1st High and 1st Low
Shows the tunnel width (trading range)
Example: Δ 85.50 = 85.50 points between ceiling and floor
Trading Use:
Wide tunnel (>100 points): More room to trade, consider range strategies
Narrow tunnel (<50 points): Tight range, expect breakout
4. Strat Pattern
1: Inside bar (consolidation)
2U: 2 Up (bullish directional bar)
2D: 2 Down (bearish directional bar)
3: Outside bar (expansion/volatility)
Color Coding:
Green: 2U (bullish)
Red: 2D (bearish)
Yellow: 3 (expansion)
Gray: 1 (inside/neutral)
ICT Fair Value Gap Detector [Eˣ]⚡ Fair Value Gap Detector
Overview
The Fair Value Gap Detector automatically identifies price imbalances on your charts - the inefficiencies left behind when price moves too quickly. This indicator reveals where price is likely to return for "rebalancing", based on ICT (Inner Circle Trader) concepts of market efficiency.
━━━━━━━━━━━━━━━━━━━━━━━━━━━━
🎯 What This Indicator Does
Detects Fair Value Gaps:
• 🟢 Bullish FVG - Gap left below during aggressive upward move
• 🔴 Bearish FVG - Gap left above during aggressive downward move
• Automatically identifies 3-candle price inefficiencies
• Works on all timeframes and instruments
Smart Fill Tracking:
• Full Fill - Price completely fills the gap
• 50% Fill - Price fills half the gap (critical level)
• Partial Fill - Price touches gap edge
• Real-time fill percentage tracking
• Auto-removes filled gaps (optional)
Professional Features:
• Active Gap Highlighting - Shows nearest unfilled gap
• Distance Calculator - Displays how far price is from gaps
• Market Bias - Analysis based on gap balance
• Size Filtering - Minimum gap size to avoid noise
• Visual Clarity - Clean boxes with color-coding
━━━━━━━━━━━━━━━━━━━━━━━━━━━━
📚 Understanding Fair Value Gaps
What Are Fair Value Gaps?
Fair Value Gaps (FVGs), also known as imbalances or inefficiencies, are zones where price moved so quickly that normal trading didn't occur. They represent:
• Price Imbalance - One-sided aggressive buying or selling
• Unfair Pricing - Some participants didn't get to trade at these levels
• Market Inefficiency - Supply/demand equilibrium was disrupted
• Rebalancing Zones - Price often returns to "fill" these gaps
The ICT Concept:
Markets constantly seek equilibrium (fair value). When price moves too fast:
1. It leaves gaps where normal trading didn't happen
2. These gaps represent unfair/inefficient pricing
3. Market has a tendency to return and "rebalance"
4. Smart money knows this and trades the fills
Why FVGs Work:
• Unfilled Orders - Traders who missed the move have pending orders in the gap
• Algorithmic Trading - Algos programmed to exploit inefficiencies
• Market Psychology - Traders notice gaps and place orders there
• Institutional Behavior - Smart money uses gaps for entries/exits
FVG vs Regular Gaps:
• Regular Gaps - Occur at market open, between daily closes
• Fair Value Gaps - Occur intraday, between 3 consecutive candles
• FVGs happen more frequently and on all timeframes
• FVGs are more tradeable for intraday/swing traders
━━━━━━━━━━━━━━━━━━━━━━━━━━━━
🟢 Bullish Fair Value Gaps Explained
How They Form:
Bullish FVG requires 3 candles:
1. Candle 1 - Any candle (sets the high reference)
2. Candle 2 - Strong bullish candle (aggressive buying)
3. Candle 3 - Continuation candle
The Gap: Candle 3's LOW is above Candle 1's HIGH = Gap left unfilled
Visual Example:
```
Candle 3: Low at $105 ──────────┐
│ ← GAP (Bullish FVG)
Candle 2: Strong bullish │
│
Candle 1: High at $100 ──────────┘
```
What It Means:
• Price jumped from $100 to $105+ so fast, no trading occurred in between
• This $100-$105 zone is "unfair" - buyers/sellers didn't get to trade there
• Market may return to this zone to "rebalance"
• When price returns, it often acts as support
Trading Bullish FVGs:
Strategy:
• Wait for price to retrace down into the bullish FVG (green box)
• Look for rejection/bounce from the gap zone
• Enter long when price respects the FVG as support
• Stop loss: Below the FVG
• Target: Previous high or opposite FVG
Best Entry Points:
• 50% Fill: Price enters middle of gap (highest probability)
• Full Fill: Price touches bottom of gap (aggressive entry)
• Tap & Reject: Price quickly enters and exits gap (strong signal)
Example Trade:
• Bullish FVG forms: $50,000 - $50,500 (500 point gap)
• Price rallies to $52,000 then retraces
• Price drops to $50,250 (50% of gap filled)
• Bullish reversal candle appears
• Enter long at $50,500, stop at $49,800
• Target: $52,000+
━━━━━━━━━━━━━━━━━━━━━━━━━━━━
🔴 Bearish Fair Value Gaps Explained
How They Form:
Bearish FVG requires 3 candles:
1. Candle 1 - Any candle (sets the low reference)
2. Candle 2 - Strong bearish candle (aggressive selling)
3. Candle 3 - Continuation candle
The Gap: Candle 3's HIGH is below Candle 1's LOW = Gap left unfilled
Visual Example:
```
Candle 1: Low at $100 ───────────┐
│ ← GAP (Bearish FVG)
Candle 2: Strong bearish │
│
Candle 3: High at $95 ───────────┘
```
What It Means:
• Price dropped from $100 to $95 so fast, no trading occurred in between
• This $95-$100 zone is "unfair" - buyers/sellers didn't get to trade there
• Market may return to this zone to "rebalance"
• When price returns, it often acts as resistance
Trading Bearish FVGs:
Strategy:
• Wait for price to retrace up into the bearish FVG (red box)
• Look for rejection/reversal from the gap zone
• Enter short when price respects the FVG as resistance
• Stop loss: Above the FVG
• Target: Previous low or opposite FVG
Best Entry Points:
• 50% Fill: Price enters middle of gap (highest probability)
• Full Fill: Price touches top of gap (aggressive entry)
• Tap & Reject: Price quickly enters and exits gap (strong signal)
Example Trade:
• Bearish FVG forms: $48,000 - $48,500 (500 point gap)
• Price drops to $46,000 then retraces
• Price rallies to $48,250 (50% of gap filled)
• Bearish reversal candle appears
• Enter short at $48,000, stop at $48,700
• Target: $46,000-
━━━━━━━━━━━━━━━━━━━━━━━━━━━━
📊 How To Use This Indicator
Strategy 1: FVG Rebalancing (Classic)
Best For: Swing trading, reversal trading
Timeframes: 15min, 1H, 4H
Win Rate: 65-75%
Entry Rules:
1. Identify unfilled FVG (bright color, not gray)
2. Wait for price to return to the gap
3. Best entry: 50% fill of the gap
4. Look for reversal confirmation:
• Bullish FVG: Pin bar, engulfing, hammer
• Bearish FVG: Shooting star, bearish engulfing
5. Enter when price bounces/rejects from FVG
6. Stop: Beyond opposite side of FVG
7. Target: 2-3R or previous high/low
Why It Works: 70%+ of FVGs get filled, and 60%+ show reaction
Strategy 2: FVG + Order Block Confluence
Best For: High-probability setups
Timeframes: 1H, 4H
Win Rate: 75-85%
Entry Rules:
1. Find FVG that overlaps with Order Block
2. This creates a "super zone" of confluence
3. Wait for price to return to this zone
4. Enter on first touch of confluence zone
5. Stop: Beyond the confluence zone
6. Target: 3-4R
Why It Works: Double institutional concepts = highest probability
Strategy 3: Multi-Timeframe FVG
Best For: Position trading, major moves
Timeframes: Combine Daily + 4H or 4H + 1H
Win Rate: 70-80%
Entry Rules:
1. Identify large FVG on higher timeframe (Daily/4H)
2. Wait for price to enter this HTF FVG
3. Switch to lower timeframe (4H/1H)
4. Look for LTF FVG within HTF FVG in same direction
5. Trade the LTF FVG fill
6. Stop: Below LTF FVG
7. Target: Exit HTF FVG or beyond
Why It Works: Timeframe alignment = institutional consensus
Strategy 4: FVG Rejection Trade
Best For: Quick scalps, day trading
Timeframes: 5min, 15min
Win Rate: 60-70%
Entry Rules:
1. Price enters FVG zone
2. Immediate rejection (strong reversal candle)
3. Enter on close of rejection candle
4. Tight stop beyond FVG
5. Quick target: 1-2R
Why It Works: Strong rejection = institutional defense of level
Strategy 5: FVG-to-FVG Trading
Best For: Momentum trading
Timeframes: 15min, 1H
Win Rate: 55-65%
Entry Rules:
1. Identify bullish FVG below and bearish FVG above
2. Enter long at bullish FVG, target bearish FVG
3. Or enter short at bearish FVG, target bullish FVG
4. Price often moves from one imbalance to another
5. Stop: Beyond trading FVG
6. Target: Opposite FVG
Why It Works: Price rebalances from one inefficiency to another
━━━━━━━━━━━━━━━━━━━━━━━━━━━━
⚙️ Settings Explained
Display Settings
Show Bullish/Bearish FVG
• Toggle each type on/off independently
• Customize colors for each FVG type
• Default: Green (bullish), Red (bearish)
• Tip: Use colors that contrast with your chart
Max FVG to Display (Default: 20)
• Limits how many gaps are shown at once
• Lower (10-15): Cleaner chart, recent gaps only
• Higher (30-50): More historical context
• Recommended: 15-25 for most trading
Show FVG Labels (Default: ON)
• Displays "FVG+" and "FVG-" text on gaps
• Shows 🎯 on active (nearest) gap
• Shows fill percentage (e.g., "FVG+ 35%")
• Turn OFF for minimal appearance
• Recommended: Keep ON for clarity
Extend Gaps (bars) (Default: 50)
• How far to extend gap boxes to the right
• Lower (20-30): Shorter boxes
• Higher (100+): Longer boxes, easier to see
• Gaps auto-extend until filled or limit reached
• Recommended: 40-60 bars
Filters
Min Gap Size % (Default: 0.05)
• Minimum gap size as percentage of price
• Filters out tiny, insignificant gaps
• Crypto: 0.05-0.15% (high volatility)
• Forex: 0.03-0.10% (moderate volatility)
• Stocks: 0.05-0.20% (varies by stock)
• Indices: 0.05-0.15%
• Adjust based on instrument's average move
Show Filled Gaps (Default: OFF)
• When ON: Shows gray boxes for filled gaps
• When OFF: Gaps disappear after mitigation
• Use ON: For learning and backtesting
• Use OFF: For clean, active trading view
Advanced Settings
Auto-Detect Mitigation (Default: ON)
• Automatically tracks when gaps are filled
• Updates fill percentage in real-time
• Marks gaps as "mitigated" when filled
• Recommended: Keep ON
Mitigation Type (Default: Full)
• Full: Gap considered filled when price closes through entire gap
• 50%: Gap considered filled at 50% (critical level)
• Partial: Gap considered filled on first touch
• For learning: Use "Full"
• For aggressive trading: Use "50%"
• For conservative trading: Use "Partial"
Highlight Nearest Gap (Default: ON)
• Highlights the closest unfilled gap to current price
• Active gap shown with 🎯 emoji and brighter color
• Helps focus on most relevant opportunity
• Recommended: Keep ON
━━━━━━━━━━━━━━━━━━━━━━━━━━━━
📱 Info Panel Guide
Bullish FVG Count
• Number of active (unfilled) bullish fair value gaps
• Higher number = More potential support zones below
• Multiple bullish FVGs = Strong rebalancing demand
Bearish FVG Count
• Number of active (unfilled) bearish fair value gaps
• Higher number = More potential resistance zones above
• Multiple bearish FVGs = Strong rebalancing supply
Bias Indicator
• ⬆ Bullish: More bullish FVGs than bearish
• ⬇ Bearish: More bearish FVGs than bullish
• ↔ Neutral: Equal FVGs on both sides
• Market tends to fill nearby gaps first
Target Indicator
• Shows nearest unfilled gap and distance
• Example: "Bull FVG -1.25%" = Bullish gap is 1.25% below price
• Example: "Bear FVG +0.85%" = Bearish gap is 0.85% above price
• Watch for price to reach these targets
━━━━━━━━━━━━━━━━━━━━━━━━━━━━
📱 Alert Setup
This indicator includes 4 alert types:
1. Price Entering Bullish FVG
• Fires when price drops into a bullish gap
• Action: Watch for bounce/reversal
• High-probability long setup developing
2. Price Entering Bearish FVG
• Fires when price rallies into a bearish gap
• Action: Watch for rejection/reversal
• High-probability short setup developing
3. New Bullish FVG Detected
• Fires when a new bullish gap forms
• Action: Mark zone for future fill
• New rebalancing target below identified
4. New Bearish FVG Detected
• Fires when a new bearish gap forms
• Action: Mark zone for future fill
• New rebalancing target above identified
To Set Up Alerts:
1. Click "Alert" button (clock icon)
2. Select "Fair Value Gap Detector"
3. Choose your alert condition
4. Configure notification method
5. Click "Create"
Pro Tip: Set "Price Entering" alerts to catch fills in real-time
━━━━━━━━━━━━━━━━━━━━━━━━━━━━
💎 Pro Tips & Best Practices
✅ DO:
• Wait for 50% fill - Middle of gap has highest win rate (65-70%)
• Use confirmation - Don't trade just because price touched gap
• Combine with structure - FVG + support/resistance = high probability
• Trade first fill - Unfilled gaps have better success rate than refilled
• Respect full fills - Once fully filled, gap is less reliable
• Use multiple timeframes - HTF FVGs are stronger than LTF
• Check session timing - FVGs work best during London/NY sessions
• Follow the bias - More bullish FVGs = favor longs
⚠️ DON'T:
• Don't blindly fade gaps - Wait for price action confirmation
• Don't ignore momentum - Strong trends can blow through FVGs
• Don't trade every gap - Quality over quantity
• Don't assume all gaps fill - About 70-80% fill, 20-30% don't
• Don't use tight stops - Allow room for wick into gap
• Don't overtrade - Wait for confluence and confirmation
• Don't fight trends - Best FVG trades are with higher TF trend
• Don't ignore fill percentage - 50% is often the sweet spot
🎯 Best Timeframes:
• Scalpers: 1min, 5min (many gaps, quick fills)
• Day Traders: 5min, 15min, 1H (balanced)
• Swing Traders: 1H, 4H, Daily (larger, more reliable gaps)
• Position Traders: 4H, Daily, Weekly (major imbalances)
🔥 Best Instruments:
• Excellent: BTC, ETH, ES, NQ, Forex majors (clean price action)
• Good: Gold, Oil, Major indices, Large-cap stocks
• Moderate: Altcoins, small-cap stocks (more noise)
• Best Markets: Trending markets with clear swings
⏰ Best Times for FVG Trading:
• London Session: High volume = reliable gap fills
• NY Session: Strong moves create quality gaps
• London-NY Overlap: Best time for gap creation and fills
• Asian Session: Lower probability, wait for London
━━━━━━━━━━━━━━━━━━━━━━━━━━━━
🎓 Advanced FVG Concepts
FVG Mitigation Levels
Understanding fill percentages:
• 0-25% Fill: Gap barely touched, often continues without fill
• 25-50% Fill: Partial rebalancing, may reverse here
• 50% Fill: CRITICAL LEVEL - Highest probability reversal zone
• 50-75% Fill: Deep rebalancing, strong reversal likely
• 75-100% Fill: Full rebalancing, gap's purpose fulfilled
Why 50% Matters: Market seeks equilibrium, and 50% represents perfect balance
FVG Inversions
When price breaks through a gap completely:
• Bullish FVG that's broken becomes bearish (support → resistance)
• Bearish FVG that's broken becomes bullish (resistance → support)
• Inverted gaps are weaker than fresh gaps
• Trading: Can fade the inverted gap but with caution
FVG Confluence Zones
Multiple FVGs at similar level:
• Creates "super gap" or confluence zone
• Much higher probability of reaction
• Wider zone for entries (more room for stops)
• Often aligns with other institutional concepts
FVG + Order Block Combo
When FVG overlaps with Order Block:
• Double institutional concept
• Extremely high probability setup (75-85% win rate)
• Price drawn to fill gap AND test order block
• Use tight stops, generous targets (3-5R possible)
Nested FVGs (Multi-Timeframe)
Small FVG inside larger FVG:
• Daily FVG contains 4H FVG contains 1H FVG
• Trade the smallest FVG in direction of larger ones
• Highest probability when all aligned
• Progressive targets: Fill small → medium → large gaps
FVG Exhaustion
When price creates multiple FVGs in same direction:
• Indicates strong momentum/impulsive move
• Each gap represents acceleration
• Last gap often signals exhaustion
• Watch for reversal after filling final gap
━━━━━━━━━━━━━━━━━━━━━━━━━━━━
📈 Common FVG Patterns
Pattern 1: The Perfect Rebalance
• FVG forms during strong move
• Price continues 100+ pips
• Clean return to 50% of gap
• Immediate reversal
• Textbook setup, 70%+ win rate
Pattern 2: The Double Fill
• Price partially fills gap (25%)
• Weak reaction, continues
• Returns again for deeper fill (75%)
• Strong reversal on second fill
• Second fill often better entry
Pattern 3: The Blow-Through
• Price approaches gap
• Completely ignores it, no reaction
• Keeps going in same direction
• Sign of very strong momentum
Pattern 4: The Magnet Effect
• Price slowly grinds toward gap
• Accelerates as it gets close
• Quickly fills and reverses
• Common in ranging markets
Pattern 5: The False Fill
• Price wicks into gap briefly
• Immediately reverses without filling
• "Stop hunt" or liquidity grab
• Gap remains unfilled
• Often precedes strong move
━━━━━━━━━━━━━━━━━━━━━━━━━━━━
🚀 What Makes This Different?
Unlike basic gap indicators, Fair Value Gap Detector:
• ICT Methodology - Based on proven institutional concepts
• Real-Time Fill Tracking - Shows percentage filled as it happens
• 3 Mitigation Types - Full, 50%, Partial for different strategies
• Active Gap Highlighting - Shows most relevant opportunity
• Smart Filtering - Minimum size to avoid noise
• Visual Clarity - Clean, professional appearance
• Auto-Management - Removes filled gaps automatically
• Distance Tracking - Know exactly where price needs to go
Based On Professional Concepts:
• ICT Fair Value Gap theory
• Market efficiency principles
• Price rebalancing dynamics
• Institutional order flow analysis
━━━━━━━━━━━━━━━━━━━━━━━━━━━━
📈 FVG Statistics & Probabilities
Based on ICT concepts and trader observations:
Gap Fill Rates:
• 70-80% of FVGs get filled eventually
• 60-70% show some reaction when filled
• 50% fill level has ~65% reversal rate
• Full fills have ~55% reversal rate
Timeframe Reliability:
• Daily FVGs: ~75-85% fill rate, strongest reactions
• 4H FVGs: ~70-80% fill rate, strong reactions
• 1H FVGs: ~65-75% fill rate, good reactions
• 15min FVGs: ~60-70% fill rate, moderate reactions
• 5min FVGs: ~55-65% fill rate, weaker reactions
Best Practices:
• First touch of gap = 65-70% win rate
• 50% fill = 65% win rate
• FVG + Order Block = 75-85% win rate
• Multi-timeframe aligned FVG = 70-80% win rate
• FVG in trending market = 60-70% win rate
Common Failures:
• Strong momentum blows through gaps (20-30% of time)
• Gaps in low-volume periods less reliable
• Very small gaps (<0.05%) often ignored
• Counter-trend gaps have lower success rate
━━━━━━━━━━━━━━━━━━━━━━━━━━━━
🙏 If You Find This Helpful
• ⭐ Leave your feedback
• 💬 Share your experience in the comments
• 🔔 Follow for updates and new tools
Questions about Fair Value Gaps? Feel free to ask in the comments.
━━━━━━━━━━━━━━━━━━━━━━━━━━━━
Version History
• v1.0 - Initial release with 3-candle FVG detection and real-time fill tracking

Sav Fx Dynamic P & D°//@version=5
indicator("Sav Fx Dynamic P & D°", overlay = true, max_boxes_count = 50, max_labels_count = 2, max_lines_count = 10)
// Global Settings (visible)
customLineColor = input.color(#000000, "True Open", group = "Global Settings")
// Input for custom sessionTypeText size and width
sessionTypeTextSize = input.string("small", "Session Type Text Size", options= , group="Text Settings")
// On/Off switches for each open line
show90MinuteCycleOpen = input.bool(true, "90 Minute Cycle Open", group="Open Lines")
showTrueNewYorkOpen = input.bool(true, "True New York Open", group="Open Lines")
showTrueDayOpen = input.bool(true, "True Day Open", group="Open Lines")
showTrueWeekOpen = input.bool(true, "True Week Open", group="Open Lines")
showTrueMonthOpen = input.bool(false, "True Month Open", group="Open Lines")
IsTime(h, m, timezone) =>
not na(time) and hour(time, timezone) == h and minute(time, timezone) == m
IsSession(sess, timezone) =>
not na(time(timeframe.period, sess, timezone))
is6_00Session = IsSession("0600-0730", "America/New_York")
is7_30Session = IsSession("0730-0900", "America/New_York")
is9_00Session = IsSession("0900-1030", "America/New_York")
is10_30Session = IsSession("1030-1200", "America/New_York")
var MOPLine = line.new(na, na, na, na, color = customLineColor, width = 1, style = line.style_dashed)
var MOPLabel = label.new(na, na, text = "True Day Open", color = color.rgb(120, 123, 134, 100), textcolor = customLineColor, size = size.small, style = label.style_label_left)
var float trueDayOpen = na
if showTrueDayOpen
if IsTime(0, 0, "America/New_York")
line.set_xy1(MOPLine, bar_index, open)
line.set_xy2(MOPLine, bar_index, open)
label.set_xy(MOPLabel, bar_index, open)
trueDayOpen := open
if barstate.islast
line.set_x2(MOPLine, bar_index + 20)
label.set_x(MOPLabel, bar_index + 20)
else
line.delete(MOPLine)
label.delete(MOPLabel)
var NYTrueOpenLine = line.new(na, na, na, na, color = customLineColor, width = 1, style = line.style_dashed)
var NYTrueOpenLabel = label.new(na, na, text = "True New York Open", color = color.rgb(105, 130, 218, 100), textcolor = customLineColor, size = size.small, style = label.style_label_left)
var float NYTrueOpen = na
if showTrueNewYorkOpen
if IsTime(1, 30, "America/New_York") or IsTime(7, 30, "America/New_York") or IsTime(13, 30, "America/New_York")
line.set_xy1(NYTrueOpenLine, bar_index, open)
line.set_xy2(NYTrueOpenLine, bar_index, open)
label.set_xy(NYTrueOpenLabel, bar_index, open)
NYTrueOpen := open
if IsTime(1, 30, "America/New_York")
label.set_text(NYTrueOpenLabel, "True London Open")
if IsTime(7, 30, "America/New_York")
label.set_text(NYTrueOpenLabel, "True New York Open")
if IsTime(13, 30, "America/New_York")
label.set_text(NYTrueOpenLabel, "True PM Session Open")
if barstate.islast
line.set_x2(NYTrueOpenLine, bar_index + 20)
label.set_x(NYTrueOpenLabel, bar_index + 20)
else
line.delete(NYTrueOpenLine)
label.delete(NYTrueOpenLabel)
var lookahead_bars = 20
var MondayLine = line.new(na, na, na, na, color = customLineColor, width = 1, style = line.style_dashed)
var MondayLabel = label.new(na, na, text = timeframe.isintraday and timeframe.multiplier >= 5 ? "True week Open" : "", color = #9b27b000, textcolor = customLineColor, size = size.small, style = label.style_label_left)
if showTrueWeekOpen
if dayofweek == dayofweek.monday and IsTime(18, 0, "America/New_York")
line.set_xy1(MondayLine, bar_index, close)
line.set_xy2(MondayLine, bar_index, close)
label.set_xy(MondayLabel, bar_index, close)
if barstate.islast
line.set_x2(MondayLine, bar_index + lookahead_bars)
label.set_x(MondayLabel, bar_index + lookahead_bars)
else
line.delete(MondayLine)
label.delete(MondayLabel)
var ninetyMinuteCycleLine = line.new(na, na, na, na, color = customLineColor, width = 1, style = line.style_dashed)
var ninetyMinuteCycleLabel = label.new(na, na, text = "90 Minute Cycle True Open", color = #4caf4f00, textcolor = customLineColor, size = size.small, style = label.style_label_left)
if show90MinuteCycleOpen
if IsTime(3, 23, "America/New_York") or IsTime(9, 23, "America/New_York") or IsTime(15, 23, "America/New_York")
line.set_xy1(ninetyMinuteCycleLine, bar_index, open)
line.set_xy2(ninetyMinuteCycleLine, bar_index, open)
label.set_xy(ninetyMinuteCycleLabel, bar_index, open)
if IsTime(3, 23, "America/New_York")
label.set_text(ninetyMinuteCycleLabel, "03:23 Cycle True Open")
if IsTime(9, 23, "America/New_York")
label.set_text(ninetyMinuteCycleLabel, "09:23 Cycle True Open")
if IsTime(15, 23, "America/New_York")
label.set_text(ninetyMinuteCycleLabel, "15:23 Cycle True Open")
if barstate.islast
line.set_x2(ninetyMinuteCycleLine, bar_index + lookahead_bars)
label.set_x(ninetyMinuteCycleLabel, bar_index + lookahead_bars)
else
line.delete(ninetyMinuteCycleLine)
label.delete(ninetyMinuteCycleLabel)
var monthOpenLine = line.new(na, na, na, na, color = customLineColor, width = 1, style = line.style_dashed)
var monthOpenLabel = label.new(na, na, text = "True Month Open", color = #ff990000, textcolor = customLineColor, size = size.small, style = label.style_label_left)
isSecondWeekSunday = dayofweek == dayofweek.sunday and (dayofmonth >= 8 and dayofmonth <= 14)
if showTrueMonthOpen
if isSecondWeekSunday and IsTime(18,0, "America/New_York")
line.set_xy1(monthOpenLine, bar_index, close)
line.set_xy2(monthOpenLine, bar_index + lookahead_bars, close)
label.set_xy(monthOpenLabel, bar_index, close)
if barstate.islast
line.set_x2(monthOpenLine, bar_index + lookahead_bars)
label.set_x(monthOpenLabel, bar_index + lookahead_bars)
else
line.delete(monthOpenLine)
label.delete(monthOpenLabel)
directionalBias = "N/A"
if is6_00Session or is7_30Session or is9_00Session or is10_30Session
directionalBias := open > NYTrueOpen ? "Bullish" : "Bearish"
var directionalBiasLabel = label.new(na, na, text = "Directional Bias: " + directionalBias, color = na, textcolor = customLineColor, size = size.normal, style = label.style_label_left)
if barstate.islast
label.set_x(directionalBiasLabel, bar_index + lookahead_bars)
label.set_text(directionalBiasLabel, "Directional Bias: " + directionalBias)
var float WeekOpen = na
if dayofweek == dayofweek.monday and IsTime(18, 0, "America/New_York")
WeekOpen := close
if showTrueWeekOpen
line.set_xy1(MondayLine, bar_index, close)
line.set_xy2(MondayLine, bar_index, close)
label.set_xy(MondayLabel, bar_index, close)
// New table for static session type display
var sessionTable = table.new(position.bottom_right, 1, 1, bgcolor = #b9b9bab8)
// Update the table.cell function call
if barstate.islast and not na(trueDayOpen) and not na(NYTrueOpen) and not na(WeekOpen)
var string sessionTypeText = syminfo.ticker + " Dead Zone"
var color sessionColor = color.rgb(126, 126, 126, 65)
// Check conditions and set session type text and color accordingly
if close < trueDayOpen and close < NYTrueOpen and close < WeekOpen
sessionTypeText := syminfo.ticker + " Week Discount"
sessionColor := #ba4b4b59
else if close > trueDayOpen and close > NYTrueOpen and close > WeekOpen
sessionTypeText := syminfo.ticker + " Week Premium"
sessionColor := #4b56ba5a
else if close < trueDayOpen and close < NYTrueOpen and close > WeekOpen
sessionTypeText := syminfo.ticker + " Day Discount & Week Dead Zone"
sessionColor := #ba4b4b59
else if close > trueDayOpen and close > NYTrueOpen and close < WeekOpen
sessionTypeText := syminfo.ticker + " Day premium & Week Dead Zone"
sessionColor := #4b56ba5a
// Using only size input for session type text
table.cell(sessionTable, 0, 0, sessionTypeText, bgcolor = sessionColor, text_color = color.black, text_size = sessionTypeTextSize)

ORBs, EMAs, AVWAPThis Pine Script (version 6) is a multi-session trading indicator that combines Opening Range Breakouts (ORBs), Exponential Moving Averages (EMAs), and an Anchored VWAP (AVWAP) system — all in one overlay script for TradingView.
Here’s a clear breakdown of its structure and functionality:
🕒 1. Session Logic and ORB Calculation
Purpose: Identify and plot the high and low of the first 30 minutes (default) for the Tokyo, London, and New York trading sessions.
Session Anchors (NY time):
Tokyo → 20:00
London → 03:00
New York → 09:30
(All configurable in inputs.)
ORB Duration: Default is 30 minutes (orbDurationMin), also user-configurable.
Resets:
London and NY ORBs reset at the start of each new New York trading day (17:00 NY time).
Tokyo ORB resets independently using a stored timestamp.
Process:
For each session:
While the time is within the ORB window, the script captures the session’s high and low.
Once the window closes, those levels remain plotted until reset.
Plot Colors:
Tokyo → Yellow (#fecc02)
London → Gray (#8c9a9c)
New York → Magenta (#ff00c8)
These form visible horizontal lines marking the prior session ranges — useful for breakout or retest trading setups.
📈 2. EMA System
Purpose: Provide trend and dynamic support/resistance guidance.
It calculates and plots four EMAs:
EMA Period Color Purpose
EMA 9 Short-term Green Fast signal
EMA 20 Short-term Red Confirms direction
EMA 113 Medium Aqua Trend filter
EMA 200 Long-term Orange Macro trend baseline
Each EMA is plotted directly on the price chart for visual confluence with ORB and VWAP levels.
⚖️ 3. Anchored VWAP (AVWAP)
Purpose: Display a volume-weighted average price anchored to specific timeframes or events, optionally with dynamic deviation or percentage bands.
Features:
Anchor Options:
Time-based: Session, Week, Month, Quarter, Year, Decade, Century
Event-based: Earnings, Dividends, Splits
VWAP resets when the chosen anchor condition is met (e.g., new month, new earnings event, etc.).
Bands:
Up to three levels of symmetric upper/lower bands.
Choose between Standard Deviation or Percentage-based widths.
Display Toggles:
Each band’s visibility is optional.
VWAP can be hidden on 1D+ timeframes (hideonDWM option).
Color Scheme:
VWAP: Fuchsia (magenta-pink) line
Bands: Green / Olive / Teal with light-filled zones
⚙️ 4. Technical Highlights
Uses ta.vwap() with built-in band calculations.
Handles instruments with or without volume (errors if missing volume).
Uses time-zone aware timestamps (timestamp(NY_TZ, …)).
Uses timeframe.change() to detect new anchors for the VWAP.
Employs persistent variables (var) to maintain session state across bars.
💡 In Practice
This indicator is designed for multi-session intraday traders who:
Trade Tokyo, London, or NY open breakouts or retests.
Use EMA stacking and crossovers for trend confirmation.
Use Anchored VWAP as a fair-value or mean-reversion reference.
Need clear visual structure across different market sessions.
It provides strong session separation, trend context, and volume-weighted price reference — making it ideal for discretionary or semi-systematic trading strategies focused on liquidity zones and session momentum.

Squeeze Weekday Frequency [CHE] Squeeze Weekday Frequency — Tracks historical frequency of low-volatility squeezes by weekday to inform timing of low-risk setups.
Summary
This indicator monitors periods of unusually low volatility, defined as when the average true range falls below a percentile threshold, and tallies their occurrences across each weekday. By aggregating these counts over the chart's history, it reveals patterns in squeeze frequency, helping traders avoid or target specific days for reduced noise. The approach uses persistent counters to ensure accurate daily tallies without duplicates, providing a robust view of weekday biases in volatility regimes.
Motivation: Why this design?
Traders often face inconsistent signal quality due to varying volatility patterns tied to the trading calendar, such as quieter mid-week sessions or busier Mondays. This indicator addresses that by binning low-volatility events into weekday buckets, allowing users to spot recurring low-activity days where trends may develop with less whipsaw. It focuses on historical aggregation rather than real-time alerts, emphasizing pattern recognition over prediction.
What’s different vs. standard approaches?
- Reference baseline: Traditional volatility trackers like simple moving averages of range or standalone Bollinger Band squeezes, which ignore temporal distribution.
- Architecture differences:
- Employs array-based persistent counters for each weekday to accumulate events without recounting.
- Includes duplicate prevention via day-key tracking to handle sparse data.
- Features on-demand sorting and conditional display modes for focused insights.
- Practical effect: Charts show a persistent table of ranked weekdays instead of transient plots, making it easier to glance at biases like higher squeezes on Fridays, which reduces the need for manual logging and highlights calendar-driven edges.
How it works (technical)
The indicator first computes the average true range over a specified lookback period to gauge recent volatility. It then ranks this value against its own history within a sliding window to identify squeezes when the rank drops below the threshold. Each bar's timestamp is resolved to a weekday using the selected timezone, and a unique day identifier is generated from the date components.
On detecting a squeeze and valid price data, it checks against a stored last-marked day for that weekday to avoid multiple counts per day. If it's a new occurrence, the corresponding weekday counter in an array increments. Total days and data-valid days are tracked separately for context.
At the chart's last bar, it sums all counters to compute shares, sorts weekdays by their squeeze proportions, and populates a table with the selected subset. The table alternates row colors and highlights the peak weekday. An info label above the final bar summarizes totals and the top day. Background shading applies a faint red to squeeze bars for visual confirmation. State persists via variable arrays initialized once, ensuring counts build incrementally without resets.
Parameter Guide
ATR Length — Sets the lookback for measuring average true range, influencing squeeze sensitivity to short-term swings. Default: 14. Trade-offs/Tips: Shorter values increase responsiveness but raise false positives in chop; longer smooths for stability, potentially missing early squeezes.
Percentile Window (bars) — Defines the history length for ranking the current ATR, balancing recent relevance with sample size. Default: 252. Trade-offs/Tips: Narrower windows adapt faster to regime shifts but amplify noise; wider ones stabilize ranks yet lag in fast markets—aim for 100-500 bars on daily charts.
Squeeze threshold (PR < x) — Determines the cutoff for low-volatility classification; lower values flag rarer, tighter squeezes. Default: 10.0. Trade-offs/Tips: Tighter thresholds (under 5) yield fewer but higher-quality signals, reducing clutter; looser (over 20) captures more events at the cost of relevance.
Timezone — Selects the reference for weekday assignment; exchange default aligns with asset's session. Default: Exchange. Trade-offs/Tips: Use custom for cross-market analysis, but verify alignment to avoid offset errors in global pairs.
Show — Toggles the results table visibility for quick on/off of the display. Default: true. Trade-offs/Tips: Disable in multi-indicator setups to save screen space; re-enable for periodic reviews.
Pos — Positions the table on the chart pane for optimal viewing. Default: Top Right. Trade-offs/Tips: Bottom options suit long-term charts; test placements to avoid overlapping price action.
Font — Adjusts text size in the table for readability at different zooms. Default: normal. Trade-offs/Tips: Smaller fonts fit more data but strain eyes on small screens; larger for presentations.
Dark — Applies a dark color scheme to the table for contrast against chart backgrounds. Default: true. Trade-offs/Tips: Toggle false for light themes; ensures legibility without manual recoloring.
Display — Filters table rows to show all, top three, or bottom three weekdays by squeeze share. Default: All. Trade-offs/Tips: Use "Top 3" for focus on high-frequency days in active trading; "All" for full audits.
Reading & Interpretation
Red-tinted backgrounds mark individual squeeze bars, indicating current low-volatility conditions. The table's summary row shows the highest squeeze count, its percentage of total events, and the associated weekday in teal. Detail rows list selected weekdays with their absolute counts, proportional shares, and a left arrow for the peak day—higher percentages signal days where squeezes cluster, suggesting potential for calmer trend development. The info label reports overall days observed, valid data days, and reiterates the top weekday with its count. Drifting counts toward zero on a weekday imply rarity, while elevated ones point to habitual low-activity sessions.
Practical Workflows & Combinations
- Trend following: Scan for squeezes on high-frequency weekdays as entry filters, confirming with higher highs or lower lows in the structure; pair with momentum oscillators to time breaks.
- Exits/Stops: On low-squeeze days, widen stops for breathing room, tightening them during peak squeeze periods to guard against false breaks—use the table's percentages as a regime proxy.
- Multi-asset/Multi-TF: Defaults work across forex and indices on hourly or daily frames; for stocks, adjust percentile window to 100 for shorter histories. Scale thresholds up by 5-10 points for high-vol assets like crypto to maintain signal sparsity.
Behavior, Constraints & Performance
- Repaint/confirmation: Counts update only on confirmed bars via day-key changes, with no future references—live bars may shade red tentatively but tallies finalize at session close.
- security()/HTF: Not used, so no higher-timeframe repaint risks; all computations stay in the chart's resolution.
- Resources: Relies on a fixed-size array of seven elements and small loops for sorting and table fills, capped at 5000 bars back—efficient for most charts but may slow on very long intraday histories.
- Known limits: Ignores weekends and holidays implicitly via data presence; early chart bars lack full percentile context, leading to initial undercounting; assumes continuous sessions, so gaps in data (e.g., news halts) skew totals.
Sensible Defaults & Quick Tuning
Start with the built-in values for broad-market daily charts: ATR at 14, window at 252, threshold at 10. For noisier environments, lower the threshold to 5 and shorten the window to 100 to prioritize rare squeezes. If too few events appear, raise the threshold to 15 and extend ATR to 20 for broader capture. To combat overcounting in sparse data, widen the window to 500 while keeping others stock—monitor the info label's data-days count before trusting patterns.
What this indicator is—and isn’t
This serves as a statistical overlay for spotting calendar-based volatility biases, aiding in session selection and filter design. It is not a standalone signal generator, predictive model, or risk manager—integrate it with price action, volume, and broader strategy rules for decisions.
Disclaimer
The content provided, including all code and materials, is strictly for educational and informational purposes only. It is not intended as, and should not be interpreted as, financial advice, a recommendation to buy or sell any financial instrument, or an offer of any financial product or service. All strategies, tools, and examples discussed are provided for illustrative purposes to demonstrate coding techniques and the functionality of Pine Script within a trading context.
Any results from strategies or tools provided are hypothetical, and past performance is not indicative of future results. Trading and investing involve high risk, including the potential loss of principal, and may not be suitable for all individuals. Before making any trading decisions, please consult with a qualified financial professional to understand the risks involved.
By using this script, you acknowledge and agree that any trading decisions are made solely at your discretion and risk.
Do not use this indicator on Heikin-Ashi, Renko, Kagi, Point-and-Figure, or Range charts, as these chart types can produce unrealistic results for signal markers and alerts.
Best regards and happy trading
Chervolino

Opening Range BoxThis indicator, called the "Opening Range Box," is a visual tool that helps you track the start of key trading sessions like London and New York.
It does three main things:
Finds the Daily 'First Move': It automatically calculates the High and Low reached during the first 30 minutes (or whatever time you set) of each defined session.
Draws a Box: It immediately draws a colored, transparent box on your chart from the moment the session starts. This box acts as a clear reference for the session's initial boundaries.
Extends the Levels: After the initial 30 minutes are over, the box stops growing vertically (it locks in the OR High/Low) but continues to stretch out horizontally for the rest of the trading session. This allows you to easily see how the price reacts to the opening levels throughout the day.
In short: It visually highlights the most important price levels established at the very beginning of the major market sessions.
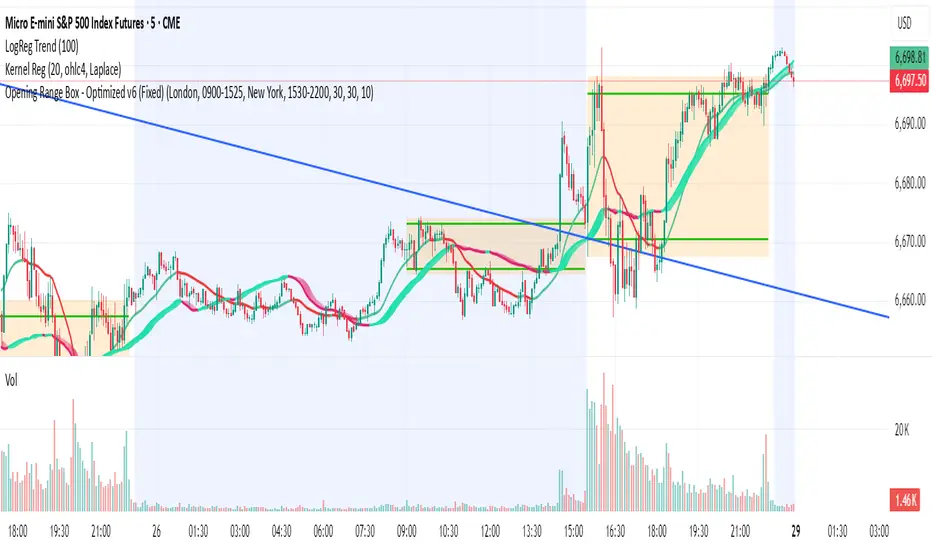
Gold Power Hours Strategy📈 Gold Power Hours Trading Strategy
Trade XAUUSD (Gold) or XAUEUR during the most volatile hours of the New York session, using momentum and trend confirmation, with session-specific risk/reward profiles.
✅ Strategy Rules
🕒 Valid Trading Times ("Power Hours"):
Trades are only taken during high-probability time windows on Tuesdays, Wednesdays, and Thursdays , corresponding to key New York session activity:
Morning Session:
08:00 – 11:00 (NY time)
Afternoon Session:
12:30 – 16:00
19:00 – 22:00
These times align with institutional activity and economic news releases.
📊 Technical Indicators Used:
50-period Simple Moving Average (SMA50):
Identifies the dominant market trend.
14-period Relative Strength Index (RSI):
Measures market momentum with session-adjusted thresholds.
🟩 Buy Signal Criteria:
Price is above the 50-period SMA (bullish trend)
RSI is greater than:
60 during Morning Session
55 during Afternoon Session
Must be during a valid day (Tue–Thu) and Power Hour session
🟥 Sell Signal Criteria:
Price is below the 50-period SMA (bearish trend)
RSI is less than:
40 during Morning Session
45 during Afternoon Session
Must be during a valid day and Power Hour session
🎯 Trade Management Rules:
Morning Session (08:00–11:00)
Stop Loss (SL): 50 pips
Take Profit (TP): 150 pips
Risk–Reward Ratio: 1:3
Afternoon Session (12:30–16:00 & 19:00–22:00)
Stop Loss (SL): 50 pips
Take Profit (TP): up to 100 pips
Risk–Reward Ratio: up to 1:2
⚠️ TP is slightly reduced in the afternoon due to typically lower volatility compared to the morning session.
📺 Visuals & Alerts:
Buy signals: Green triangle plotted below the bar
Sell signals: Red triangle plotted above the bar
SMA50 line: Orange
Valid session background: Light pink
Alerts: Automatic alerts for buy/sell signals
