Sessions Indicator [CodeDNL]A sessions indicator that doesn't cover the whole trading screen, and continues into the future.
Made to be easier on the eyes than existing solutions.
Cari dalam skrip untuk "session"

Session Open PricelinesSimple Indicator which shows 5 customizeable Lines for the sessions opening price.
I use it with New York Timezone.
You can easily modify the code for the time, you can also add more sessions to it.
I am no coder and have no idea why the indicator is showing all lines just under m10. I use it with m1 and m3 most of the time.
If you know the answer, it would be so cool if you could write me to modify it and make it work in all timeframes.

Sessions High & LowA tool to save time while trading Forex for example.
Ability to turn on/off up to 4 sessions with user defined range
Separate alerts for a new high/low for each session

Session RangeSimple script for showing the high/low/midrange of a session. By default configured to do the Daily range using the "regular" session. But it's configurable. For example on this chart I am showing the Weekly range.

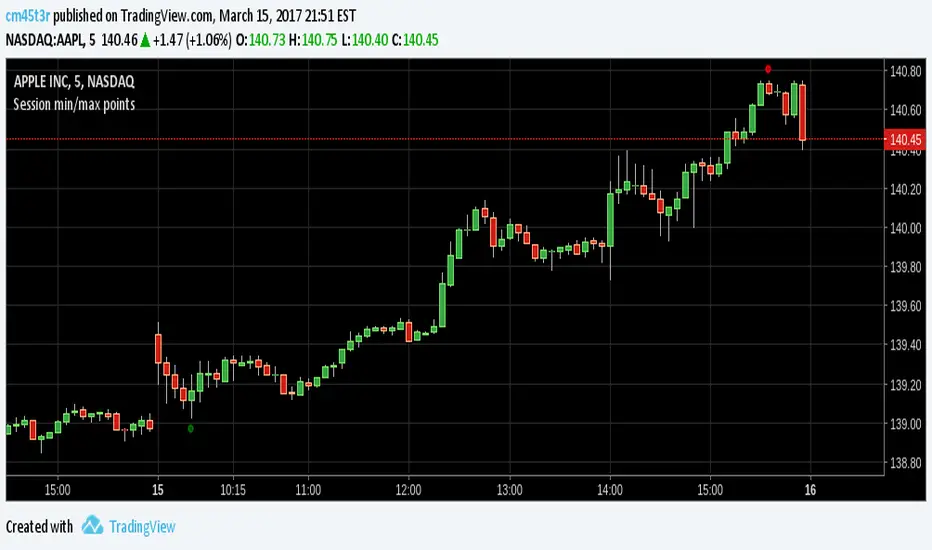
Session min/max pointsMinimum and maximum points in a day trading session. It may help you spot the range which min and max occur in a session.
In day trading, for example, at securities like GBPNZD, minimum happens between 02:00-05:00 ET and maximum between 08:00-14:00 ET. This indicator can help you test this hypothesis.
Happy trading!
Session Opens - Asia, London, NY - VtrendThis script is designed to show the market session opens, for Asia, London and New York.
I couldn't find anything that fit my requirements so I decided to code one up!
You can either have symbols below, LO, AO and NYO - or background colors representing open times.. Or indeed both!
There are no alerts currently coded in, will update this one if i get enough requests.
Timeframe wise, works best under 1 hour, will not plot above that.
Also it does not plot the weekend open times.

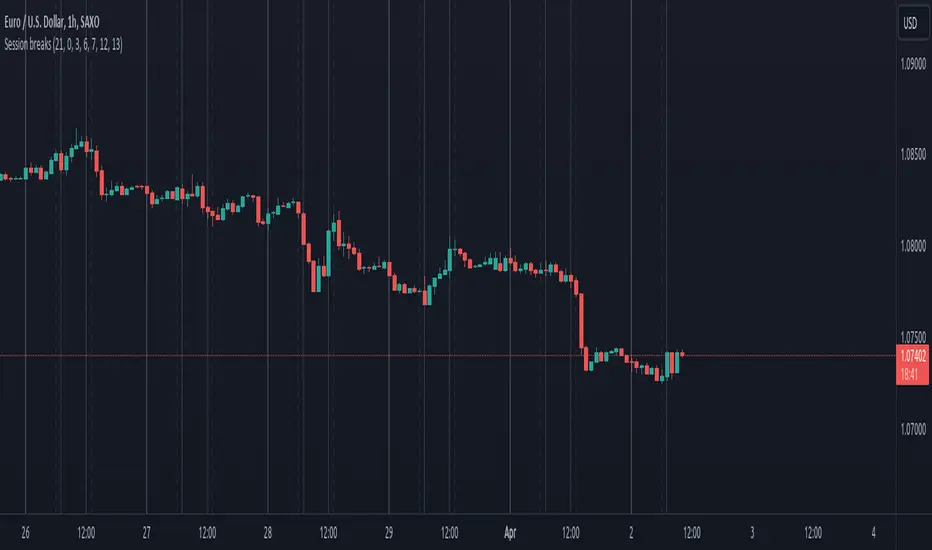
Session breaksThis indicator marks the start of each trading session around the world, starting with Tokyo at 0am UTC, London at 7am UTC, NY at 12pm and Sydney at 9pm, is non-intrusive (light gray vertical lines) and works with both UTC and exchanges' local time and handles DST / timezone offsets as well.
You can easily see that sometimes it acts as pivot-point especially on high volume.
And last, it is supposed to replace the "Session breaks" option that you can find in "Settings - Appearance" that only displays the end of session for the current exchange.
Session Swing High / Low Rays AUS USERS ONLY
marks the last week concurrent to the present day, the highs and lows of each session

Session H/L (Lumiere)This is the 2.0 version of ''Trading session High/Low''
Previous Day High & Low (PDH / PDL)
The script now draws:
PDH = previous day’s high
PDL = previous day’s low
They:
Are based on the daily timeframe (not your chart timeframe).
Look the same and sit in the same place on all timeframes.
Have their own color, width, and style in:
“Previous Day Levels” settings.
Clean PDH/PDL text instead of labels.
You can show/hide this text with: “Show PDH/PDL Text”
PDH/PDL also get dotted when swept.
Timezone handling is now flexible & DST-aware
Instead of a fixed "Etc/GMT+4" (which breaks during summer/winter time changes),
you now have a dropdown.

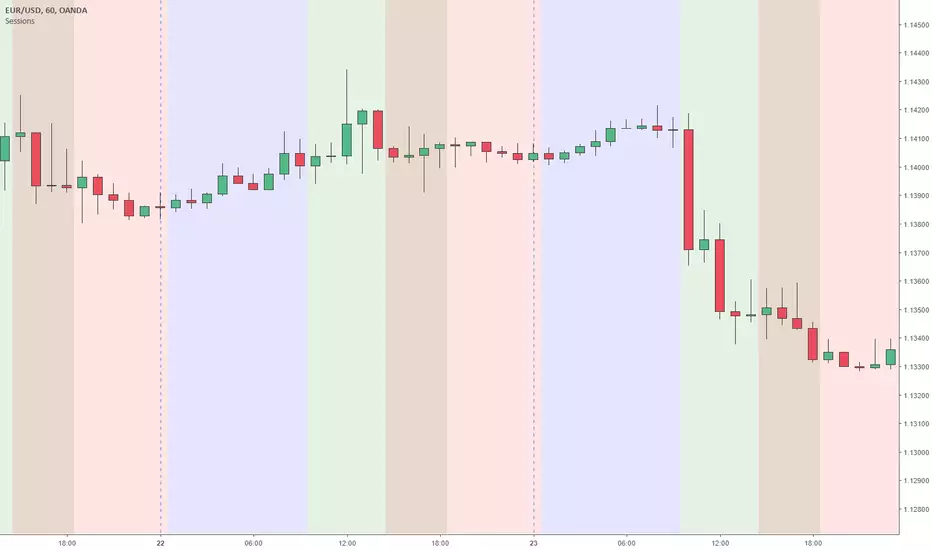
Sessions Asia, London, NY colored USED FOR GMT+2Simple script making easy to see when what session begins also overlaps and ends.
This script used for GMT+2 time zone, if you want to edit it just overite script time cycle.


Sessions (Nephew_Sam_)Indicator combines the 3;
1. 3 Sessions - with an option to set your own times
2. 4 Killzones- with an option to set your own times
3. Daily Dividers
If you dont want any of the the above or want to decrease your killzones, just uncheck the relevant checkbox under settings - inputs/colors.
Note: Most of this code it taken from other open source scripts, therefore I will leave this as an open source code too.

Session, Weekly, Daily LevelsScroll down for hungarian description!
Magyar leíráshoz görgess lejjebb!
Overview
This script provides a unified market structure mapping tool that automatically identifies and visualizes key intraday, daily, and weekly reference levels. It helps traders contextualize price action throughout the trading week by marking true session opens, previous day highs/lows, weekly highs/lows, and weekday opens, all with accurate historical anchoring and correct timezone handling.
What This Script Does
1. Intraday Session Opens (Tokyo, London, New York)
- Detects the exact candle where each session opens.
- Draws horizontal rays with labels.
- Automatically clears lines at the start of each new day.
- Uses a custom local-to-exchange timezone conversion system.
2. Weekly Levels
- Last week high and low (precise bar anchoring, not HTF aggregation)
- Current week open (also Monday open)
- Auto-reset on new week
- Levels are always drawn from the true candle where they formed.
3. Previous Day High & Low
- Continuously tracks intraday highs and lows.
- On a new day, stores yesterday’s values and anchors rays to the exact bars.
- Levels remain visible for the full current day and reset the next day.
4. Weekday Opens (Tue–Fri)
- Captures the exact opening price of Tuesday–Friday.
- Monday open = Week open, so it is not shown separately.
- Auto-reset on new week.
Timezone Logic (Original Feature)
The script converts:
local session times → exchange timezone → chart timestamps
It works correctly regardless of chart timezone or instrument exchange location.
Line Drawing Logic
- Finds the exact bar_index where each level forms.
- Draws rays extending to the right.
- Labels are placed ahead of price.
- Safe updating prevents “bar index too far” errors.
How to Use
- Identify daily/weekly structure.
- Track bias relative to session opens.
- Observe reactions around weekday opens.
- Compare price action to last week's range.
Originality
- Custom timezone conversion engine.
- True historical bar anchoring.
- Fully automated weekly/daily structural resets.
- Independent styling for each level type.
- Not a mashup; all components follow one unified logic.
Limitations
- Does not predict trend or direction.
- Structural tool only.
Summary
A precise and reliable market structure tool that unifies weekly, daily, and intraday reference levels with full timezone automation and true-candle anchoring.
MAGYAR LEÍRÁS
--------------
Áttekintés
Ez az indikátor egy összetett piaci szerkezet-feltérképező eszköz, amely automatikusan megjeleníti a legfontosabb intraday, napi és heti referenciaértékeket. A célja, hogy a kereskedő tisztán lássa a piac aktuális környezetét: hol nyíltak a főbb devizapiaci szekciók, hogyan alakult a tegnapi tartomány, hol volt a múlt heti csúcs/mélypont, és hogyan nyitottak az egyes hétköznapok.
Mit tud a script?
1. Szekciónyitások (Tokyo, London, New York)
- Megkeresi a pontos gyertyát, amely a szekciónyitáskori árat tartalmazza.
- Vízszintes vonalat és címkét rajzol.
- Minden nap elején automatikusan törli a korábbi nap szintjeit.
- Egyedi időzóna-konverziós rendszerrel működik (helyi idő → tőzsdei idő → chart idő).
2. Heti szintek
- Múlt heti maximum és minimum (pontos gyertyapontra horgonyozva)
- Aktuális heti nyitóár (egyben a hétfői nyitó is)
- Új hét kezdetekor automatikusan frissül.
- A múlt heti high/low nem fix időpontra, hanem a valódi gyertyára kerül.
3. Előző napi High és Low
- Folyamatosan követi a napi maximumot és minimumot.
- Napváltáskor elmenti és pontos gyertyáról indítja a ray-t.
- A szintek a teljes nap folyamán megmaradnak, majd a következő nap törlődnek.
4. Hétköznapok nyitóárai (Kedd–Péntek)
- A kedd, szerda, csütörtök és péntek nyitóárát rögzíti és megjeleníti.
- A hétfői nyitó a Week Open, ezért külön nem jelenik meg.
- Heti váltáskor automatikusan törlődnek.
Időzóna-kezelés (egyedi megoldás)
A script a felhasználó helyi idejét átszámítja az instrumentum tőzsdei időzónájára, majd a chartra vetíti.
Ez biztosítja, hogy minden szekciónyitás helyesen jelenik meg, bármely chart vagy instrumentum esetén.
Vonalrajzolási logika
- A szintek a valódi bar_index alapján kerülnek rögzítésre.
- Jobbra nyúló ray-eket rajzol.
- A címkék mindig a jobb oldalon, előre helyezve jelennek meg.
- Biztonságos frissítési rendszer akadályozza meg a hibákat (pl. “bar index too far”).
Használat
- Napi/heti szerkezet meghatározása.
- Bias követése a session openekhez viszonyítva.
- Reakciók figyelése a hétköznapok nyitóárai körül.
- Összevetés a múlt heti tartománnyal.
Eredetiség
- Egyedi időzóna-kezelő motor.
- Igazi gyertyapont-alapú horgonyzás.
- Automatikus napi/heti reset.
- Minden szint külön stílusban konfigurálható.
- Nem mashup; egységes rendszer.
Összegzés
Professzionális, pontos eszköz a piaci szerkezet feltérképezésére, amely egyesíti a heti, napi és intraday szinteket, teljes időzóna-automatizálással és gyertyapontra horgonyzott kijelölésekkel.

Session Close/OpenThis indicator allows traders to mark and track two custom session times throughout each trading day, with flexible time zone and price source configuration.
Features:
Two configurable timestamps (e.g., session open and close) with adjustable hour and minute inputs.
Choose between multiple time zones: UTC-4 = New York
Mark the price at each selected time using either open, close, high, low, or any other price source.
Tracks and plots both current session and previous session values for each time point.
Visual markers appear as colored circles on the chart for clarity.
Built-in alert conditions when the live price touches either the current or previous session levels.
Use Cases:
- Monitor price reactions at key session opens or closes.
- Set alerts for breakouts or touches at specific time-based levels.
- Combine with other strategies to enhance time-based decision making.
- Perfect for intraday traders who want precise control over session-based reference points.

Session Range and Breakout Summary
This script presents the session range and post session movements relative to that range of all the majors and crosses on a single page. You can also set it to a daily range and weekly range (beta). It will even show you the pip value of the range. I made the indicator to easily stay on top of market movements at london open relative to the Asia session range. Its very easy to see which entire currency group is breaking its asia range WHIST ITS HAPPENING. Focus on NZD in the examples as it was the market lead today - I was able to get some of it when I saw the entire group breaking its range
Showing all the majors and crosses relative to the Asia range (00:00 - 07:00 GMT)
Active 'show on chart' to verify the indicator is measuring the range correctly. Compare below to the NZD box above - you can see how NZD had control of the market this morning and all NZD pairs broke out of their ranges.
'PIP MODE' - active pip mode to see what the pip range was of the session
Notes
The information is presented RELATIVELY - this means that all the ranges and movements are scaled to be the same size. You are therefore seeing the movements relative to their ranges. When you see a breakout it relative to the size of the range - for example, if GBPJPY had a range of 50pips and breaks out of the range by 100 pip and GBPEUR has a range of 20 pips and breaks out by 40 pips they have both broken out double the range and will be displayed as the same distance.
The indicator will show the movements whilst the range is forming. I did this so I can see what the groups are doing before Europe open and be ready - such as lingering at the top end of its INCOMPLETE asia range. Be aware through that if the lines are flat at the top of the range WHILST THE RANGE IS STILL FORMING this does not mean price was flat, it means that price was pushing up and growing the range. (Price can't breakout until the range has formed at the end of the session)
The currency pairs are organised to show the strength or weakness of the selected group - this means that the base currency is always the select group. This is to present the data with currencies moving in the same direction rather than some reversed but meaning the same in relation to currency strength. In the NZD example:
NZDAUD (not AUDNZD )
NZDCAD
NZDCHF
NZDEUR (not EURNZD )
NZDGBP (not GBPNZD )
NZDJPY
NZDUSD
I hope its useful. This is the most powerful indicator I've managed to write yet. It was difficult to make the code efficient enough to fit into the pinescript limit and still do everything.

session min/max support&resistance [LM]Hello traders,
I would like to present you session min/max support&resistance indicator. The idea behind is to calculate min and max per session and render line at those levels and bars until the price reach the level. With this you can see levels where the price didn't reach with granular control over how many lines can be shown.
Indicator has following settings:
General control - where you can select session interval and show/hide labels
Line control - where you can adjust type of line, color of up/bottom level..
I hope you will enjoy it,
Lukas


Session Volume Profile v1.0This script is a continuous Real Time Session Based (1D) Volume Profile . It emulates TV's built in Volume Profile Session Volume function.
It looks at the real time volume for a given session (1 day) and updates the following three elements for that day in real time:
Point of Control ( POC )
Value Area High ( VAH )
Value Area Low ( VAL )
There are 2 standard parameters:
Number of Bins/Rows : The granularity of the volume profile, the higher the number the more precise the calculations will be but will load slower, ideal is 16/32.
Percent for Value Area : Percent of total volume traded that you would like to be shown as a fill around the POC (maximum volume bin/row)
There are also 2 non standard parameters:
Checkbox for slower loading but more precise Value Area Calculation, checked = enabled, unchecked = disabled
Checkbox for more volatile symbols, check this if the price action is outside of the white dotted lines, default is disabled, checked = enabled, unchecked = disabled
POC: White Stepline
Value Area High: Highest Blue Line marking the top of the fill (Value Area)
Value Area Low: Lowest White Line marking the bottom of the fill
Please pm me if you are interested in trying this script out; I am also available for hire to work on custom scripts. Ty

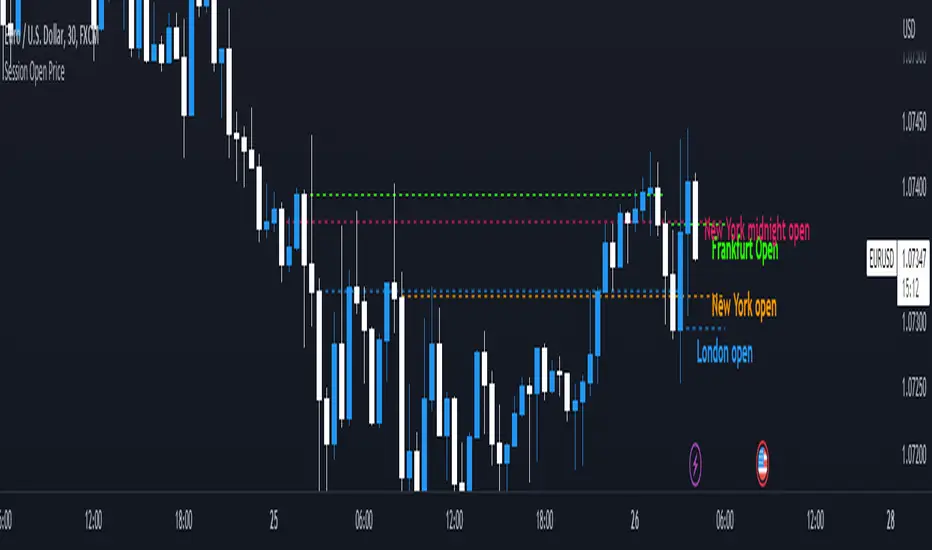
Session Open PriceThis Indicator displays the ICT kill zones' open price
You will be able to see the following open prices (ALL TIMES ARE IN NEW YORK TIME)
All times and appearances are customisable to your own liking.
The default time setting is recommended
- 00:00 AM Midnight New York Open Price (RED DASH LINE)
- 2:00 AM Frankfurt Open Price (GREEN DASH LINE)
- 3:00 AM London Open Price (BLUE DASH LINE)
- 8:30 AM New York Open Price (ORANGE DASH LINE)
HOW TO USE SESSION OPEN PRICE IN YOUR TRADING
If the price is above the opening price you only look for sells whereas if the price is under the opening price you only look for buys
BUY EXAMPLE
Wait for Midnight New York and Frankfurt open price to display
The price must be under both prices
Look for a Market maker buy model or your own entry model
Stoploss will be at the swing low and Take profit can be a fixed RR or how you calculate your take profit level
Session LevelsThis indicator plots important session (intraday) levels for the day. It plots high and low of previous day, week, month, 52 week and all time. Also plots the vix range which shows the daily expected trading range of the instrument. These levels acts as important support/resistance for the day.
For example, if price closes above previous day, week, or month high/low it indicates bullish sentiment and vice versa for bearish.
Vix Range plots top, center, bottom line for expected trading range for the day. It is calculated based on the volatility index selected (NSE:India VIX is used by default).


Session Sessions including New York opening at 1:00PM (GMT) and London opening at 08:00AM (GMT)
it also includes pre london session (7AM TO 9AM (GMT) and pre new york session 12 TO 2PM (GMT)
adjusted Other session indicator to my own script!
