Chart Box Session Indicator [The Quant Science]This indicator allows highlighting specific time sessions within a chart by creating colored boxes to represent the price range of the selected session. Is an advanced and flexible tool for chart segmenting trading sessions. Thanks to its extensive customization options and advanced visualization features, it allows traders to gain a clear representation of key market areas based on chosen time intervals.
The indicator offers two range calculation modes:
Body to Body: considers the range between the opening and closing price.
Wick to Wick: considers the range between the session's low and high.
Body To Body
Wick to Wick
Key Features
1. Session Configuration
- Users can select the time range of the session of interest.
- Option to choose the day of the week for the calculation.
- Supports UTC timezone selection to correctly align data.
2. Customizable Visualization
- Option to display session price lines.
- Ability to show a central price line.
- Extension of session lines beyond the specified duration.
3. Design Display Configuration
- Three different background configurations to suit light and dark themes.
- Two gradient modes for session coloring:
- Centered: the color is evenly distributed.
- Off-Centered: the gradient is asymmetrical.
How It Works
The indicator determines whether the current time falls within the selected session, creating a colored box that highlights the corresponding price range. Depending on user preferences, the indicator draws horizontal lines at the minimum and maximum price levels and, optionally, a central line.
During the session:
- The lowest and highest session prices are dynamically updated.
- The range is divided into 10 bands to create a gradient effect.
- A colored box is generated to visually highlight the chosen session.
If the Extend Lines option is enabled, price lines continue even after the session ends, keeping the range visible for further analysis.
This indicator is useful for traders who want to analyze price behavior in specific timeframes. It is particularly beneficial for strategies based on market sessions (e.g., London or New York open) or for identifying accumulation and distribution zones.
Cari dalam skrip untuk "session"

ICT KillZones Hunt [TradingFinder] 4 Sessions + OB + FVG + Alert🔵 Introduction
🟣 ICT
The "ICT" style is a subset of "Price Action" technical analysis. The primary goal of the ICT trading strategy is to merge "Price Action" with the "Smart Money" concept to pinpoint optimal trade entry points.
However, this approach's strength extends beyond merely finding entry points. It also helps traders gain a deeper understanding of price behavior and adapt their trading strategies to the market structure.
The most important concepts of "ICT" :
Order Block
Fair Value Gap(FVG)
Liquidity
🟣 Session
Financial markets are divided into several time periods, each featuring distinct characteristics and levels of activity. These periods, known as sessions, are active at different times during the day.
The primary active sessions in financial markets include :
Asian Session
European Session
New York Session
Based on the UTC time zone, the schedule for these key sessions is :
Asian Session: 23:00 to 06:00
European Session: 07:00 to 16:30
New York Session: 13:00 to 22:00
Note
To avoid session overlap and minimize interference during kill zones, the session times have been modified as follows :
Asian Session: 23:00 to 06:00
European Session: 07:00 to 14:25
New York Session: 14:30 to 22:55
🟣 KillZone
Kill zones are periods within a session where trader activity spikes. During these times, trading volume surges, and price movements become more pronounced.
The major kill zones, according to the UTC time zone, are as follows :
Asian Kill Zone: 23:00 to 03:55
European Kill Zone: 07:00 to 09:55
New York Morning Kill Zone: 14:30 to 16:55
New York Evening Kill Zone: 19:30 to 20:55
🔵 How to Use
🟣 Order Block
Order blocks are a distinct category of "Supply and Demand" zones, formed when a series of orders are grouped together. These blocks are often created by banks or other significant market participants.
Banks typically execute large orders in blocks during their trading sessions. If they were to enter the market with small quantities, substantial price movements would occur before the orders were fully executed, reducing potential profit.
To mitigate this, they divide their orders into smaller, more manageable positions. Traders should seek "buy" opportunities in "demand order blocks" and "sell" opportunities in "supply order blocks."
🟣 Fair Value Gap (FVG)
To pinpoint the "Fair Value Gap" on the chart, meticulous candle-by-candle analysis is essential. Pay close attention to candles with significant bodies, examining each candle alongside the one preceding it.
The candles flanking this central candle should exhibit elongated shadows, with bodies that do not intersect the body of the central candle. The span between the shadows of the first and third candles is referred to as the FVG range.
Note :
The origin of all Order Blocks and FVGs starts from inside a kill zone and extends up to the end of the same session.
🟣 Kill Zone Hunt
Following this strategy, after the conclusion of the kill zone and the stabilization of its high and low lines, if the price touches either of these lines within the same session and encounters a robust rejection, it presents an opportunity to enter a trade.
🔵 Setting
🟣 Global Setting
Show All Order Block :
If it is turned off, only the last Order Block will be displayed.
Show All FVG :
If it is turned off, only the last FVG will be displayed.
Show More Info Session :
If it is turned on, more information about kill zones (Trade Volume, Time, Number of Candles) will be displayed.
🟣 Logic Parameter
Pivot Period of Order Blocks Detector :
Enter the desired pivot period to identify the Order Block.
Order Block Validity Period (Bar) :
You can specify the maximum time the Order Block remains valid based on the number of candles from the origin.
Mitigation Level Order Block :
Determining the basic level of a block order. When the price hits the basic level, the order block due to mitigation.
🟣 Order Blocks Display
Demand Order Block :
Show or not show and specify color.
Supply order Block :
Show or not show and specify color.
🟣 Order Block Refinement
Refine Demand OB :
Enable or disable the refinement feature. Mode selection.
Refine Supply OB :
Enable or disable the refinement feature. Mode selection.
🟣 FVG
FVG Validity Period (Bar) :
You can specify the maximum time the FVG remains valid based on the number of candles from the origin.
Mitigation Level FVG :
Determining the basic level of a FVG. When the price hits the basic level, the FVG due to mitigation.
Show Demand FVG :
Show or not show and specify color.
Show Supply FVG :
Show or not show and specify color.
FVG Filter :
Enable or disable filtering of FVGs. Select filter mode.
🟣 Session
Show More Info Session Color
Asia Session, London Sesseion, New York am Session & New York pm Session :
Show or not show session and kill zones. Change the display color.
🟣 Alert
Send Alert When Touched Session high & Low :
On / Off
Alert Demand OB Mitigation :
On / Off
Alert Supply OB Mitigation :
On / Off
Alert Demand FVG Mitigation :
On / Off
Alert Supply FVG Mitigation :
On / Off
Message Frequency :
This string parameter defines the announcement frequency. Choices include: "All" (activates the alert every time the function is called), "Once Per Bar" (activates the alert only on the first call within the bar), and "Once Per Bar Close" (the alert is activated only by a call at the last script execution of the real-time bar upon closing). The default setting is "Once per Bar".
Show Alert Time by Time Zone :
The date, hour, and minute you receive in alert messages can be based on any time zone you choose. For example, if you want New York time, you should enter "UTC-4". This input is set to the time zone "UTC" by default.
Display More Info :
Displays information about the price range of the order blocks (Zone Price) and the date, hour, and minute under "Display More Info". If you do not want this information to appear in the received message along with the alert, you should set it to "Off".

Quantura - Session High/LowIntroduction
“Quantura – Session High/Low” is a professional-grade session mapping indicator that automatically identifies and visualizes the highs, lows, and ranges of key global trading sessions — London, New York, and Asia. It helps traders understand when and where liquidity tends to accumulate, allowing for better market structure analysis and session-based strategy alignment.
Originality & Value
This indicator unifies the three most influential global sessions into a single, adaptive visualization tool. Unlike typical session indicators, it dynamically updates live session highs and lows in real time while marking session boundaries and transitions. Its multi-session management system allows for immediate recognition of overlapping liquidity zones — a crucial feature for institutional and intraday traders.
The value and originality come from:
Real-time tracking of session highs, lows, and developing ranges.
Simultaneous visualization of multiple global sessions.
Optional vertical range lines for clearer visual segmentation.
Customizable session times, colors, and time zone offset for global accuracy.
Automatically extending and updating lines as each session progresses.
Functionality & Core Logic
Detects the start and end of each trading session (London, New York, Asia) using built-in time logic and user-defined UTC offsets.
Initializes session-specific high and low variables at the start of each new session.
Continuously updates session high/low levels as new candles form.
Draws color-coded horizontal lines for each session’s high and low.
Optionally adds vertical dotted lines to visually connect session range extremes.
Locks each session’s range once it ends, preserving historical structure for review.
Parameters & Customization
New York Session: Enable/disable, customize time (default 15:30–21:30), and set color.
London Session: Enable/disable, customize time (default 09:00–16:30), and set color.
Asia Session: Enable/disable, customize time (default 02:30–08:00), and set color.
Vertical Line: Toggle dotted vertical lines connecting session high and low levels.
UTC Offset: Adjust session timing to align with your chart’s local time zone.
Visualization & Display
Each session is color-coded for quick identification (default: blue for London, red for New York, green for Asia).
Horizontal lines track evolving session highs and lows in real time.
Once a session closes, the lines remain fixed to mark historical range boundaries.
Vertical dotted lines (optional) visually connect the session’s high and low for clarity.
Supports full overlay display without interfering with other technical indicators.
Use Cases
Identify liquidity zones and range extremes formed during active trading sessions.
Observe session overlaps (London–New York) to anticipate volatility spikes.
Combine with volume or market structure tools for session-based confluence.
Track how price interacts with prior session highs/lows to detect potential reversals.
Analyze session-specific performance patterns for algorithmic or discretionary systems.
Limitations & Recommendations
The indicator is designed for intraday analysis and may not provide meaningful output on daily or higher timeframes.
Adjust session times and UTC offset based on your broker’s or exchange’s timezone.
Does not provide trading signals — it visualizes session structure only.
Combine with liquidity and volatility indicators for full contextual understanding.
Markets & Timeframes
Compatible with all asset classes — including crypto, forex, indices, and commodities — and optimized for intraday timeframes (1m–4h). Particularly useful for traders analyzing session overlaps and volatility transitions.
Author & Access
Developed 100% by Quantura. Published as a Open-source script indicator. Access is free.
Compliance Note
This description fully complies with TradingView’s Script Publishing Rules and House Rules . It provides a detailed explanation of functionality, parameters, and realistic use cases without making any performance or predictive claims.

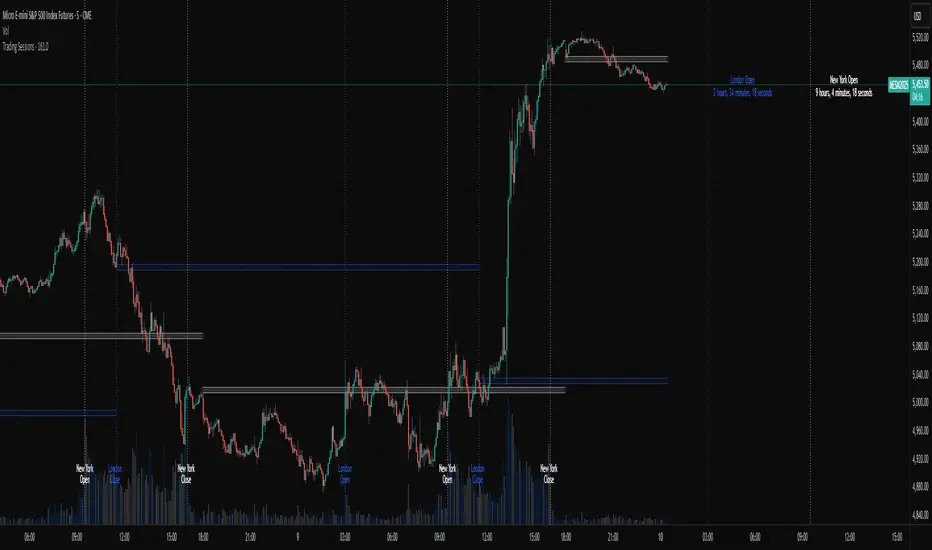
Trading SessionsThis indicator has the following base features:
Plots the session breaks of the Tokyo, London, and New York trading hours.
Plots the lunch break locations of the Tokyo session.
Plots the previous closes at the end of the Tokyo, London, and New York sessions. The New York previous close can optionally use the settlement close value from the exchange.
Plots a countdown and time location of the next session open and close for the Tokyo, London, and New York sessions.
By default, all sessions are prescribed in their local time zone. Daylight savings time is also accounted for. This makes the plots operate as expected no matter what your own local time zone setting is in Trading View.
goose's session + killzone indicatorA powerful, multi-functional TradingView script designed for forex traders. It visually delineates major market sessions—Asia, London, and New York—on the chart, provides customizable session ranges, pip range counters, and configurable “killzone” markers. The indicator allows users to switch between a traditional line-and-fill style and a historical box style for session visualization, offering both real-time and historical context of market ranges.
Key Features:
1. Session Visualization Options:
• Lines & Fill Style:
• Highlights active sessions using dynamic lines and filled areas that update in real-time.
• Displays session high, low, and mid-range boundaries with customizable colors, border widths, and line styles.
• Historical Boxes Style:
• Creates and retains boxes for each past session, enabling users to review historical session ranges over extended periods.
• Each session box is drawn with user-defined fill and border colors, opacity, and line styles, anchored to the session’s high, low, and timeframe.
• Supports viewing multiple historical sessions at once, up to a configurable limit.
2. Pip Range Counters:
• Displays the range of pips for each active session, anchored to a fixed position near the bottom-right corner of the session.
• Uses arrow-style labels (label.style_label_up/down) to maintain a stable visual offset relative to the session, minimizing movement during vertical zoom.
• Customizable text size, color, and vertical offset, ensuring the pip counter remains legible and unobtrusive.
3. Killzone Lines:
• Allows users to define up to 15 custom “killzone” times with specific line colors, styles, and optional labels.
• Each killzone is drawn precisely when the price crosses the user-specified time, marking important market events or transitions.
4. User Configurations:
• Session Times: Fully adjustable start and end times for Asian, London, and New York sessions.
• Color & Style Settings:
• Customizable fill and border colors (with adjustable opacity) for each session style.
• User-friendly dropdowns and checkboxes for setting line styles, widths, and text sizes.
• Display Mode Selector:
• A dropdown (sessionStyle) lets users toggle between “Lines & Fill” and “Historical Boxes” for session visualization.
• Pip Counter and Killzone Settings:
• Options to show or hide pip counters, match label colors to session fills, and configure killzone appearance individually.
5. Robust Utility Functions:
• Functions to parse user-input times, determine if the current time falls within a session, and calculate session ranges.
• Historical session logic that detects session transitions and creates/upgrades boxes accordingly.
How It Works:
• Session Style Selection:
• Users choose their preferred visualization style via the sessionStyle dropdown.
• If “Lines & Fill” is selected, the indicator plots dynamic lines and fills during active sessions.
• If “Boxes” is selected, the indicator creates historical boxes that outline the range of each past session, persisting on the chart until session boundaries change.
• Pip Counter Labeling:
• During an active session, the pip counter calculates the range between the session’s high and low and displays it as text positioned just below the bottom-right corner of the session.
• The use of arrow-style labels ensures the text remains at a stable visual distance from the session’s outline, even when zooming vertically.
• Killzones:
• Users can define specific times (“killzones”) where important market events occur.
• When the price crosses these times, the script draws lines and optional labels with user-defined appearance settings.
Ideal Use Cases:
• Real-Time Trading: Quickly identify current session ranges, pip sizes, and crucial killzone markers during live trading.
• Historical Analysis: Switch to Historical Boxes to review past session ranges over days, weeks, or months, aiding in pattern recognition and strategy refinement.
• Customization: Tailor the appearance to match personal preferences or chart themes, including colors, styles, line widths, and label sizes.
This comprehensive indicator combines real-time session tracking with historical range visualization and customizable killzones. Its dual display modes, extensive settings, and stable pip counter labels make it a versatile tool for forex traders seeking to analyze market sessions both in the moment and retrospectively.

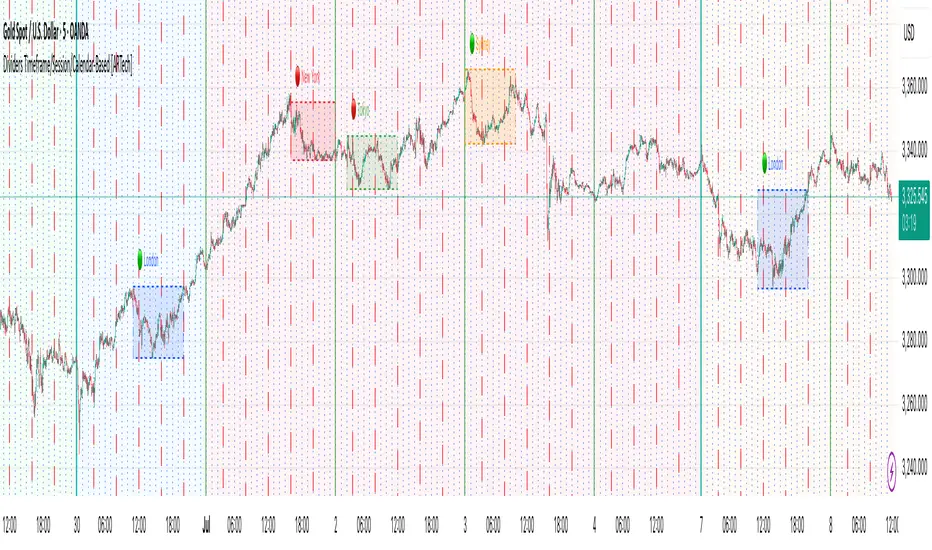
Dividers Timeframe/Session/Calendar-Based [ARTech]Dividers Timeframe/Session/Calendar-Based
This indicator provides customizable visual dividers for multiple timeframes, trading sessions, and calendar-based periods (daily, weekly, monthly). It helps traders visually separate chart areas by key time boundaries without cluttering the chart with price lines.
Key Features:
Multi-Timeframe Dividers: Select up to 4 timeframes (e.g., 60 min, 4 hours, daily, weekly) to display customizable lines marking the start of each timeframe’s candle.
Session Dividers: Define up to 4 trading sessions with user-defined time zones, colors, and active weekdays. The indicator highlights the session’s highest and lowest price range using a box, and compares the session’s opening and closing prices. Based on this comparison, it displays a green or red emoji to indicate bullish or bearish sessions, making it easy to identify session momentum visually.
Calendar-Based Dividers: Enable daily, weekly, or monthly background color zones, with individual toggles and color settings for each day, week, or month. Perfect for visually distinguishing trading periods.
Why use this indicator?
Divider Indicator helps keep your chart organized by visually segmenting timeframes, sessions, and calendar periods, aiding in better analysis of price action relative to important time boundaries.
How to Use
███████ Timezone ███████
A valid timezone name exactly as it appears in the chart’s lower-right corner (e.g. New York, London).
A valid UTC offset in ±H:MM or ±HH:MM format. Hours: 0–14 (zero-padded or not, e.g. +1:30, +01:30, -0:00). Minutes: Must be 00, 15, 30, or 45.
Examples;
UTC → ✅ Valid
Exchange → ✅ Valid
New York → ✅ Valid
London → ✅ Valid
Berlin → ✅ Valid
America/New York → ❌ Invalid. (Use "New York" instead)
+1:30 → ✅ Valid offset with single-digit hour
+01:30 → ✅ Valid offset with zero-padded hour
-05:00 → ✅ Valid negative offset
-0:00 → ✅ Valid zero offset
+1:1 → ❌ Invalid (minute must be 00, 15, 30, or 45)
+2:50 → ❌ Invalid (minute must be 00, 15, 30, or 45)
+15:00 → ❌ Invalid (hour must be 14 or below)
███████ Timeframe ███████
Use this section to display vertical divider lines at the opening of higher timeframe candles (e.g., 1H, 4H, Daily, Weekly). This helps visually separate price action according to larger market structures.
1. Enable a Timeframe:
Turn on one or more timeframes (e.g., 60, 240, D, W) by checking their respective toggle boxes.
2. Lines Mark Candle Opens:
Each active timeframe will draw a vertical line at the start of its candle , making it easier to align intraday moves with larger timeframe shifts.
3. Customize Line Style:
For each timeframe, you can individually set:
Line Style: Solid, dashed, or dotted.
Line Width: From 1 to 10 pixels.
Line Color: Pick any color to match your chart theme.
Opacity: Use transparent colors to avoid overwhelming the chart.
4. Use Multiple Timeframes Together:
You can enable multiple timeframe dividers simultaneously. To maintain clarity:
Use distinct colors for each timeframe.
Use thinner or dotted lines for lower timeframes and bolder lines for higher ones.
Match line style and color intensity to reflect timeframe importance. (e.g., a thick green solid line for Weekly, a thin gray dotted line for 1H)
5. Visual Tip:
These dividers are especially useful for identifying higher timeframe candle opens during intraday trading, spotting breaks above/below previous candle ranges, or aligning session-based strategies with higher timeframe trends.
███████ Session ███████
Use this section to visually highlight specific trading sessions (e.g., London, New York, Tokyo, Sydney) on your chart using time zones, session ranges, and optional weekday filters. This helps focus your analysis on active market hours.
1. Enable a Session:
Activate up to 4 separate trading sessions. Each session can be named (e.g., "London") and customized independently.
2. Set Session Time and Days:
Define session time using the hhmm-hhmm format. (e.g., 0800-1700)
Select which days of the week the session applies to (Sunday through Saturday)
Set your preferred time zone (UTC, Exchange, etc.) from the global settings.
3. Session Box Drawing:
For each active session, the indicator will:
Draw a background-colored box from the session’s start to end time.
Stretch the box to fit the highest and lowest price within that time window.
Draw an outline using customizable border style and width.
4. Session Labels and Directional Hints:
Optionally display the session’s name as a label.
The indicator compares the session’s opening and closing prices . Based on the result:
📈 Green emoji shows a bullish session (close >= open)
📉 Red emoji shows a bearish session (close < open)
5. Display Options:
Show all sessions, only the last session, or a specific number of previous sessions.
Customize label size, location (top/bottom), and whether it appears inside or outside the box.
Adjust background opacity to blend the sessions neatly into your chart.
6. Visual Tip:
Session boxes are particularly useful for:
Spotting repeated highs/lows during active trading hours.
Recognizing session-based breakouts or consolidations.
Comparing performance across different markets and time zones.
███████ Calendar-Based ███████
This section helps you visually segment your chart based on calendar periods: daily, weekly, and monthly. You can enable background color highlighting for individual days, weeks, or months to better track price movements within these time frames.
1. Enable Daily, Weekly, or Monthly Highlighting:
Toggle on the options for Daily, Weekly, and/or Monthly highlighting according to your needs.
2. Select Specific Days, Weeks, or Months:
For Daily, enable any combination of days (up to 7) to color-code.
For Weekly, enable up to 5 weeks per month to cover partial weeks.
For Monthly, enable up to 12 months with individual toggles and colors.
3. Customize Colors for Each Period:
Assign distinct colors to each day, week, or month for easy differentiation. Choose hues that stand out but avoid colors that are too close in tone for adjacent periods.
4. Background Opacity:
Adjust the opacity level of the background coloring to ensure it complements your chart without obscuring price data.
5. Handling Partial Weeks and Overlaps:
The weekly highlighting accounts for months that span 4 to 6 weeks by allowing toggles up to 5 weeks, including weeks that may partially overlap with previous or next months.
6. Visual Tip:
Calendar-based backgrounds are excellent for:
Quickly identifying price behavior within specific calendar units.
Comparing price action across days, weeks, or months.
Spotting seasonal trends or recurring patterns tied to calendar cycles.
Simple Sessions========== TLDR ==========
The "Simple Sessions" indicator plots vertical lines and labels at the open and close of the US (New York), Asia (Tokyo), and Europe (London), daily session. The existing session indicators I could find all changed the background color of the chart for the entire session or added extra information to the chart that cluttered up my view. This is meant to be a less noisy and easy to interpret indication that the session you trade has started or is ending.
========== Features ==========
- Show or hide vertical lines for session opens and closes
- Show or hide labels for session opens and closes
- Show or hide each session individually
- Show or hide just the session close indications
- Change the color used for each session open and close
- Change the labels text, size, and text color
========== Limitations ==========
The session start and end times are hard coded in for their time zones and can't be changed:
- US (New York) - 9:30 - 16:00
- Asia (Tokyo) - 9:00 - 15:00
- Europe (London) - 8:30 - 16:30
========== Use Cases ==========
- Easily see when each session started and ended without the chart being too noisy
- Make it easier to identify price action patterns and trade setups that may occur on the open of each session
=============================
If you'd like more features or options feel free to request them in the comments.
Forex Session Tracker [MacroGlide]Forex Session Tracker is a tool designed to track and visualize trading activity across the four key Forex market sessions: New York, London, Tokyo, and Sydney. The indicator helps traders see the time intervals of each session, their impact on price movements, and analyze volatility within these sessions.
Key Features:
• Session Visualization: The indicator highlights price ranges during the New York, London, Tokyo, and Sydney sessions using different colors, making data easier to visually interpret and analyze. Users can customize the color scheme for each session.
• Price Change Analysis: The indicator tracks the opening prices of each session and calculates the price changes by the session's close. This allows traders to assess market dynamics within each session and make informed trading decisions.
• Average Price Changes: The average price change for a specified number of sessions is calculated for each session, helping to identify trends and volatility levels.
• Time Zone Support: The indicator takes into account time zones, allowing users to adjust the display according to their location or use the market's time zone.
• Interactive Dashboard: The built-in dashboard shows the status of each session in real-time (active or inactive), recent price changes, and average changes, providing quick access to key information directly on the chart.
How to Use:
• Add the indicator to your chart and configure the displayed sessions according to your needs.
• Use color differentiation to easily identify active trading sessions and assess their impact on price movements.
• Monitor price changes in each session and analyze averages for a deeper understanding of market trends.
Methodology:
The indicator uses the time intervals of each trading session to calculate and display opening prices, price ranges, and price changes for the session. Based on this data, the Forex Session Tracker visualizes the session's high and low prices and calculates the average price change over the last several sessions. All data is displayed in real-time, considering the user's time zone settings or the market's time zone.
Originality and Usefulness:
Forex Session Tracker stands out for its ability to combine price change information from several key trading sessions into one indicator, providing traders with a simple and clear way to analyze market activity across different time zones.
Charts:
The indicator displays clean and clear charts, where each trading session is highlighted with its own color, making visual interpretation easier. The charts focus only on essential information for analysis: opening prices, session ranges, and price changes. The integrated dashboard provides quick access to key session metrics, such as activity status, recent price changes, and average values for the selected period. These features make the charts highly useful for rapid analysis and trading decision-making.
Enjoy the game!

Statistics: High & Low timings of custom session; 1yr historyGet statistics of the Session High and Session Low timings for any custom session; based on around 1yr of data.
//Purpose:
-To get data on the 'time of day' tendencies of an asset.
-Narrow in on a custom defined session and get statistics on that session.
//Notes:
-Input times are always in New York time (but changing the timezone after setting WILL adust both table stats and background highlight correctly.
-For particularly long sessions, make sure text size is set to 'tiny' (very long vertical table), or adjust table to display horizontally.
-You'll notice most assets show higher readings around NY equities open (9:30am NY time). Other assets will have 'hot-spots' at other times too.
-Timings represent the beginning of a 15m candle. i.e. reading for 15:45 represents a high occurring between 15:45 and 1600.
-Premium users should get 20k bars => around 1year's worth of data on a 15minute chart. Days of history is displayed in the top left corner of the table.
//Limitations
-only designed and working on 15minute timeframe (to gather a full year of meaningful/comparable % stats, need 15minute 'buckets' of time.
-sessions cannot cross through midnight, or start at midnight (00:15 is ok). 00:15 >> 23:45 is the max session length. On BTC, same applies but 01:00 instead of midnight (all in NY time).
-if your session crosses through 'dead time' (e.g. 17:00-18:00 S&P NY time); table will correctly omit these non-existent candles, but it will add on the missing hour before the start time.
//Cautionary note:
-Since markets are not uncommonly in a trending state when your defined session starts or ends, the high/low timings % readings for start and end of session may be misleadingly high. Try to look for unusually high readings that are not at the start/end of your session.
Wheat (ZW1!) 15min chart; Table displayed vertically:
Nasdaq (NQ1!) 15m chart; Table displayed horizontally and with smaller text to view a very long custom session:

Global Sessions & Kill Zones [jpkxyz]Global Sessions & ICT Kill Zones Indicator
Overview
The Global Sessions & ICT Kill Zones indicator is a comprehensive trading tool designed to help traders identify and visualize the most critical time periods in the 24-hour forex and futures markets. This indicator combines traditional trading session analysis with Inner Circle Trader (ICT) Kill Zone methodology, providing traders with a complete picture of when institutional activity and liquidity are at their peak.
Trading Theory & Foundation
Session-Based Trading
The forex market operates 24 hours a day across four major trading sessions: Sydney, Tokyo, London, and New York. Each session has distinct characteristics in terms of volatility, liquidity, and price behavior. Understanding these sessions is crucial because:
Volatility Patterns: Each session exhibits unique volatility profiles based on which markets are open and which institutional players are active
Liquidity Concentration: Major price movements tend to occur when multiple sessions overlap, as more market participants are active simultaneously
Market Structure: Session highs and lows often act as key support and resistance levels that price respects throughout the trading day
Time-Based Strategies: Many professional traders structure their strategies around specific sessions that align with their preferred instruments and trading style
ICT Kill Zones
The Inner Circle Trader (ICT) methodology emphasizes specific time windows called "Kill Zones" - periods when institutional algorithms and smart money are most active. These time windows represent optimal trading opportunities because:
Institutional Activity: Banks, hedge funds, and large institutions execute their orders during these predictable time windows
Algorithmic Trading: Many institutional algorithms are programmed to operate during these specific periods
Liquidity Sweeps: Kill Zones often feature stop hunts and liquidity grabs before directional moves
Higher Probability Setups: Price is more likely to respect technical levels and follow through on setups during these periods
The four ICT Kill Zones are:
Asian Kill Zone (00:00-03:00 UTC): Early Asian session institutional activity
London Kill Zone (07:00-10:00 UTC): London open and European institutional entry
New York Kill Zone (12:00-14:00 UTC): New York open and North American institutional entry
London Close Kill Zone (15:00-17:00 UTC): European session close and position squaring
What This Indicator Visualizes
Trading Session Boxes
The indicator draws high-to-low range boxes for each major trading session:
Sydney Session (21:00-06:00 UTC): Captures the Australian and early Asian trading activity
Tokyo Session (00:00-09:00 UTC): Represents the main Asian trading period
London Session (08:00-17:00 UTC): Covers the European trading hours
New York Session (13:00-22:00 UTC): Encompasses North American trading activity
Each session box displays:
The session's high and low price levels
Customizable colored borders and fills
Labels showing the exact high and low values
Real-time updates as price moves within the active session
Session Overlaps
The indicator automatically identifies and highlights all session overlaps with distinct colored boxes:
Sydney/Tokyo Overlap: Asian liquidity concentration
Tokyo/London Overlap: Asian-European transition period
London/New York Overlap: The most volatile period with maximum liquidity
Sydney/New York Overlap: Late US session into early Asian session
These overlaps are crucial because they represent periods of increased liquidity when multiple major markets are operating simultaneously, often leading to significant price movements and breakouts.
ICT Kill Zones
Kill Zones are displayed as vertical background highlights that span the entire chart height during their active periods:
Visual clarity: Semi-transparent colored backgrounds that don't obstruct price action
Label identification: Each Kill Zone is labeled at its start for easy recognition
Overlay capability: Kill Zones overlay on top of session boxes, allowing you to see both simultaneously
Independent control: Each Kill Zone can be toggled on/off individually
How Traders Can Use This Indicator
Entry Timing
Wait for Kill Zones: Use Kill Zones as your primary trading windows to increase the probability of institutional support for your trades
Session Boundaries: Look for breakouts or reversals at session open/close times when new participants enter the market
Overlap Periods: Focus on high-conviction setups during session overlaps when liquidity is highest
Support & Resistance
Session Highs/Lows: Previous session highs and lows often act as key support/resistance levels
Sweep Setups: Watch for price to sweep session highs/lows during Kill Zones, then reverse (liquidity grab)
Range Trading: Trade within session ranges during low-volatility periods, breakout during overlaps
Risk Management
Volatility Awareness: Adjust position sizing based on which session is active (London/NY overlap = highest volatility)
Stop Placement: Position stops outside of key session levels to avoid being caught in normal intraday ranges
Time-Based Exits: Consider exiting or tightening stops as sessions close and liquidity decreases
Strategy Development
Session-Specific Strategies: Develop different approaches for different sessions based on your instrument's behavior
Kill Zone Confirmation: Require setups to occur within Kill Zones for higher probability trades
Backtesting Framework: Use historical session and Kill Zone data to backtest time-based strategies
Full Customizability
Session Customization
Every aspect of each trading session can be customized:
Toggle Visibility: Show/hide any session independently
Time Adjustment: Modify start and end hours to match your broker's server time or personal preference
Color Schemes: Customize box colors and border colors for each session
Transparency: Adjust fill transparency to see price action clearly while maintaining visual reference
Kill Zone Customization
Complete control over ICT Kill Zone display:
Individual Toggles: Enable or disable each Kill Zone independently based on your trading style
Color Selection: Choose distinct colors for each Kill Zone (default: Green, Blue, Yellow, Red)
Transparency Control: All Kill Zones use 70% transparency by default, fully customizable
Label Display: Toggle Kill Zone labels on/off via the main label settings
Visual Preferences
Border Control: Toggle session box borders on/off for cleaner charts
Label Size: Choose from tiny, small, normal, large, huge, or auto-sizing for all labels
Label Colors: Customize label background and text colors to match your chart theme
Box Transparency: Set individual transparency levels for each session and overlap
Overlap Customization
All four session overlaps have independent color controls:
Sydney/Tokyo Overlap
Tokyo/London Overlap
London/New York Overlap
Sydney/New York Overlap
Technical Features
Midnight Handling
The indicator uses advanced hour-based detection that seamlessly handles sessions crossing midnight (like Sydney's 21:00-06:00 UTC timeframe) without breaking the visualization into separate boxes.
Real-Time Updates
Active Sessions: Boxes extend and update in real-time as price moves during active sessions
High/Low Tracking: Session highs and lows are continuously updated until the session closes
Kill Zone Detection: Background colors appear/disappear precisely at Kill Zone boundaries
Clean Chart Integration
Minimal Clutter: Only shows active and recently completed sessions
Overlay Friendly: Works seamlessly with other indicators and doesn't obstruct price action
Performance Optimized: Efficient code that doesn't slow down chart rendering
Ideal For
Forex Traders: Track the four major forex sessions and plan trades around overlaps
Futures Traders: Identify when specific futures markets have peak activity
ICT Students: Implement Inner Circle Trader concepts with visual Kill Zone references
Session Traders: Build strategies around specific session characteristics
Scalpers & Day Traders: Focus on high-liquidity periods for tighter spreads and better fills
Swing Traders: Use session levels as key support/resistance for multi-day trades
Best Practices
Start Simple: Enable only the sessions and Kill Zones relevant to your instruments
Color Code Strategically: Use colors that stand out on your chart theme but don't overwhelm
Combine with Price Action: Use session levels and Kill Zones as context, not as standalone signals
Match Your Timezone: Adjust session times if your broker uses non-UTC server time
Focus on Overlaps: Pay special attention to London/New York overlap for highest-probability setups
Journal Performance: Track which sessions and Kill Zones work best for your strategy
Conclusion
The Global Sessions & ICT Kill Zones indicator provides traders with institutional-grade time-based analysis in a highly customizable, visually clear format. By combining traditional session analysis with modern ICT Kill Zone theory, traders gain a comprehensive understanding of when markets are most likely to move and where key levels are established. Whether you're a scalper looking for the highest liquidity periods or a swing trader using session levels for support/resistance, this indicator adapts to your needs while keeping your charts clean and professional.
Trade smarter by trading when the market is most active and predictable.

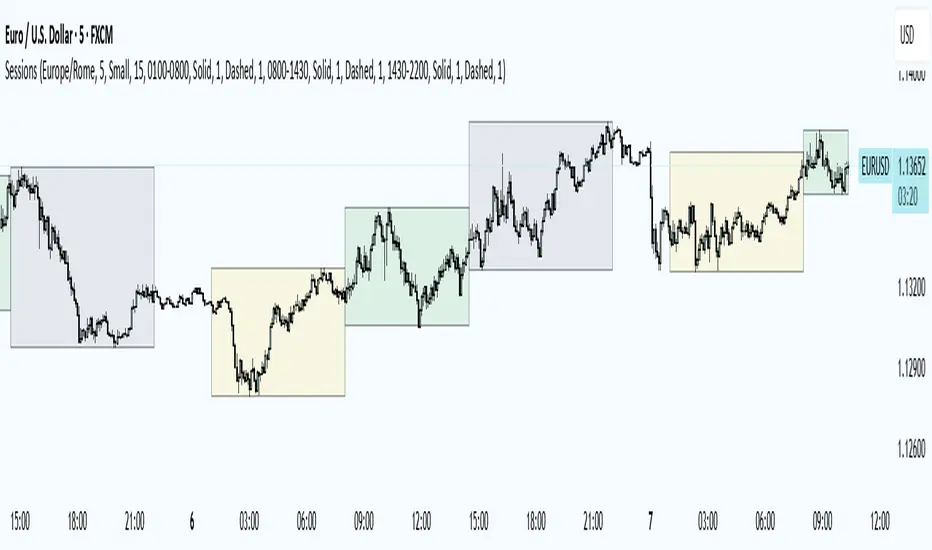
Trading Sessions
Trading Sessions
Highlights the Asia, London, and New York trading sessions with dynamic High-Low boxes.
General
Timezone : select your reference zone (e.g. Exchange, UTC, Europe/Rome, America/New_York).
Extend Session High/Low : extend the High/Low lines to the last candle.
Extend Lines (bars) : number of bars to extend lines beyond the last candle (0–100, default 15).
Show High/Low Labels : display labels for the High/Low levels.
Show Mitigated Levels : also show mitigated (broken) levels.
Show Only Recent Levels : filter levels from the last N days.
Number of Recent Days : sets how many days are considered “recent” (1–30).
Show Debug Info : enable a panel with current time, session status, and active filters.
Sessions
Asia , London , New York : enable or disable each session.
Session Time : set the start/end times with the time picker.
Box Color : choose a semi-transparent highlight color for each session.
Line Style & Width : customize style (Solid, Dotted, Dashed) and width of current and past High/Low lines.
Text Size : select the label text size (Tiny, Small, Normal, Large).
Show Only Recent Levels – filters High/Low lines to show only those from the last Number of Recent Days .
Number of Recent Days – sets how many days are considered “recent” for the filter.
Show Mitigated Levels – enables display of broken levels; otherwise only active levels remain visible.
Show High/Low Labels – toggles text labels at the ends of lines on or off.
Show Debug Info – displays a floating panel showing:
Current time in the selected timezone
On/Off status of Asia, London, NY sessions
Active filters (recent days, mitigated levels)
Line style settings for each session
Key Benefits
Visualize session-specific volatility and potential breakouts.
No historical limit: scroll back through any past sessions.
Filter and extend High/Low levels for precise price context.
Fully customize to fit any chart layout.
Ideal For
Intraday traders who need clear session boundaries and price level context.
VWAP Suite - Session (Free) - OptionsHUB🟦🟥🟩 OPTIONSHUB · VWAP PLAYBOOK
━━━━━━━━━━━━━━━━━━━━━━━━━━━━━━━━━━━━━━━━━━━
⭐ TradingView: OptionsHUB (follow + add to favorites — helps us ship updates faster)
🌐 Website: optionshub.pro (research, updates, ecosystem)
━━━━━━━━━━━━━━━━━━━━━━━━━━━━━━━━━━━━━━━━━━━
🚦 What This Indicator Is
VWAP Suite — Session (Free) is a clean Session VWAP module with:
🟦 Session VWAP
📏 Volume-weighted ±1σ / ±2σ bands
🎨 Optional band fill
Native note: for Anchored VWAP, interaction stats, HTF alignment, and regime context — see VWAP Suite (Pro) .
━━━━━━━━━━━━━━━━━━━━━━━━━━━━━━━━━━━━━━━━━━━
🧠 How It Works
· During each session, the script accumulates ΣV, Σ(V·Price), and Σ(V·Price²).
· VWAP = Σ(V·Price) / ΣV → the session’s volume‑weighted fair price.
· Variance = Σ(V·Price²)/ΣV − VWAP² → σ = √Variance.
· Bands are plotted as VWAP ±1σ and ±2σ to show typical vs extreme deviations.
━━━━━━━━━━━━━━━━━━━━━━━━━━━━━━━━━━━━━━━━━━━
🎛️ How to Read It
🟦 VWAP = session fair value / balance area (where volume traded most).
📏 σ bands = deviation zones around VWAP:
· ±1σ = normal working range (typical price rotation)
· ±2σ = extreme deviation (imbalance / mean‑reversion risk)
🧭 Context tips:
· Price above VWAP → buyers in control; below → sellers in control.
· Frequent VWAP crosses → balanced / choppy session.
· Holding outside ±1σ → stronger trend or expansion phase.
━━━━━━━━━━━━━━━━━━━━━━━━━━━━━━━━━━━━━━━━━━━
⚙️ Settings Explained
🧠 Source
Price source used for VWAP (default hlc3).
🕒 Session
Trading session window (e.g., 09:30-16:00).
Supports cross‑midnight sessions.
🌐 Timezone
Exchange → use the symbol’s exchange timezone.
UTC → fixed UTC session timing.
📊 Bands
Off → no bands.
±1σ → single standard‑deviation band.
±1σ & ±2σ → both band levels.
🧴 Fill Bands
On → shaded area between band lines.
Off → only lines.
🎨 VWAP Color
Color of the main VWAP line.
🟦 Band Color
Color of ±σ bands (also used for fills).
📏 Line Width
Thickness of the VWAP line (1–4).
🧾 Session Notice
Show session notice → enable/disable the “Outside trading session” label.
Notice position → choose where the table appears (top/bottom, left/right).
━━━━━━━━━━━━━━━━━━━━━━━━━━━━━━━━━━━━━━━━━━━
🧰 Quick Recommended Setups
US RTH (stocks/options)
· Session: 09:30–16:00
· Timezone: Exchange
· Bands: ±1σ & ±2σ
Why: Matches the official cash session so VWAP resets correctly each day.
Crypto 24/7
· Session: 00:00–23:59
· Timezone: UTC
· Bands: ±1σ
Why: Continuous market — one full‑day session with a single band keeps the chart clean.
━━━━━━━━━━━━━━━━━━━━━━━━━━━━━━━━━━━━━━━━━━━
⚠️ Limitations
· Intraday timeframes only
· No plots outside the session
· If volume is unavailable/zero → warning
━━━━━━━━━━━━━━━━━━━━━━━━━━━━━━━━━━━━━━━━━━━
🧬 About Pro Versions (What Comes Next)
In OptionsHUB Pro editions , this detector becomes a full regime engine:
📌 Anchored VWAP: Manual time anchor plus Pivot High/Low auto‑anchors.
📈 Session VWAP + Bands: Intraday VWAP with ±1σ / ±2σ and optional fills.
🧭 Regime Context: Trend / Mean‑Revert / Neutral with badge or background.
🤝 Interaction Stats: Touch / Reject / Hold / Fail metrics with compact table or tooltip.
🧩 HTF Alignment Dashboard: LTF vs HTF VWAP alignment status.
🏷️ Anchor Labels: Optional on‑chart labels for all AVWAP anchors.
🎨 Style Controls: Separate colors and widths for VWAP and AVWAPs.
⚠️ Smart Warnings: Intraday‑only, no‑volume, and out‑of‑range anchor alerts.
📌 The Free version gives you clarity and structure.
📌 Pro versions give you context, probability, and execution depth.
━━━━━━━━━━━━━━━━━━━━━━━━━━━━━━━━━━━━━━━━━━━
⚠️ Important Note
🧾 This indicator is a market context tool , not a signal generator.
It helps you choose the right type of strategy for the current market.
🚫 It is not financial advice.
🟦🟥🟩 OPTIONSHUB · REGIME PLAYBOOK
━━━━━━━━━━━━━━━━━━━━━━━━━━━━━━━━━━━━━━━━━━━
⭐ TradingView: OptionsHUB — following the profile helps us ship updates faster
🌐 Website: optionshub.pro — ecosystem, options, research, and advanced versions
━━━━━━━━━━━━━━━━━━━━━━━━━━━━━━━━━━━━━━━━━━━
OptionsHUB · Market Signal Engineering Lab

Sessions High/Low with Break LogicSessions High/Low with Break Logic – Indicator Description
Update 27.10.25
Overview
This indicator marks the highs and lows of key trading sessions (Tokyo, London, New York) and highlights when these levels are broken. It is ideal for traders using session-based strategies to monitor breakouts or support/resistance levels in real time.
Key Features
Session-Based Highs/Lows:
Tracks highs and lows for three trading sessions:
Tokyo: 02:00–09:00 (UTC+1)
London: 09:00–17:00 (UTC+1)
New York: 15:30–22:00 (UTC+1)
Break Logic:
Detects when the current price breaks a session high or low.
Labels are updated with a "Break" note when a level is breached.
Visual Display:
Draws horizontal lines for highs and lows of each session.
Adds labels with values (optionally including price).
Colors are customizable for each session:
Tokyo: Purple
London: Teal
New York: Orange
Customizable Settings:
Horizontal Offset: Shifts lines and labels horizontally for clarity.
Time Zone: Adjustable to UTC+1 (default).
Price Display: Option to show the exact price next to the label.
Settings and Translations
Display Settings
Horizontal Offset: Horizontal shift for lines and labels.
Show Price with Text: Displays the price next to the label (e.g., "London High: 123.45").
Time Settings
UTC: Time zone (default: UTC+1).
Session 1 (Tokyo)
Session 1: 02:00–09:00
High Text: "Tokyo High"
Low Text: "Tokyo Low"
High Color: Purple
Low Color: Purple
Session 2 (London)
Session 2: 09:00–17:00
High Text: "London High"
Low Text: "London Low"
High Color: Teal
Low Color: Teal
Session 3 (New York)
Session 3: 15:30–22:00
High Text: "New York High"
Low Text: "New York Low"
High Color: Orange
Low Color: Orange

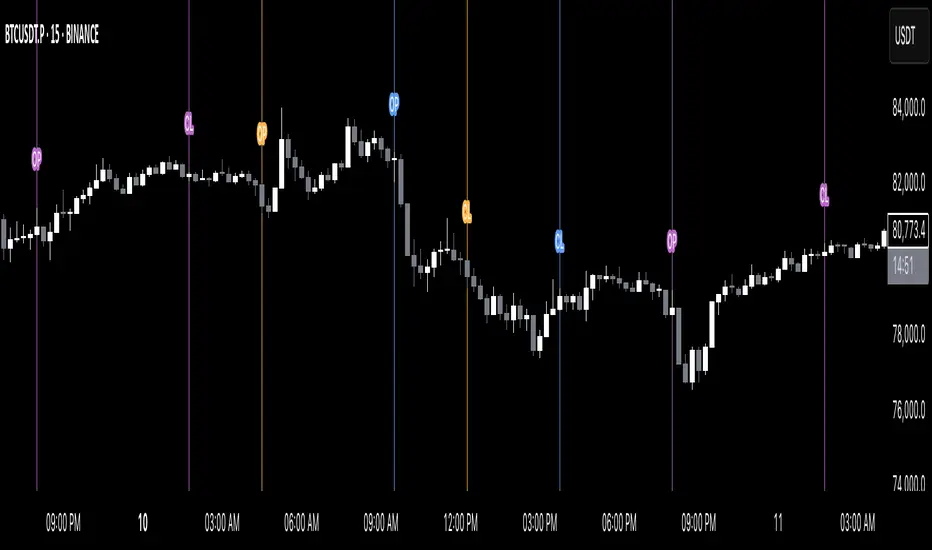
KillZones & Sessions [TradingFinder] Volume | Asia, London & NY🔵 Introduction
🟣 Session
The forex market operates 24 hours a day, 5 days a week, with only Saturdays and Sundays being off; traders often focus on one of the forex trading sessions instead of trying to trade in all markets 24 hours a day.
Trading sessions are time intervals during which a specific financial market is active and trades are conducted. The Asia, London, and New York sessions are the most important trading sessions throughout the 24-hour period, during which a significant amount of money and liquidity enters the market.
🟣 Kill Zone
Traders in financial markets profit from the difference between the price at which they buy or sell and the current market price. Traders have different time horizons for trading.
Among these, some traders engage in daily or even hourly trading and must operate during times when the market has desirable trading volumes and significant price movements.
Kill zones are segments of a session with higher trading volumes and price fluctuations compared to the rest of the session.
🔵 How to Use
🟣 Session Time
The "Asia Session" consists of two sessions: "Sydney" and "Tokyo." The beginning of this session, according to the "UTC" time zone, is at 23:00 and ends at 06:00. Similarly, the beginning of the "Asia KillZone," according to the "UTC" time zone, is at 23:00, and it ends at 03:55.
The "London Session" consists of two sessions: "Frankfurt" and "London." The beginning of this session, according to the "UTC" time zone, is at 07:00, and it ends at 14:25. Similarly, the beginning of the "London KillZone," according to the "UTC" time zone, is at 07:00, and it ends at 09:55.
The beginning of the "New York am" session, according to the "UTC" time zone, is at 14:30, and it ends at 19:25. Similarly, the beginning of the "New York am KillZone," according to the "UTC" time zone, is at 14:30, and it ends at 16:55.
The beginning of the "New York pm" session, according to the "UTC" time zone, is at 19:30, and it ends at 22:55. Similarly, the beginning of the "New York pm KillZone," according to the "UTC" time zone, is at 19:30, and it ends at 20:55.
Important : To prevent session overlap, the working hours of each session have slightly changed.
🔵 Features
🟣 Simultaneous Session and Kill Zone
With this indicator, you can simultaneously view the kill zone and session. High and low lines are used to indicate sessions, while filled areas with color represent kill zones. If you do not want to see kill zones, you can turn off the display settings.
🟣 Candle, Time, and Volume
Using the "More Info" feature, you can see the number of candles, elapsed time, and traded volume within the colored filled area.
🔵 Settings
•Show More Info: To display "More Info," you need to turn on this feature and turn it off whenever you don't need it.
• You can also customize these settings for each session separately :
o Display or hide session.
o Choose session color.
o Set session time range.
o Display or hide kill zone.
o Set kill zone time range.

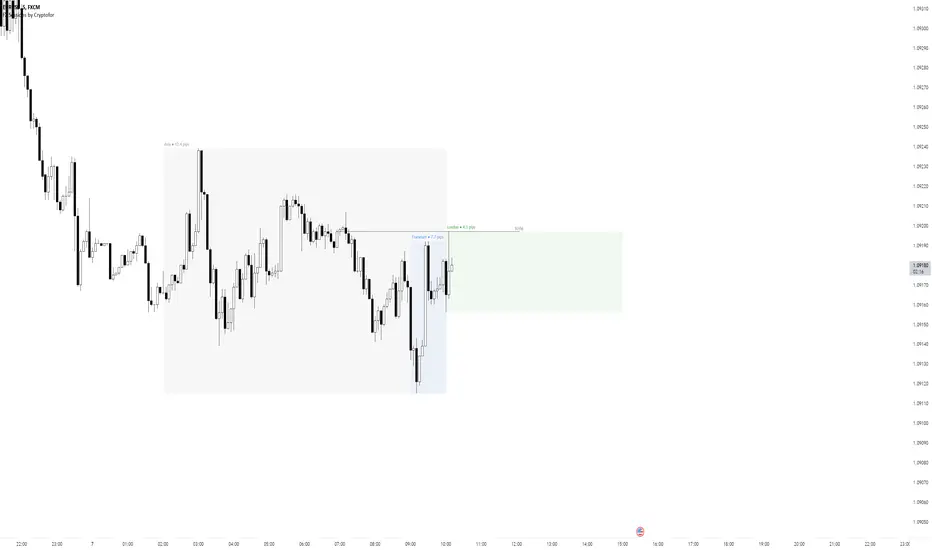
Forex Sessions by CryptoforForex Sessions Boxes
Killzones are the period of greatest volatility, and volatility is one of the main factors for finding the optimal trade time (OTT/Optimal Trade Time). That is, in a period of high volatility, we as traders have the most chances to open a good position, and at the same time not to sit on the charts for too long waiting for its closing.
Sessions:
1. Asian Session:
2. Frankfurt Session:
3. London Session:
3. New York Session:
Features:
Time zone change
Session time change
Show/hide Historical Data
Show/hide Pips
Show/hide Previous Day High/Low
Show/hide New York Midnight/True Daily Open
Text size and align customization
Borders style
Line and border sizes
Full customization of colors: borders, price lines, text, background
SMC: Multi-TF Bias & HTF BOS with SessionsOverview
The HTF BOS (Session) - Precision Lines is a comprehensive trading tool designed for Smart Money Concepts (SMC) and price action traders. It identifies Higher Timeframe (HTF) Break of Structure (BOS) levels while filtering them based on specific trading sessions. Additionally, it features a built-in Bias Dashboard that tracks trend alignment across three different timeframes to help you stay on the right side of the market.
Key Features
1. Precision HTF BOS Tracking
Unlike standard indicators that only mark the breakout candle, this script uses high-precision pivot detection to identify the exact origin of a structural high or low.
Tam Yapışık Çizgiler (Precise Lines): The BOS lines are drawn exactly from the pivot point to the breakout point, providing a clean and professional look on your chart.
HTF Integration: You can track structure from a higher timeframe (e.g., 4H) while trading on a lower timeframe (e.g., 15m or 5m).
2. Session Filtering (Time Sensitivity)
Structural breaks are most reliable when they happen during high-volume periods.
The script includes a Session Filter (London & New York).
If enabled, the indicator will only plot BOS levels that occur during your specified trading hours, helping you avoid "fake-outs" or noise during low-liquidity periods (Asian session/After-hours).
3. Multi-Timeframe Bias Dashboard
Stay aware of the "Big Picture" without constantly switching charts. The dashboard monitors three custom timeframes (e.g., Daily, 4H, 1H) and determines if the structure is Bullish or Bearish.
Strong Buy/Sell Signals: When all three timeframes align, the status cell highlights as "BUY" or "SELL."
Wait Status: If timeframes are in conflict, the dashboard suggests "WAIT," encouraging disciplined trading.
How to Use
Define Your Bias: Set your three Bias Timeframes in the settings to match your higher-level strategy.
Set Your BOS TF: Choose the timeframe you want structural breaks to be calculated from (usually one or two steps above your entry chart).
Adjust Sensitivity: Use the "Pivot Sensitivity" setting to filter between minor and major structural points.
Confirm with Session: Enable the session filter to ensure you are only trading breaks that occur during the NY or London sessions.
Settings
Bias Dashboard Settings: Customize the TFs and pivot sensitivity for trend analysis.
BOS & Session Settings: Set your target HTF for drawings and define your trading window (NY Timezone supported).
Visual Settings: Full control over colors (Bullish/Bearish), table positioning, and text sizes.

Session Seed Range (LON / FRA / NY / CME / ASIA + 3 Custom) — v6Session Seed Range → Lines (LON / FRA / NY / CME / ASIA + 3 Custom)
What it does
This tool draws two horizontal levels—the High and Low of a short seed window at each market open (e.g., London 09:00–09:05)—and extends them to the session close (e.g., 17:30). An optional Mid line (average of seed High/Low) can be displayed as well.
Included sessions
• London, Frankfurt, New York, CME, Asia
• Plus 3 fully custom sessions (name, seed window, session end)
Key features
• Seed window → extended lines: Capture the initial opening move and project it across the trading session.
• Timezone dropdown: Choose from common IANA timezones (incl. Europe/Istanbul)—no manual offset math.
• Label language: DE / EN / TR (or Off) for price labels at the right edge.
• Show/Hide Mid line per your preference.
• 3 custom sessions: Add your own schedules with custom names.
• Per-session styling: Colors and widths for High/Low/Mid.
• Lightweight: Works on any timeframe.
________________________________________
Quick start
1. Pick your Timezone in the Inputs.
2. Enable a session (e.g., London) and set its Seed (HHMM–HHMM) and Session End (HHMM).
3. Optionally turn on Show mid line and Labels (DE/EN/TR).
4. Repeat for other sessions or use the Custom A/B/C blocks.
Tip: The seed window must be visible on the chart’s timeframe so the High/Low can be collected. If you don’t see lines, zoom in or use a lower timeframe.
________________________________________
Inputs overview
• Timezone: IANA timezone selection.
• Labels: Off / DE / EN / TR + label offset (ticks).
• Show mid line: Toggle Mid (average of seed High/Low).
• Session blocks (London, Frankfurt, New York, CME, Asia, Custom A/B/C):
o Enable, Seed (HHMM–HHMM), Session End (HHMM)
o High/Low/Mid colors, Width
________________________________________
Notes & limitations
• Lines are built from the seed window only; they do not repaint once the seed completes.
• If the chart timeframe is too high to include the seed window, switch to a lower TF or widen the seed.
• This indicator is for analysis/education only and not financial advice.
________________________________________
Changelog (suggested)
• v1.0.0 — Initial release: LON/FRA/NY/CME/ASIA + 3 Custom, TZ dropdown, labels DE/EN/TR, Mid toggle.
________________________________________
If you want a shorter “store blurb” version, use:
Draws High/Low of a small opening seed window (e.g., London 09:00–09:05) and extends them to session close. Includes London, Frankfurt, New York, CME, Asia + 3 custom sessions. Timezone dropdown (incl. Europe/Istanbul), labels in DE/EN/TR (or Off), optional Mid line, per-session styling. Seed window must be visible on your timeframe. Not financial advice.
Essa's Sessions IndicatorOverview
This powerful tool is designed to visually map out the key trading sessions: Asia, London, and New York directly on your chart. By highlighting these periods and plotting their respective highs and lows, it helps you identify critical price levels, gauge market sentiment, and pinpoint potential breakout opportunities with ease.
What It Does
Visualizes Key Trading Sessions: Automatically draws colored backgrounds for the Asia, London, and New York sessions to show you exactly when the most important market activity is happening.
Plots Session Highs & Lows: Displays precise horizontal lines for the highest and lowest prices reached during each session, acting as key support and resistance levels.
Dual Timezone Mode: Easily switch between London (GMT/BST) and New York (EST/EDT) timezones with a single click. The indicator automatically adjusts all session times for you, ensuring accuracy no matter where you are.
Interactive & Informative Labels: Hover over any session high or low label to see a detailed tooltip containing:
The exact price level.
The session's price range (calculated in pips or points).
The total daily price range for broader context.
A simple volatility gauge (from "Low Vol 😴" to "High Vol 🔥").
Customizable Alerts: Enable breakout alerts to receive instant notifications the moment the price closes above a session high or below a session low.
Simple, powerful, and highly informative, this indicator is an essential tool for traders looking to build strategies around session-based price action.

True Close – Institutional Trading Sessions (Zeiierman)█ Overview
True Close – Institutional Trading Sessions (Zeiierman) is a professional-grade session mapping tool designed to help traders align with how institutions perceive the market’s true close. Unlike the textbook “daily close” used by retail traders, institutional desks often anchor their risk management, execution benchmarks, and exposure metrics to the first hour of the next session.
This indicator visualizes that logic directly on your chart — drawing session boxes, true close levels, and time-aligned labels across Sydney, Tokyo, London, and New York. It highlights the first hour of each session, projects the institutional closing price, and builds a live dashboard that tells you which sessions are active, which are in the critical opening phase, and what levels matter most right now.
More than just a visual tool, this indicator embeds institutional rhythm directly into your workflow — giving you a window into where big players finalize yesterday’s business, rebalance exposure, and execute delayed orders. It’s not just about painting sessions on your chart — it’s about adopting the mindset of those who truly move the market. Institutions don’t settle risk at the bell; they complete it in the next session. This tool lets you see that transition in real time, giving you an edge that goes beyond candles and indicators.
█ How It Works
⚪ Session Detection Engine
Each session is identified by its own time block (e.g., 09:00–17:30 for London). Once a session opens:
A full-session box is drawn to track its range.
The first hour is highlighted separately.
Once the first hour completes, the true close line is plotted, representing the price institutions often treat as the "real" close of the prior day.
⚪ Institutional True Close Logic
The script captures the close of the first hour, not the end of the day.
This line becomes a static reference across your chart, letting you visualize how price interacts with that institutional anchor:
Rejections from it show where yesterday's flow is respected.
Breaks through it may indicate that today's flows are rewriting the narrative.
⚪ Dynamic Dashboard Table
A live table appears in the corner of your screen, showing:
Each session's active status
Whether we’re inside the first hour
The current “true close” price if available
Each cell comes with advanced tooltips giving institutional context, flow dynamics, and market microstructure insights — from rebalancing spillovers to VWAP/TWAP lag effects.
█ How to Use
⚪ Use the First-Hour Line as Your Institutional Anchor
Treat it like the price level that big funds care about. Watch how the price behaves around level. Fades, re-tests, or continuation moves often occur as the market finishes recapping yesterday’s leftover orders.
⚪ Structure Entries Around the Session Context
Are you inside the first hour? Expect more volatility, more decisive flow. After the first session hour, expect fading liquidity as the market slows down and awaits the next session to open.
█ Settings
UTC Offset – Select your preferred time zone; all sessions adjust accordingly.
Session Toggles – Enable/disable Sydney, Tokyo, London, or NY.
Box Display Options – Show/hide session background, first-hour fill, borders.
True Close Line Controls – Enable line, label, and customize width & color.
Execution Hour Labels – Optional toggle for first-hour label placement.
-----------------
Disclaimer
The content provided in my scripts, indicators, ideas, algorithms, and systems is for educational and informational purposes only. It does not constitute financial advice, investment recommendations, or a solicitation to buy or sell any financial instruments. I will not accept liability for any loss or damage, including without limitation any loss of profit, which may arise directly or indirectly from the use of or reliance on such information.
All investments involve risk, and the past performance of a security, industry, sector, market, financial product, trading strategy, backtest, or individual's trading does not guarantee future results or returns. Investors are fully responsible for any investment decisions they make. Such decisions should be based solely on an evaluation of their financial circumstances, investment objectives, risk tolerance, and liquidity needs.

Market Sessions & Viewer Panel [By MUQWISHI]▋ INTRODUCTION :
The “Market Sessions & Viewer Panel” is a clean and intuitive visual indicator tool that highlights up to four trading sessions directly on the chart. Each session is fully customizable with its name, session time, and color. It also generates a panel that provides a quick-glance summary of each session’s candle/bar shape, helping traders gain insight into the volatility across all trading sessions.
_______________________
▋ OVERVIEW:
_______________________
▋ CREDIT:
This indicator utilizes the “ Timezone — Library ”. A huge thanks to @n00btraders for effort and well-organized work.
_______________________
▋ SESSION PANEL:
The Session Panel allows traders to visually compare session volatility using a candlestick/bar pattern.
Each bar represents the price action during a session and includes the session status, session name, closing price, change(%) from open, and a tooltip that reveals detailed OHLC and volume when hovered over.
Chart Type:
It offers two styles Bar or Candle to display based on traders’ preference
Sorting:
Allowing to arrange session candles/bars based on…
—Left to Right: The most recently opened on the left, moving backward in time to the right.
—Right to Left: The most recently opened on the right, moving backward in time to the left.
—Default: Arrange sessions in the user-defined input order.
_______________________
▋ CHART VISUALIZATION:
The chart visualization highlights each trading session using color-coded backgrounds in two selectable drawing styles that span their respective active timeframes. Each session block provides session’s name, close price, and change from open.
Chart Type: Candle
Chart Type: Box
Extra Drawing Feature:
This feature may not exist in other indicators within the same category, it extends the session block drawing to the projected end of the session. This's done through estimation based on historical data; however, it doesn’t function fully on seconds-based timeframes due to drawing limitations.
_______________________
▋ INDICATOR SETTINGS:
Section(1): Sessions
(1) Universal Timezone.
(2) Each Session: Enable/Disable, Name, Color, and Time.
Section(2): Session Panel
(1) Show/Hide Session Panel.
(2) Chart Type: Candle/Bar.
(3) Bar’s Up/Down color.
(4) Width and Height of the bar.
(5) Location of Session Panel on chat.
(6) Sort: Left to Right (most recent session is placed on the left), Right to Left (most recent session is placed on the right), and Default (as input arrangement).
Section(3): Chart Visualization
(1) Show/Hide Chart Block Visualization.
(2) Draw Shape: Box/Candle.
(3) Border Style and Size.
(4) Label Styling includes location, size, and some essential selectable infos.
Please let me know if you have any questions

Forex SessionThis Trading View script highlights the trading sessions for New York, European, and Asian markets on the chart and adds labels at the start of each session. The script uses Pine Script version 5 and converts local session times to UTC to accurately display the session times regardless of your local Time zone.
Features :
Session Times:
New York: 8:30 AM to 3:00 PM (Eastern Time, GMT-4)
European: 8:00 AM to 4:30 PM (London Time, GMT+1)
Asian: 9:00 AM to 6:00 PM (Tokyo Time, GMT+9)
Background Highlighting: The script shades the background for each session.
New York Session: Blue
European Session: Green
Asian Session: Red
Today's sessions are shaded with 90% opacity.
Tomorrow's sessions are shaded with 70% opacity.
How It Works :
Session Times Conversion: The script converts the session times from local timezones to UTC
using the timestamp function.
Background Coloring: The bgcolor function is used to shade the background for each session.
SFL Session OpensThis is a simple script that allows you to show the start of a trading session with a vertical line and label.
Currently, 3 major sessions are supported (Tokyo, London and NY) and there is an option to define a custom session too.
Per session, you can configure the open hour and minute, whether you want to enable it and the color of the line/label.
Give it a thumbs up if you like it. Enjoy!

Forex Sessions-By Blackwolf for FXCM 00:00-24:00 V2.1This script uses FXCM as reference and it has been configured to work with the time fo Admiral Markets broker
It shows vertical lines for the midnight of everyday.
It shows three different trading sessions: Asia Europe America
It is configured for Rome Time Zone
Script da utilizzare con broker FXCM per la correttezza e la corrispondenza automatica della mezzanotte
Lo script segna automaticamente delle linee verticali in corrispondenza della mezzanotte dal lunedì al venerdì in modo da definire chiaramente l'inizio e la fine della giornata.
Inoltre le sessioni di trading giornaliere Asia, Europa, America vengono evidenziate con delle fasce colorate per definire le diverse sessioni di mercato sincronozzate con Broker Admiral Markets.
Lo script ha come orario di base il fuso West America ed è già stato preimpostato per avere la corrispondenza esatta con le varie sessioni in funzione dell' orario di Roma (US 18.00 = Roma 00.00)
