Trading Sessions [QuantAlgo]🟢 Overview
The Trading Sessions indicator tracks and displays the four major global trading sessions: Sydney, Tokyo, London, and New York. It provides session-based background highlighting, real-time price change tracking from session open, and a data table with session status. The script works across all markets (forex, equities, commodities, crypto) and helps traders identify when specific geographic markets are active, which directly correlates with changes in liquidity and volatility patterns. Default session times are set to major financial center hours in UTC but are fully adjustable to match your trading methodology.
🟢 Key Features
→ Session Background Color Coding
Each trading session gets a distinct background color on your chart:
1. Sydney Session - Default orange, 22:00-07:00 UTC
2. Tokyo Session - Default red, 00:00-09:00 UTC
3. London Session - Default green, 08:00-16:00 UTC
4. New York Session - Default blue, 13:00-22:00 UTC
When sessions overlap, the color priority is New York > London > Tokyo > Sydney. This means if London and New York are both active, the background shows New York's color. The priority matches typical liquidity and volatility patterns where later sessions generally show higher volume.
→ Color Customization
All session colors are configurable in the Color Settings panel:
1. Click any session color input to open the color picker
2. Select your preferred color for that session
3. Use the "Background Transparency" slider (0-100) to adjust opacity. Lower values = more visible, higher values = more subtle
4. Enable "Color Price Bars" to color candlesticks themselves according to the active session instead of just the background
The Color column in the info table shows a block (█) in each session's assigned color, matching what you see on the chart background.
→ Information Table Breakdown
→ Timeframe Warning
If you're viewing a timeframe of 12 hours or higher, a red warning label appears center-screen. Session boundaries don't render accurately on high timeframes because the time() function in Pine Script can't detect intra-bar session changes when each bar spans multiple sessions. The warning tells you to switch to sub-12H timeframes (e.g., 4H, 1H, 30m, 15m, etc.) for proper session detection. You can disable this warning in Color Settings if needed, but session highlighting can be unreliable on 12H+ charts regardless.
→ Time Range Configuration
Every session's time range is editable in Session Settings:
1. Click the time input field next to each session
2. Enter time as HHMM-HHMM in 24-hour format
3. All times are interpreted as UTC
4. Modify these to account for daylight saving shifts or to define custom session periods based on your backtested optimal trading windows
For example, if your strategy performs best during London/NY overlap specifically, you could set London to 08:00-17:00 and New York to 13:00-22:00 to ensure you see the full overlap highlighted.
→ Weekdays Filter
The "Weekdays Only (Mon-Fri)" toggle controls whether sessions display on weekends:
Enabled: Sessions only show Monday-Friday and hide on Saturday-Sunday. Use this for markets that close on weekends (most equities, forex).
Disabled: Sessions display 24/7 including weekends. Use this for markets that trade continuously (crypto).
→ Table Display Options
The info table has several configuration options in Table Settings:
Visibility: Toggle "Show Info Table" on/off to display or hide the entire table.
Position: Nine position options (Top/Middle/Bottom + Left/Center/Right) let you place the table wherever it doesn't block your price action or other indicators.
Text Size: Four size options (Tiny, Small, Normal, Large) to match your screen resolution and visual preferences.
→ Color Schemes:
Mono: Black background, gray header, white text
Light: White background, light gray header, black text
Blue: Dark blue background, medium blue header, white text
Custom: Manual selection of all five color components (table background, header background, header text, data text, borders)
→ Alert Functionality
The indicator includes ten alert conditions you can access via TradingView's alert system:
Session Opens:
1. Sydney Session Started
2. Tokyo Session Started
3. London Session Started
4. New York Session Started
5. Any Session Started
Session Closes:
6. Sydney Session Ended
7. Tokyo Session Ended
8. London Session Ended
9. New York Session Ended
10. Any Session Ended
These alerts fire when sessions transition based on your configured time ranges, letting you automate monitoring of session changes without watching the chart continuously. Useful for strategies that trade specific session opens/closes or need to adjust position sizing when volatility regime shifts between sessions.
Cari dalam skrip untuk "session"

ORB Norman (2 Sessions, Auto Timezone)ORB Norman (2 Sessions, Auto Timezone)
This script plots Opening Range Breakout (ORB) levels for two configurable sessions. It’s designed for intraday traders—especially in futures markets like Gold (GC), Nasdaq (NQ), and S&P (ES)—who trade based on early session breakouts or range rejections. Unlike standard indicators, this tool auto-adjusts for timezones based on the instrument, ensuring precise session alignment.
Features:
Automatically adjusts for NQ/ES (Chicago time) and GC (New York time) based on the symbol.
Plots high, low, and optional midpoint lines for each session.
Clean, minimal settings with visual separation for better usability.
Ray extension length is fully customizable.
Works on any intraday chart (recommended: 5–15 minute timeframes).
Includes customizable session times, colors, ray length, and an optional midpoint line.
Default Sessions:
Session 1:
‣ 07:00–08:00 EST for GC
‣ 06:00–07:00 CT for NQ/ES
Session 2:
‣ 09:30–09:45 EST for GC
‣ 08:30–08:45 CT for NQ/ES
This tool is ideal for traders who scalp the early morning breakout or look for range rejections based on the opening auction.
This script was developed from scratch based on the author's own intraday trading needs.

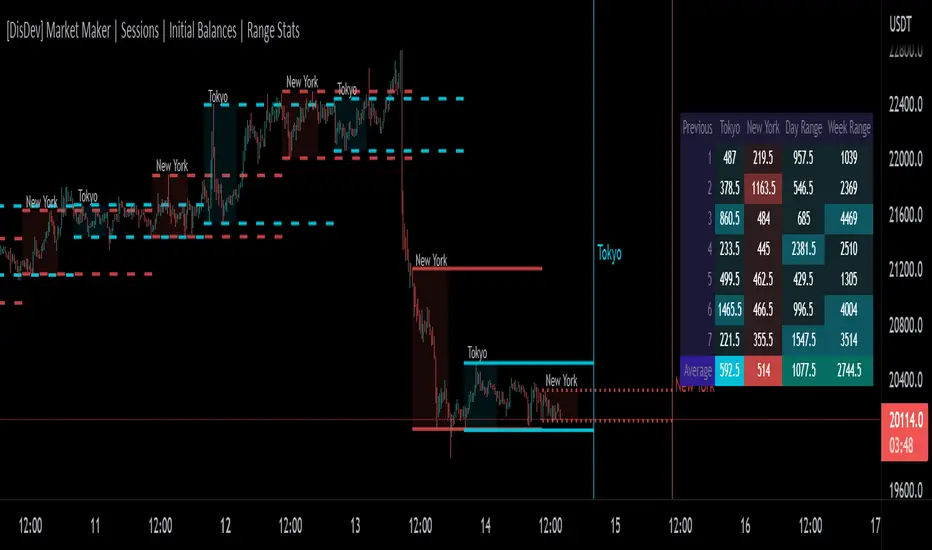
[DisDev] Market Maker | Sessions | Initial Balance | Range StatsThis indicator has two main components: Time-Specific Sessions and High/Low Statistics . There are also several subcomponents: Day of Week Separators, Specific Session High/Low Extenders, Day Range Statistics, Week Range Statistics, User Input Session Titles, etc.
Each component is explained and demonstrated how it could be utilized as a trading tool.
The basis of this indicator is to analyze session-specific price movements through automatic display and statistics.
Key:
Dotted lines = Developing Session
Solid Line = Session complete
Dashed lines = Past Session
1) The primary function is the five manual time-session inputs. These sessions could be based on a full market period, such as London Open to Close (0800 UTC to 1630 UTC), the Initial Balance of the day (0000 UTC to 0100 UTC), or a session Initial Balance New York (1430 UTC to 1530 UTC). The user can update settings input text to reflect this on the chart.
The following shows the example noted above, with the added subcomponents of:
• Shaded areas to define each session
• Extension of the Sessions highs and lows (extension 24/48/72-hour options)
• Future line projection (provides a reminder of when the market opens)
This allows you to see potential levels of resistance and support and market open volatility.
The below example shows the input sessions configured for five Session Initial Balances. You can see that the Sessions Initial Balances were in a tight price range. A range breakout occurred with price move of $1400 visualized.
2) The secondary function is the Range statistics. Range statistics can be used to track the volatility of each session, day or week and can be selected for up to 31 days. This helps the user to determine overbought or oversold conditions as well as pattern recognition.
Trade Example 1
Settings: New York Session Open to Session Close.
The colored boxes are manually drawn to emphasize how the New York Lows and Highs can act as a confluence for support and resistance areas.
Trade Example 2a
Settings: London Session Open to Session Close and New York Session Open to Session Close.
This chart shows how the Session Open (in this case, the New York Open) reminder notifies you that there could be volatility when a new session opens.
Trade Example 2b
Notice how price breaks to the upside at the opening of the New York session. In this instance it was a $2,250 or 5.17% increase in the opening hour.
3. Once London closes New York has control of the market; one push-up stops out the shorts that placed stop losses at the London high, then brings price back down to the mean.
By having the reminder lines and shaded sessions, the user is prepared and can anticipate some price reaction, often a reversal if price has been steadily moving in one direction.
Universal Global SessionUniversal Global Session
This Script combines the world sessions of: Stocks, Forex, Bitcoin Kill Zones, strategic points, all configurable, in a single Script, to capitalize the opening and closing times of global exchanges as investment assets, becoming an Universal Global Session .
It is based on the great work of @oscarvs ( BITCOIN KILL ZONES v2 ) and the scripts of @ChrisMoody. Thank you Oscar and Chris for your excellent judgment and great work.
At the end of this writing you can find all the internet references of the extensive documentation that I present here. To maximize your benefits in the use of this Script, I recommend that you read the entire document to create an objective and practical criterion.
All the hours of the different exchanges are presented at GMT -6. In Market24hClock you can adjust it to your preferences.
After a deep investigation I have been able to show that the different world sessions reveal underlying investment cycles, where it is possible to find sustained changes in the nominal behavior of the trend before the passage from one session to another and in the natural overlaps between the sessions. These underlying movements generally occur 15 minutes before the start, close or overlap of the session, when the session properly starts and also 15 minutes after respectively. Therefore, this script is designed to highlight these particular trending behaviors. Try it, discover your own conclusions and let me know in the notes, thank you.
Foreign Exchange Market Hours
It is the schedule by which currency market participants can buy, sell, trade and speculate on currencies all over the world. It is open 24 hours a day during working days and closes on weekends, thanks to the fact that operations are carried out through a network of information systems, instead of physical exchanges that close at a certain time. It opens Monday morning at 8 am local time in Sydney —Australia— (which is equivalent to Sunday night at 7 pm, in New York City —United States—, according to Eastern Standard Time), and It closes at 5pm local time in New York City (which is equivalent to 6am Saturday morning in Sydney).
The Forex market is decentralized and driven by local sessions, where the hours of Forex trading are based on the opening range of each active country, becoming an efficient transfer mechanism for all participants. Four territories in particular stand out: Sydney, Tokyo, London and New York, where the highest volume of operations occurs when the sessions in London and New York overlap. Furthermore, Europe is complemented by major financial centers such as Paris, Frankfurt and Zurich. Each day of forex trading begins with the opening of Australia, then Asia, followed by Europe, and finally North America. As markets in one region close, another opens - or has already opened - and continues to trade in the currency market. The seven most traded currencies in the world are: the US dollar, the euro, the Japanese yen, the British pound, the Australian dollar, the Canadian dollar, and the New Zealand dollar.
Currencies are needed around the world for international trade, this means that operations are not dominated by a single exchange market, but rather involve a global network of brokers from around the world, such as banks, commercial companies, central banks, companies investment management, hedge funds, as well as retail forex brokers and global investors. Because this market operates in multiple time zones, it can be accessed at any time except during the weekend, therefore, there is continuously at least one open market and there are some hours of overlap between the closing of the market of one region and the opening of another. The international scope of currency trading means that there are always traders around the world making and satisfying demands for a particular currency.
The market involves a global network of exchanges and brokers from around the world, although time zones overlap, the generally accepted time zone for each region is as follows:
Sydney 5pm to 2am EST (10pm to 7am UTC)
London 3am to 12 noon EST (8pm to 5pm UTC)
New York 8am to 5pm EST (1pm to 10pm UTC)
Tokyo 7pm to 4am EST (12am to 9am UTC)
Trading Session
A financial asset trading session refers to a period of time that coincides with the daytime trading hours for a given location, it is a business day in the local financial market. This may vary according to the asset class and the country, therefore operators must know the hours of trading sessions for the securities and derivatives in which they are interested in trading. If investors can understand market hours and set proper targets, they will have a much greater chance of making a profit within a workable schedule.
Kill Zones
Kill zones are highly liquid events. Many different market participants often come together and perform around these events. The activity itself can be event-driven (margin calls or option exercise-related activity), portfolio management-driven (asset allocation rebalancing orders and closing buy-in), or institutionally driven (larger players needing liquidity to complete the size) or a combination of any of the three. This intense cross-current of activity at a very specific point in time often occurs near significant technical levels and the established trends emerging from these events often persist until the next Death Zone approaches or enters.
Kill Zones are evolving with time and the course of world history. Since the end of World War II, New York has slowly invaded London's place as the world center for commercial banking. So much so that during the latter part of the 20th century, New York was considered the new center of the financial universe. With the end of the cold war, that leadership appears to have shifted towards Europe and away from the United States. Furthermore, Japan has slowly lost its former dominance in the global economic landscape, while Beijing's has increased dramatically. Only time will tell how these death zones will evolve given the ever-changing political, economic, and socioeconomic influences of each region.
Financial Markets
New York
New York (NYSE Chicago, NASDAQ)
7:30 am - 2:00 pm
It is the second largest currency platform in the world, followed largely by foreign investors as it participates in 90% of all operations, where movements on the New York Stock Exchange (NYSE) can have an immediate effect (powerful) on the dollar, for example, when companies merge and acquisitions are finalized, the dollar can instantly gain or lose value.
A. Complementary Stock Exchanges
Brazil (BOVESPA - Brazilian Stock Exchange)
07:00 am - 02:55 pm
Canada (TSX - Toronto Stock Exchange)
07:30 am - 02:00 pm
New York (NYSE - New York Stock Exchange)
08:30 am - 03:00 pm
B. North American Trading Session
07:00 am - 03:00 pm
(from the beginning of the business day on NYSE and NASDAQ, until the end of the New York session)
New York, Chicago and Toronto (Canada) open the North American session. Characterized by the most aggressive trading within the markets, currency pairs show high volatility. As the US markets open, trading is still active in Europe, however trading volume generally decreases with the end of the European session and the overlap between the US and Europe.
C. Strategic Points
US main session starts in 1 hour
07:30 am
The euro tends to drop before the US session. The NYSE, CHX and TSX (Canada) trading sessions begin 1 hour after this strategic point. The North American session begins trading Forex at 07:00 am.
This constitutes the beginning of the overlap of the United States and the European market that spans from 07:00 am to 10:35 am, often called the best time to trade EUR / USD, it is the period of greatest liquidity for the main European currencies since it is where they have their widest daily ranges.
When New York opens at 07:00 am the most intense trading begins in both the US and European markets. The overlap of European and American trading sessions has 80% of the total average trading range for all currency pairs during US business hours and 70% of the total average trading range for all currency pairs during European business hours. The intersection of the US and European sessions are the most volatile overlapping hours of all.
Influential news and data for the USD are released between 07:30 am and 09:00 am and play the biggest role in the North American Session. These are the strategically most important moments of this activity period: 07:00 am, 08:00 am and 08:30 am.
The main session of operations in the United States and Canada begins
08:30 am
Start of main trading sessions in New York, Chicago and Toronto. The European session still overlaps the North American session and this is the time for large-scale unpredictable trading. The United States leads the market. It is difficult to interpret the news due to speculation. Trends develop very quickly and it is difficult to identify them, however trends (especially for the euro), which have developed during the overlap, often turn the other way when Europe exits the market.
Second hour of the US session and last hour of the European session
09:30 am
End of the European session
10:35 am
The trend of the euro will change rapidly after the end of the European session.
Last hour of the United States session
02:00 pm
Institutional clients and very large funds are very active during the first and last working hours of almost all stock exchanges, knowing this allows to better predict price movements in the opening and closing of large markets. Within the last trading hours of the secondary market session, a pullback can often be seen in the EUR / USD that continues until the opening of the Tokyo session. Generally it happens if there was an upward price movement before 04:00 pm - 05:00 pm.
End of the trade session in the United States
03:00 pm
D. Kill Zones
11:30 am - 1:30 pm
New York Kill Zone. The United States is still the world's largest economy, so by default, the New York opening carries a lot of weight and often comes with a huge injection of liquidity. In fact, most of the world's marketable assets are priced in US dollars, making political and economic activity within this region even more important. Because it is relatively late in the world's trading day, this Death Zone often sees violent price swings within its first hour, leading to the proven adage "never trust the first hour of trading in America. North.
---------------
London
London (LSE - London Stock Exchange)
02:00 am - 10:35 am
Britain dominates the currency markets around the world, and London is its main component. London, a central trading capital of the world, accounts for about 43% of world trade, many Forex trends often originate from London.
A. Complementary Stock Exchange
Dubai (DFM - Dubai Financial Market)
12:00 am - 03:50 am
Moscow (MOEX - Moscow Exchange)
12:30 am - 10:00 am
Germany (FWB - Frankfurt Stock Exchange)
01:00 am - 10:30 am
Afríca (JSE - Johannesburg Stock Exchange)
01:00 am - 09:00 am
Saudi Arabia (TADAWUL - Saudi Stock Exchange)
01:00 am - 06:00 am
Switzerland (SIX - Swiss Stock Exchange)
02:00 am - 10:30 am
B. European Trading Session
02:00 am - 11:00 am
(from the opening of the Frankfurt session to the close of the Order Book on the London Stock Exchange / Euronext)
It is a very liquid trading session, where trends are set that start during the first trading hours in Europe and generally continue until the beginning of the US session.
C. Middle East Trading Session
12:00 am - 06:00 am
(from the opening of the Dubai session to the end of the Riyadh session)
D. Strategic Points
European session begins
02:00 am
London, Frankfurt and Zurich Stock Exchange enter the market, overlap between Europe and Asia begins.
End of the Singapore and Asia sessions
03:00 am
The euro rises almost immediately or an hour after Singapore exits the market.
Middle East Oil Markets Completion Process
05:00 am
Operations are ending in the European-Asian market, at which time Dubai, Qatar and in another hour in Riyadh, which constitute the Middle East oil markets, are closing. Because oil trading is done in US dollars, and the region with the trading day coming to an end no longer needs the dollar, consequently, the euro tends to grow more frequently.
End of the Middle East trading session
06:00 am
E. Kill Zones
5:00 am - 7:00 am
London Kill Zone. Considered the center of the financial universe for more than 500 years, Europe still has a lot of influence in the banking world. Many older players use the European session to establish their positions. As such, the London Open often sees the most significant trend-setting activity on any trading day. In fact, it has been suggested that 80% of all weekly trends are set through the London Kill Zone on Tuesday.
F. Kill Zones (close)
2:00 pm - 4:00 pm
London Kill Zone (close).
---------------
Tokyo
Tokyo (JPX - Tokyo Stock Exchange)
06:00 pm - 12:00 am
It is the first Asian market to open, receiving most of the Asian trade, just ahead of Hong Kong and Singapore.
A. Complementary Stock Exchange
Singapore (SGX - Singapore Exchange)
07:00 pm - 03:00 am
Hong Kong (HKEx - Hong Kong Stock Exchange)
07:30 pm - 02:00 am
Shanghai (SSE - Shanghai Stock Exchange)
07:30 pm - 01:00 am
India (NSE - India National Stock Exchange)
09:45 pm - 04:00 am
B. Asian Trading Session
06:00 pm - 03:00 am
From the opening of the Tokyo session to the end of the Singapore session
The first major Asian market to open is Tokyo which has the largest market share and is the third largest Forex trading center in the world. Singapore opens in an hour, and then the Chinese markets: Shanghai and Hong Kong open 30 minutes later. With them, the trading volume increases and begins a large-scale operation in the Asia-Pacific region, offering more liquidity for the Asian-Pacific currencies and their crosses. When European countries open their doors, more liquidity will be offered to Asian and European crossings.
C. Strategic Points
Second hour of the Tokyo session
07:00 pm
This session also opens the Singapore market. The commercial dynamics grows in anticipation of the opening of the two largest Chinese markets in 30 minutes: Shanghai and Hong Kong, within these 30 minutes or just before the China session begins, the euro usually falls until the same moment of the opening of Shanghai and Hong Kong.
Second hour of the China session
08:30 pm
Hong Kong and Shanghai start trading and the euro usually grows for more than an hour. The EUR / USD pair mixes up as Asian exporters convert part of their earnings into both US dollars and euros.
Last hour of the Tokyo session
11:00 pm
End of the Tokyo session
12:00 am
If the euro has been actively declining up to this time, China will raise the euro after the Tokyo shutdown. Hong Kong, Shanghai and Singapore remain open and take matters into their own hands causing the growth of the euro. Asia is a huge commercial and industrial region with a large number of high-quality economic products and gigantic financial turnover, making the number of transactions on the stock exchanges huge during the Asian session. That is why traders, who entered the trade at the opening of the London session, should pay attention to their terminals when Asia exits the market.
End of the Shanghai session
01:00 am
The trade ends in Shanghai. This is the last trading hour of the Hong Kong session, during which market activity peaks.
D. Kill Zones
10:00 pm - 2:00 am
Asian Kill Zone. Considered the "Institutional" Zone, this zone represents both the launch pad for new trends as well as a recharge area for the post-American session. It is the beginning of a new day (or week) for the world and as such it makes sense that this zone often sets the tone for the remainder of the global business day. It is ideal to pay attention to the opening of Tokyo, Beijing and Sydney.
--------------
Sidney
Sydney (ASX - Australia Stock Exchange)
06:00 pm - 12:00 am
A. Complementary Stock Exchange
New Zealand (NZX - New Zealand Stock Exchange)
04:00 pm - 10:45 pm
It's where the global trading day officially begins. While it is the smallest of the megamarkets, it sees a lot of initial action when markets reopen Sunday afternoon as individual traders and financial institutions are trying to regroup after the long hiatus since Friday afternoon. On weekdays it constitutes the end of the current trading day where the change in the settlement date occurs.
B. Pacific Trading Session
04:00 pm - 12:00 am
(from the opening of the Wellington session to the end of the Sydney session)
Forex begins its business hours when Wellington (New Zealand Exchange) opens local time on Monday. Sydney (Australian Stock Exchange) opens in 2 hours. It is a session with a fairly low volatility, configuring itself as the calmest session of all. Strong movements appear when influential news is published and when the Pacific session overlaps the Asian Session.
C. Strategic Points
End of the Sydney session
12:00 am
---------------
Conclusions
The best time to trade is during overlaps in trading times between open markets. Overlaps equate to higher price ranges, creating greater opportunities.
Regarding press releases (news), it should be noted that these in the currency markets have the power to improve a normally slow trading period. When a major announcement is made regarding economic data, especially when it goes against the predicted forecast, the coin can lose or gain value in a matter of seconds. In general, the more economic growth a country produces, the more positive the economy is for international investors. Investment capital tends to flow to countries that are believed to have good growth prospects and subsequently good investment opportunities, leading to the strengthening of the country's exchange rate. Also, a country that has higher interest rates through its government bonds tends to attract investment capital as foreign investors seek high-yield opportunities. However, stable economic growth and attractive yields or interest rates are inextricably intertwined. It's important to take advantage of market overlaps and keep an eye out for press releases when setting up a trading schedule.
References:
www.investopedia.com
www.investopedia.com
www.investopedia.com
www.investopedia.com
market24hclock.com
market24hclock.com

Cumulative Returns by Session [BackQuant]Cumulative Returns by Session
What this is
This tool breaks the trading day into three user-defined sessions and tracks how much each session contributes to return, volatility, and volume. It then aggregates results over a rolling window so you can see which session has been pulling its weight, how streaky each session has been, and how sessions relate to one another through a compact correlation heatmap.
We’ve also given the functionality for the user to use a simplified table, just by switching off all settings they are not interested in.
How it works
1) Session segmentation
You define APAC, EU, and US sessions with explicit hours and time zones. The script detects when each session starts and ends on every intraday bar and records its open, intraday high and low, close, and summed volume.
2) Per-session math
At each session end the script computes:
Return — either Percent: (Close−Open)÷Open×100(Close − Open) ÷ Open × 100(Close−Open)÷Open×100 or Points: (Close−Open)(Close − Open)(Close−Open), based on your selection.
Volatility — either Range: (High−Low)÷Open×100(High − Low) ÷ Open × 100(High−Low)÷Open×100 or ATR scaled by price: ATR÷Open×100ATR ÷ Open × 100ATR÷Open×100.
Volume — total volume transacted during that session.
3) Storage and lookback
Each day’s three session stats are stored as a row. You choose how many recent sessions to keep in memory. The script then:
Builds cumulative returns for APAC, EU, US across the lookback.
Computes averages, win rates, and a Sharpe-like ratio avgreturn÷avgvolatilityavg return ÷ avg volatilityavgreturn÷avgvolatility per session.
Tracks streaks of positive or negative sessions to show momentum.
Tracks drawdowns on cumulative returns to show worst runs from peak.
Computes rolling means over a short window for short-term drift.
4) Correlation heatmap
Using the stored arrays of session returns, the script calculates Pearson correlations between APAC–EU, APAC–US, and EU–US, and colors the matrix by strength and sign so you can spot coupling or decoupling at a glance.
What it plots
Three lines: cumulative return for APAC, EU, US over the chosen lookback.
Zero reference line for orientation.
A statistics table with cumulative %, average %, positive session rate, and optional columns for volatility, average volume, max drawdown, current streak, return-to-vol ratio, and rolling average.
A small correlation heatmap table showing APAC, EU, US cross-session correlations.
How to use it
Pick the asset — leave Custom Instrument empty to use the chart symbol, or point to another symbol for cross-asset studies.
Set your sessions and time zones — defaults approximate APAC, EU, and US hours, but you can align them to exchange times or your workflow.
Choose calculation modes — Percent vs Points for return, Range vs ATR for volatility. Points are convenient for futures and fixed-tick assets, Percent is comparable across symbols.
Decide the lookback — more sessions smooths lines and stats; fewer sessions makes the tool more reactive.
Toggle analytics — add volatility, volume, drawdown, streaks, Sharpe-like ratio, rolling averages, and the correlation table as needed.
Why session attribution helps
Different sessions are driven by different flows. Asia often sets the overnight tone, Europe adds liquidity and direction changes, and the US session can dominate range expansion. Separating contributions by session helps you:
Identify which session has been the main driver of net trend.
Measure whether volatility or volume is concentrated in a specific window.
See if one session’s gains are consistently given back in another.
Adapt tactics: fade during a mean-reverting session, press during a trending session.
Reading the tables
Cumulative % — sum of session returns over the lookback. The sign and slope tell you who is carrying the move.
Avg Return % and Positive Sessions % — direction and hit rate. A low average but high hit rate implies many small moves; the reverse implies occasional big swings.
Avg Volatility % — typical intrabars range for that session. Compare with Avg Return to judge efficiency.
Return/Vol Ratio — return per unit of volatility. Higher is better for stability.
Max Drawdown % — worst cumulative give-back within the lookback. A quick way to spot riskiness by session.
Current Streak — consecutive up or down sessions. Useful for mean-reversion or regime awareness.
Rolling Avg % — short-window drift indicator to catch recent turnarounds.
Correlation matrix — green clusters indicate sessions tending to move together; red indicates offsetting behavior.
Settings overview
Basic
Number of Sessions — how many recent days to include.
Custom Instrument — analyze another ticker while staying on your current chart.
Session Configuration and Times
Enable or hide APAC, EU, US rows.
Set hours per session and the specific time zone for each.
Calculation Methods
Return Calculation — Percent or Points.
Volatility Calculation — Range or ATR; ATR Length when applicable.
Advanced Analytics
Correlation, Drawdown, Momentum, Sharpe-like ratio, Rolling Statistics, Rolling Period.
Display Options and Colors
Show Statistics Table and its position.
Toggle columns for Volatility and Volume.
Pick individual colors for each session line and row accents.
Common applications
Session bias mapping — find which window tends to trend in your market and plan exposure accordingly.
Strategy scheduling — allocate attention or risk to the session with the best return-to-vol ratio.
News and macro awareness — see if correlation rises around central bank cycles or major data releases.
Cross-asset monitoring — set the Custom Instrument to a driver (index future, DXY, yields) to see if your symbol reacts in a particular session.
Notes
This indicator works on intraday charts, since sessions are defined within a day. If you change session clocks or time zones, give the script a few bars to accumulate fresh rows. Percent vs Points and Range vs ATR choices affect comparability across assets, so be consistent when comparing symbols.
Session context is one of the simplest ways to explain a messy tape. By separating the day into three windows and scoring each one on return, volatility, and consistency, this tool shows not just where price ended up but when and how it got there. Use the cumulative lines to spot the steady driver, read the table to judge quality and risk, and glance at the heatmap to learn whether the sessions are amplifying or canceling one another. Adjust the hours to your market and let the data tell you which session deserves your focus.

Session Trend Predictor-excillionSession Trend Predictor - Excillion
Created by: (Excillion)
🧠 What This Script Does
Session Trend Predictor highlights specific trading sessions (like the New York session or any custom intraday range) directly on the chart, helping traders visually analyze price behavior within those time windows. It draws color-coded boxes around each session and assigns a simple trend signal (📈 or 📉) at the end of the session based on how price behaved during that time.
🔍 How It Works
The script tracks two customizable sessions per day. For each session:
It captures key price data:
Session Open
Session Close
Session High
Session Low
Average price across the session
It applies a basic trend classification logic:
A trend is detected by comparing the opening and closing prices
If the session is indecisive, no signal is shown.
Session Boxes:
A shaded box is drawn from the session’s start to end candle, stretching from session low to high, with optional outlines and a label showing the trend direction if detected.
⚙️ Customizable Settings
Session Time Settings: Define start and end hours/minutes for both sessions.
Color and Transparency: Choose base colors for each session box and adjust transparency for better visibility.
Display Options: Show or hide box outlines and trend emojis for a cleaner chart if desired.
🧭 How to Use It
Use the indicator to observe how price behaves within each session.
Watch for trend signals (📈 / 📉) at the end of each session as a way to confirm or reject trade ideas.
Combine with support/resistance levels or price action strategies for more informed intraday or session-based trades.
Ideal for beginners and visual traders who want simple, session-focused trend cues.
This indicator simplifies session analysis by automatically marking trading ranges and suggesting a directional bias based on session dynamics—no complicated indicators or settings needed.
In highly Volatile markets, ensure you utilize other confluences to determine your entries.

[KVA] Custom Sessions Custom Sessions: Multi-Timeframe Analysis & Key Level Insights
Introduction:
Introducing " Custom Sessions," an innovative Pine Script indicator meticulously crafted to empower traders by offering an advanced level of analysis on various global trading sessions. This tool is designed not just to highlight trading sessions but to delve deeper into the nuances of market movements by analyzing candlestick behavior within those sessions, offering a nuanced view of market trends, liquidity, and potential turning points.
Core Features :
Session Customization : Tailor trading sessions to align with your strategy, focusing on the markets that matter most to you. Whether it's London, New York, Tokyo, Sydney, or Frankfurt, you have the control.
Enhanced Market Insight : Beyond session timing, gain a refined understanding of market dynamics through detailed candlestick analysis within each session, providing a granular view of price action.
Comprehensive Analysis Tools : Alongside session analysis, the indicator includes features like VWAP (Volume Weighted Average Price) and Fibonacci retracement levels, offering a multifaceted approach to market analysis across chosen timeframes.
VWAP : Gain insights into the market's trend and liquidity by viewing the Volume Weighted Average Price calculated for the custom timeframe.
Fibonacci Retracement Levels : Easily identify potential reversal points with automatically plotted Fibonacci levels at 0.236, 0.382, 0.5, 0.618, and 0.782for each candle
Real-Time Updates : As the market moves, so does " Custom Sessions," offering real-time insights that adapt to the unfolding market conditions.
Utilization Guide :
Configure Your Sessions : Begin by setting up the sessions that are most relevant to your trading approach, customizing their times as needed.
Select the Desired Timeframe : Input your preferred higher timeframe to analyze data that is most relevant to your trading strategy.
Dive into the Details : Use the detailed candlestick analysis within sessions to pinpoint potential entry and exit points, supported by VWAP and Fibonacci levels for deeper market insight.
Customize Your View : Adjust the visual aspects of the indicator, including session color coding and which elements to display, tailoring the tool to your preferences.
Acknowledgements :
A special thanks to Aurocks_AIF for their foundational work on "Sessions on Chart" . This project has been an invaluable resource, inspiring the development of " Custom Sessions" and pushing the boundaries of traditional session analysis.
Final Thoughts :
" Custom Sessions" is more than just an indicator; it's a comprehensive analysis tool that brings a new depth to the understanding of market sessions. By offering detailed insights into the behavior of candles within these sessions, along with essential analysis features, this indicator is a must-have for traders seeking to enhance their technical analysis arsenal.
Whether you're a day trader looking to capture short-term movements or a long-term investor seeking broader market insights, this indicator offers valuable data visualization to enhance your trading decisions. By integrating highs, lows, VWAP, and Fibonacci levels into your analysis, you gain a comprehensive view of market behavior across different timeframes and sessions

ICT Multi-Session Hi/L/EQ
Indicator Overview: The "ICT Multi-Session Hi/L/EQ" indicator is a versatile tool designed for traders utilizing Inner Circle Trader (ICT) strategies, enabling the visualization of key price levels—High (H), Low (L), Equilibrium (EQ, the midpoint between high and low), and Optimal Trade Entry (OTE) levels at 61.8%, 70%, and 79% of the session range—across up to 6 customizable market sessions on a single chart.
Core Functionality: It dynamically tracks and plots session-specific highs, lows, and EQ, updating in real-time as price action evolves, providing traders with immediate insights into potential support, resistance, and balance zones during defined periods like the Asian, London, or New York sessions. This multi-session capability allows for comprehensive market analysis without the need for multiple indicators.
Unique OTE Auto Detection: A standout feature is the automatic detection and directional calculation of OTE levels. When a session forms a new high, OTE levels are recalculated downward from the high to the low (bearish bias), highlighting potential short entry zones. Conversely, a new low triggers upward OTE levels from the low to the high (bullish bias), signaling long opportunities. This auto-detection adapts to market momentum without manual input, making it highly unique for ICT traders seeking efficient entry signals based on range retracements. No other indicator combines this session-based auto-directionality with OTE percentages tailored for ICT methodologies.
Left-Side Trimming Innovation: Another innovative aspect is the left-side trimming option, which allows users to limit the historical extension of lines to a user-defined number of bars (e.g., the last 8 bars), reducing chart clutter and focusing attention on recent price action. This feature is particularly unique as it addresses a common issue in multi-session indicators where full historical lines can overwhelm the chart, making it ideal for scalpers or day traders who prioritize clarity.
Without trimming the left side:
And when left side trimming is enabled:
Multi-Session Customization: Support for up to 6 independent sessions, each with individual time ranges (HHMM-HHMM format), timezones, and enable/disable toggles, offers unparalleled flexibility. Traders can configure sessions for specific market phases (e.g., Asia: 2000-0000 UTC) and customize colors, line styles (solid, dashed, dotted), and label properties separately, ensuring a personalized setup for global trading environments.
Auto-Deletion at Market Close: Levels can be automatically deleted at the session's calculated market close (17:00 NY timestamp), keeping the chart clean for the next session or day, a useful feature for avoiding accumulation of outdated levels.
Label and Visual Controls: Users can toggle labels on/off, adjust text color, background color, transparency, and size (tiny, small, normal, large), with options to stick labels to the right for better visibility. This level of customization ensures the indicator integrates seamlessly with any chart style.
No External Dependencies: All calculations are performed using built-in Pine Script functions on the chart's price data, making it self-contained and reliable without needing external libraries or data sources.
Professional and Compliant Design: Developed to comply with TradingView House Rules, this indicator is original in its combination of multi-session plotting, directional OTE auto-detection, and left-side trimming, providing traders with a robust tool for ICT-based analysis.
How It Works
Session Setup: Define session times and timezones in settings; the script tracks high/low from session start.
Level Calculation: High/low update on every bar; EQ is the midpoint. OTE levels recalculate directionally upon new extremes.
Drawing Mechanism: Lines extend with user-defined padding; trimming cuts left side for cleanliness.
Update Logic: OTE direction shifts based on new high/low detection, with levels refreshed accordingly.
Deletion: Auto-deletes at session end if enabled, resetting for new sessions.
Uniqueness and Innovation
Session OTE Auto Detection: Automatically adjusts OTE direction based on new highs/lows, a feature not commonly available in other indicators, enabling hands-free bias identification.
Left-Side Trimming: Unique clutter-reduction tool that trims historical lines, improving chart readability—a rare capability in session-based indicators.
Multi-Session Support: Handles 6 sessions independently, with per-session OTE, making it a one-stop tool for global market analysis.
Directional OTE: Adapts to market bias, offering dynamic entry zones tailored to ICT strategies.
Full Customization: Extensive controls for visuals and behavior, ensuring adaptability to individual trading styles.
User Guide: How to Use the "ICT Multi-Session Hi/L/EQ" Indicator
This guide provides a comprehensive, step-by-step explanation of how to use the "ICT Multi-Session Hi/L/EQ" indicator on TradingView. The indicator is designed to help Inner Circle Trader (ICT) enthusiasts plot key price levels—High (H), Low (L), Equilibrium (EQ, the midpoint), and Optimal Trade Entry (OTE) levels at 61.8%, 70%, and 79% of the session range—across up to 6 customizable sessions. It also includes a Candle Open line for midnight or custom times. I'll break it down by settings groups, explaining each option, its purpose, how to tweak it, and tips for optimal use. All settings are accessible via the indicator's settings panel (cog icon next to the indicator name on your chart).
General Settings
These control global behaviors that apply to all sessions and levels. They allow you to customize the overall appearance and functionality of the indicator on your chart.
Line Padding (Bars Beyond Current): This integer input (default: 2, minimum: 0) extends the plotted lines beyond the current bar by the specified number of bars.
How to Use/Tweak: Increase this value (e.g., to 5) for longer forward projections of levels, useful for anticipating future price action. Decrease to 0 for no extension. It's ideal for traders who like to see levels projected ahead in volatile markets.
Tip: On lower timeframes (e.g., 5M), higher padding (4-6) helps visualize potential targets; on higher timeframes (1H), keep it low to avoid clutter.
Label Padding (Bars from Line End): An integer (default: 3, minimum: 0) that positions labels away from the end of the lines by the specified bars.
How to Use/Tweak: Adjust to move labels further right (higher value) or closer to the line end (lower value). This prevents label overlap with price action or other indicators.
Tip: If your chart has many labels, set to 5+ for better readability; use 1-2 for minimalistic setups.
Enable Left-Side Trimming: A boolean toggle (default: true) to trim lines from the left, limiting their historical extension.
How to Use/Tweak: Turn on to reduce chart clutter by showing only recent bars of the lines; turn off for full historical view. Pairs with "Left Trim Bars" for fine-tuning.
Tip: Enable for clean charts during live trading; disable for backtesting to see long-term patterns.
Left Trim Bars: An integer (default: 8, minimum: 1) specifying how many bars back from the current bar to trim lines when left trimming is enabled.
How to Use/Tweak: Set higher (e.g., 20) for more historical visibility while trimmed; lower (e.g., 4) for ultra-clean charts focusing on immediate action.
Tip: Use 8-12 for intraday trading on 15M charts; adjust based on timeframe to balance context and clarity.
Stick Labels to Right of Current Bar: A boolean toggle (default: true) to position labels at the right end of the lines.
How to Use/Tweak: Enable for labels to "stick" right, keeping them visible as the chart updates; disable for labels at the current bar position.
Tip: Keep enabled for real-time trading to avoid labels shifting left; disable for static analysis.
Delete Previous Session Lines/Labels on Market Close: A boolean toggle (default: true) to automatically delete session lines and labels at the calculated market close (17:00 NY time).
How to Use/Tweak: Enable to keep the chart clean by clearing old sessions; disable to retain historical levels for reference.
Tip: Enable for live trading to focus on active sessions; disable for educational reviews or backtesting.
Session 1 to 6 Settings
Each session has identical options, allowing independent configuration. I'll describe Session 1; replicate for others by changing the number (e.g., Session 2 uses "Session 2 Name", etc.).
Session Name: String input (default: "Asia" for Session 1) to label the session (e.g., "Asia" or "London").
How to Use/Tweak: Enter a descriptive name like "NY Open" for clarity in labels (e.g., "NY Open High").
Tip: Use short names to avoid long labels; this appears in all session labels for easy identification.
Session Time (HHMM-HHMM): Session input (default: "2000-0000" for Session 1) to define the start and end time.
How to Use/Tweak: Set the time range (e.g., "0930-1600" for NY session). Ensure start < end in 24-hour format.
Tip: Use for custom sessions like "London Kill Zone" (0800-1100); validate with the timezone setting.
Session Timezone: String selection (default: "America/New_York") from a list of options.
How to Use/Tweak: Choose the timezone matching your session (e.g., "Europe/London" for UK times).
Tip: Align with session name for accuracy; "Etc/UTC" for universal times.
Enable Session Drawings: Boolean toggle (default: true for Session 1, false for others) to activate the session's lines and labels.
How to Use/Tweak: Enable to show the session; disable to hide it without removing settings.
Tip: Enable one session at a time for focused analysis; use for multi-session overlays.
Enable EQ Line/Label: Boolean toggle (default: true) to show the EQ line and label.
How to Use/Tweak: Enable for midpoint plotting; disable to hide EQ while keeping high/low.
Tip: Useful for ICT fair value gaps; toggle off if focusing on extremes only.
Enable Labels: Boolean toggle (default: true) to show labels for high, low, EQ, and OTE levels.
How to Use/Tweak: Enable for annotated levels; disable for lines-only view.
Tip: Disable on crowded charts; customize label size for better readability.
Enable OTE Levels: Boolean toggle (default: false) to activate OTE levels (61.8%, 70%, 79%).
How to Use/Tweak: Enable for OTE plotting; disable to hide while keeping high/low/EQ.
Tip: Toggle on for entry zone identification; adjust colors for visual distinction.
Line Color: Color input (default varies by session, e.g., blue for Session 1) for lines.
How to Use/Tweak: Choose a color to differentiate sessions (e.g., green for bullish).
Tip: Use contrasting colors for multiple sessions; match your chart theme.
Line Style: String selection (default: "Dashed") from "Solid", "Dashed", "Dotted".
How to Use/Tweak: Select style for line appearance (e.g., dotted for OTE).
Tip: Use dashed for OTE to distinguish from solid high/low lines.
Label Text Color: Color input (default: white) for label text.
How to Use/Tweak: Set to contrast with background (e.g., black on white charts).
Tip: Use bright colors for visibility; match line color for cohesion.
Label Background Color: Color input (default: black) for label background.
How to Use/Tweak: Choose a semi-transparent background for readability.
Tip: Set to chart background color for subtle labels.
Label Transparency (0=opaque, 100=transparent): Integer input (default: 70) for label opacity.
How to Use/Tweak: Lower for solid labels (e.g., 0); higher for see-through (e.g., 90).
Tip: Use 50-80 for balance; 100 hides background entirely.
Label Text Size: String selection (default: "Small") from "Tiny", "Small", "Normal", "Large".
How to Use/Tweak: Choose size for label visibility (e.g., "Large" for emphasis).
Tip: "Small" for crowded charts; "Large" for main levels.
OTE 61.8% Color: Color input (default: purple) for 61.8% OTE line.
How to Use/Tweak: Customize to highlight the 61.8% level (e.g., gold for key entry).
Tip: Use distinct colors for each OTE level to differentiate (e.g., purple, orange, teal).
OTE 70% Color: Color input (default: orange) for 70% OTE line.
How to Use/Tweak: Set to a secondary color for mid-range OTE.
Tip: Coordinate with overall theme; use faded shades for less prominence.
OTE 79% Color: Color input (default: teal) for 79% OTE line.
How to Use/Tweak: Choose for the deepest OTE level (e.g., red for aggressive entries).
Tip: Make it stand out if 79% is your preferred entry zone.
Candle Open Settings
This section adds a custom open line (e.g., midnight open) with similar customization.
Use Time 1: Boolean toggle (default: true) to enable the first time setting.
How to Use/Tweak: Enable for the open line; disable to hide.
Tip: Use for midnight open in ICT setups; toggle off if not needed.
Name: String input (default: "Midnight Open") for the open line label.
How to Use/Tweak: Change to "Daily Open" or similar for context.
Tip: Keep short for clean labels.
Start Time: String input (default: "0000") for open range start.
How to Use/Tweak: Set in HHMM format (e.g., "0000" for midnight).
Tip: Ensure valid (0000-2359); pair with end time for narrow ranges.
End Time: String input (default: "0001") for open range end.
How to Use/Tweak: Set slightly after start (e.g., "0001") for precise open capture.
Tip: Use for quick ranges; start < end always.
Color: Color input (default: teal) for the open line.
How to Use/Tweak: Customize to distinguish from session lines.
Tip: Use gray for subtle open lines.
Timezone: String selection (default: "America/New_York") for the open line.
How to Use/Tweak: Choose matching your chart or session.
Tip: "Etc/UTC" for universal opens.
Enable Line/Label: Boolean toggle (default: true) for the open line/label.
How to Use/Tweak: Enable to show; disable to hide.
Tip: Use for daily opens in ICT; toggle off for session-only focus.
Enable Label: Boolean toggle (default: true) for the open label.
How to Use/Tweak: Enable for named label; disable for line-only.
Tip: Disable if labels clutter the chart.
Auto Delete at 18:00 NY: Boolean toggle (default: true) to delete at 18:00 NY.
How to Use/Tweak: Enable for cleanup; disable to retain.
Tip: Align with new day start; useful for resetting.
Stick Label to Right: Boolean toggle (default: true) for label positioning.
How to Use/Tweak: Enable for right-side labels; disable for current bar.
Tip: Keep enabled for visibility as chart updates.
Enable Left-Side Trimming: Boolean toggle (default: true) for open line trimming.
How to Use/Tweak: Enable to trim historical open line; disable for full view.
Tip: Similar to session trimming; use for clean charts.
Left Trim Bars: Integer input (default: 8) for open line trim bars.
How to Use/Tweak: Set the number of bars back to show when trimming.
Tip: Lower for more focus; higher for context.
Line Padding (Bars Beyond Current): Integer input (default: 2) for open line extension.
How to Use/Tweak: Increase for forward projection; decrease for no extension.
Tip: Match general padding for consistency.
Label Padding (Bars from Line End): Integer input (default: 3) for open label position.
How to Use/Tweak: Adjust to move label away from line end.
Tip: Higher for spaced labels; lower for compactness.
Line Style: String selection (default: "Solid") for open line style.
How to Use/Tweak: Choose "Dashed" or "Dotted" for distinction.
Tip: Use dotted for subtle opens.
Label Text Color: Color input (default: white) for open label text.
How to Use/Tweak: Set to contrast with background.
Tip: Black for light charts.
Label Background Color: Color input (default: black) for open label background.
How to Use/Tweak: Customize for visibility.
Tip: Semi-transparent for blend.
Label Transparency: Integer input (default: 70) for open label opacity.
How to Use/Tweak: 0 for opaque; 100 for transparent.
Tip: 50-80 for balance.
Label Text Size: String selection (default: "Small") for open label size.
How to Use/Tweak: "Large" for emphasis; "Tiny" for minimalism.
Tip: "Normal" for standard use.

[ICT Sebo] SessionOverview
This indicator visualizes the Asia, London and New York trading sessions and tracks each session’s high, low and midpoint in real time. It highlights key session phases and monitors how price interacts with prior session liquidity levels across subsequent sessions.
The script is designed as a session structure and liquidity context tool and does not generate trade signals.
How it works
The indicator uses a daylight-saving-time-aware New York timezone to ensure accurate session alignment throughout the year. Each trading session is defined by its start and end time and is highlighted directly on the chart.
During an active session, the script continuously updates the session high, session low and midpoint. These levels are extended forward into later sessions to observe how price reacts to previous session ranges.
For each session, the first third of its duration is calculated and visually highlighted, allowing traders to focus on early-session price behavior.
Session interaction logic
The indicator monitors when price touches or trades through highs and lows from previous sessions. For example, Asia session highs and lows are tracked during the London and New York sessions, and London session highs and lows are tracked during the New York session.
Once a session level is touched, it is locked and will not trigger repeated events.
Alerts
Alerts are generated when price touches a session high or low during a subsequent session. These alerts allow traders to monitor potential liquidity interactions without watching the chart continuously.
The following alert events are supported:
Asia session high or low touched during the London session
Asia session high or low touched during the New York session
London session high or low touched during the New York session
Alerts are triggered only once per level to avoid duplicate notifications.
Visualization
Each session is color-coded and displayed with a background highlight. Session highs, lows and midpoints are drawn as horizontal levels and extended forward for reference.
The first third of each session is highlighted with a shaded box to emphasize early-session structure.
Intended use
This tool supports session-based market analysis, liquidity mapping and time-of-day context evaluation. It is suitable for intraday analysis and should be used in combination with broader market context and risk management.
Notes
This indicator does not predict price direction, does not provide entry or exit signals and is intended purely as a visual and analytical reference.

Session ModelSessionModel.pine - Indicator Overview
Purpose: A deterministic session model indicator that identifies trading sessions (Asian, London, NY), builds range levels from specific time windows, detects price action states (Range → Sweep → Displacement → Rebalance), and tracks divergences across 3 index symbols.
Key Feature: Uses a fixed internal timeframe (engineTF) for all decision logic, ensuring identical results regardless of what chart timeframe you're viewing.
---
HUD Display Rows - Explanations
1. SESSION
- Values: ASIAN | LONDON | NY | WAITING
- Meaning: Which trading session is currently active
- Why it matters: Each session uses different range references (ASIAN uses NY PM range, LONDON uses Asia range, NY uses London or ORB range)
2. STATE
- Values: Range | Sweep | Displacement | Rebalance
- Meaning: Current phase of the price action state machine
- Why it matters:
- Range: Building session extremes, awaiting price structure break
- Sweep: Price penetrated range boundary and closed back inside (rejection)
- Displacement: Directional move away from the range (trend confirmation)
- Rebalance: Retracement within displacement zone before resuming direction
3. CORRELATION (SMT)
- Values: Bull | Bear | Neutral
- Color: Green (Bull) | Red (Bear) | Orange (Neutral)
- Meaning: Smart Money divergence detection between US500, US100, US30
- Why it matters:
- Bull: At least one index makes new LOW but NOT all (weak shorts = bullish)
- Bear: At least one index makes new HIGH but NOT all (weak longs = bearish)
- Neutral: All indices move same direction OR insufficient window data
4. RANGE H (Range High)
- Values: Price level or "-" (not set)
- Color: Red (matching input.color rangeHighColor)
- Meaning: The highest price reached during the active range window
- Why it matters: Upper boundary for sweep detection and displacement measurement
5. RANGE L (Range Low)
- Values: Price level or "-" (not set)
- Color: Green (matching input.color rangeLowColor)
- Meaning: The lowest price reached during the active range window
- Why it matters: Lower boundary for sweep detection and displacement measurement
6. SWEEP
- Values: High | Low | "-" (not in sweep)
- Color: Yellow (if sweeping) | Gray (if not)
- Meaning: Direction of the current sweep if state == 2
- Why it matters:
- High: Price broke above range high and closed back below (bearish rejection)
- Low: Price broke below range low and closed back above (bullish rejection)
- Shows which boundary was "swept" and rejected
7. DISP DIR (Displacement Direction)
- Values: Bullish | Bearish | "-" (not displacing)
- Color: Green (Bullish) | Red (Bearish) | Gray (Not active)
- Meaning: Direction of the current displacement move (state == 3 or 4)
- Why it matters: Confirms directional bias during displacement phase
- Bullish: Price displaced above range after sweeping low
- Bearish: Price displaced below range after sweeping high
8. LEG 50% (Displacement 50% Retracement)
- Values: Price level or "-" (not set)
- Color: Cyan/Aqua
- Meaning: 50% retracement level between displacement origin and extreme
- Formula: displacementOrigin + (displacementExtreme - displacementOrigin) * 0.5
- Why it matters:
- Key retracement zone during displacement and rebalance phases
- Often acts as resistance (if bullish displacement) or support (if bearish)
- Used in rebalance trigger logic
---
How to Read the HUD Together
Example 1: Waiting for Entry
Session: NY
State: Range
Correlation: Neutral
Range H: 4050.25
Range L: 4040.50
Sweep: -
Disp Dir: -
Leg 50%: -
→ NY session active, building range. No sweep yet, no displacement. Waiting for price action.
Example 2: Sweep Detected
Session: NY
State: Sweep
Correlation: Neutral
Range H: 4050.25
Range L: 4040.50
Sweep: Low
Disp Dir: -
Leg 50%: -
→ Price swept below range low (rejected), now countdown timer running. Likely reversal coming.
Example 3: In Displacement
Session: NY
State: Displacement
Correlation: Bull
Range H: 4050.25
Range L: 4040.50
Sweep: Low
Disp Dir: Bullish
Leg 50%: 4060.75
→ After sweeping low, price displaced bullish. SMT confirming (bull divergence on indices). 50% at 4060.75 is key retracement zone.

CRYPTO MARKET SESSION ANALYZER INDICATORCrypto Market Session Analyzer is an easy-to-use yet powerful analysis tool that helps the trader visualize and analyze price movements over three different trading sessions:
1) European Session
2) US session
3) Asian session
Automatically tracks the corresponding levels for each market session.
This indicator can be used on all timeframes equal to or less than 15 minutes.
Although this is a simple indicator to use, some care must be taken when using it. The trader must be careful to set the correct times for each session according to his UTC timezone. By default the indicator uses UTC. If your console is set to UTC + 2 for example, you will need to take this into account and align the times correctly. You can adjust the time for each session from the user interface. Following the example, if the opening of the UE session is set to 9 and UTC of your console is set to UTC + 2, the script will proceed to create the level at opening time 11.
HOW IT WORK
The indicator automatically draws a horizontal line at the open and a horizontal line at the close of each session. The indicator clears past support and resistance every 24 hours to provide a clean and easy-to-read chart, updating new levels session after session.
Blue indicates the EU session.
Orange indicates the US session.
Purple indicates the Asian session.

PT SessionsVersion 1.0 -
The sessions indicator helps you separate Asia, London & NY trading zones. We found it very useful to identify each session for scalping benefits.
The main strategy to this indicator is to scalp long/short at each sessions open/close where we suspect volatility to be at its peek. The high/low of each session is usually put in at the open/close of the zone. This helps set the tone for the upcoming sessions & more so for the full day. This indicator works well for FX and Crypto but was built specifically around crypto volatility times.
If you are interested in using our version of the PT Sessions , shoot us a message!
KillZones Hunt + Sessions [TradingFinder] Alert & Volume Ranges🟣 Introduction
🔵 Session
Financial markets are divided into various time segments, each with its own characteristics and activity levels. These segments are called sessions, and they are active at different times of the day.
The most important active sessions in financial markets are :
1. Asian Session
2. European Session
3. New York Session
The timing of these major sessions based on the UTC time zone is as follows :
1. Asian Session: 23:00 to 06:00
2. European Session: 07:00 to 16:30
3. New York Session: 13:00 to 22:00
Note
To avoid overlap between sessions and interference in kill zones, we have adjusted the session timings as follows :
• Asian Session: 23:00 to 06:00
• European Session: 07:00 to 14:25
• New York Session: 14:30 to 22:55
🔵 Kill Zones
Kill zones are parts of a session where trader activity is higher than usual. During these periods, trading volume increases and price fluctuations are more intense.
The timing of the major kill zones based on the UTC time zone is as follows :
• Asian Kill Zone: 23:00 to 03:55
• European Kill Zone: 07:00 to 09:55
• New York Morning Kill Zone: 14:30 to 16:55
• New York Evening Kill Zone: 19:30 to 20:55
This indicator focuses on tracking the kill zone and its range. For example, once a kill zone ends, the high and low formed during it remain unchanged.
If the price reaches the high or low of the kill zone while the session is still active, the corresponding line is not drawn any further. Based on this information, various strategies can be developed, and the most important ones are discussed below.
🟣 How to Use
There are three main ways to trade based on the kill zone :
• Kill Zone Hunt
• Breakout and Pullback to Kill Zone
• Trading in the Trend of the Kill Zone
🔵 Kill Zone Hunt
According to this strategy, once the kill zone ends and its high and low lines no longer change, if the price reaches one of these lines within the same session and is strongly rejected, a trade can be entered.
🔵 Breakout and Pullback to Kill Zone
According to this strategy, once the kill zone ends and its high and low lines no longer change, if the price breaks one of these lines strongly within the same session, a trade can be entered on the pullback to that level.
Trading in the Trend of the Kill Zone
We know that kill zones are areas where high-volume trading occurs and powerful trends form. Therefore, trades can be made in the direction of the trend. For example, when an upward trend dominates this area, you can enter a buy trade when the price reaches a demand order block.
🟣 Features
🔵 Alerts
You can set alerts to be notified when the price hits the high or low lines of the kill zone.
🔵 More Information
By enabling this feature, you can view information such as the time and trading volume within the kill zone. This allows you to compare the trading volume with the same period on the previous day or other kill zones.
🟣 Settings
Through the settings, you have access to the following options :
• Show or hide additional information
• Enable or disable alerts
• Show or hide sessions
• Show or hide kill zones
• Set preferred colors for displaying sessions
• Customize the time range of sessions
• Customize the time range of kill zones

Session Based Liquidity# Session Based Liquidity Indicator - Educational Open Source
## 📊 Overview
The Session Based Liquidity indicator is a comprehensive educational tool designed to help traders understand and visualize liquidity concepts across major trading sessions. This indicator identifies Buy-Side Liquidity (BSL) and Sell-Side Liquidity (SSL) levels created during Asia, London, and New York trading sessions, providing insights into institutional order flow and potential market reversal zones.
## 🎯 Key Features
### 📈 Multi-Session Tracking
- **Asia Session**: Tokyo/Sydney overlap (20:00-02:00 EST)
- **London Session**: European markets (03:00-07:30 EST)
- **New York Session**: US markets (09:30-16:00 EST)
- Individual session toggle controls for focused analysis
### 💧 Liquidity Level Detection
- **Buy-Side Liquidity (BSL)**: Identifies stop losses above swing highs where short positions get stopped out
- **Sell-Side Liquidity (SSL)**: Identifies stop losses below swing lows where long positions get stopped out
- Advanced filtering algorithm to identify only significant liquidity zones
- Configurable pivot strength for sensitivity adjustment
### 🎨 Visual Management System
- **Unclaimed Levels**: Active liquidity zones that haven't been hit (default: black lines)
- **Claimed Levels**: Swept liquidity zones showing historical interaction (default: red lines)
- Customizable line styles, colors, and widths for both states
- Dynamic label system showing session origin and level significance
- Real-time line extension and label positioning
### ⚙️ Advanced Configuration
- **Pivot Strength**: Adjust sensitivity (1-20) for liquidity detection
- **Max Levels Per Side**: Control number of tracked levels (1-10) per session
- **Label Offset**: Customize label positioning
- **Style Customization**: Full control over visual appearance
## 📚 Educational Value
### Core Concepts Explained
- **Liquidity Pools**: Areas where stop losses and pending orders cluster
- **Liquidity Sweeps**: When price moves through levels to trigger stops, then reverses
- **Session-Based Analysis**: How different market sessions create distinct liquidity characteristics
- **Institutional Order Flow**: Understanding how large players interact with retail liquidity
### Trading Applications
- Identify high-probability reversal zones after liquidity sweeps
- Understand where stop losses are likely clustered
- Avoid trading into obvious liquidity traps
- Use session context for timing entries and exits
- Recognize institutional accumulation and distribution patterns
### Code Learning Opportunities
- **Pine Script v6 Best Practices**: Modern syntax and efficient coding patterns
- **Object-Oriented Design**: Custom types and methods for clean code organization
- **Array Management**: Dynamic data structure handling for performance
- **Visual Programming**: Line, label, and styling management
- **Session Detection**: Time-based filtering and timezone handling
## 🔧 Technical Implementation
### Performance Optimized
- Efficient memory management with automatic cleanup
- Limited historical level tracking to maintain responsiveness
- Optimized array operations for smooth real-time updates
- Smart filtering to reduce noise and focus on significant levels
### Code Architecture
- **Modular Design**: Clean separation of concerns with dedicated methods
- **Type Safety**: Custom SessionLiquidity type for organized data management
- **Extensible Structure**: Easy to modify and enhance for specific needs
- **Educational Comments**: Comprehensive documentation throughout
## 💡 Usage Guide
### Basic Setup
1. Add indicator to chart
2. Configure session times for your timezone
3. Adjust pivot strength based on timeframe (higher for lower timeframes)
4. Enable/disable sessions based on your trading focus
### Interpretation
- **Unclaimed levels**: Watch for price interaction and potential reversals
- **Claimed levels**: Use as potential support/resistance after sweep
- **External levels**: Beyond session range, higher significance
- **Internal levels**: Within session range, may indicate ranging conditions
### Best Practices
- Use higher timeframes (15m+) for cleaner signals
- Combine with price action analysis for confirmation
- Consider session overlap periods for increased significance
- Monitor multiple sessions for comprehensive market view
## 🎓 Educational Goals
This open-source project aims to:
- Demystify liquidity concepts for retail traders
- Provide practical coding examples in Pine Script v6
- Encourage understanding of institutional trading behavior
- Foster community learning and collaboration
- Bridge the gap between theory and practical application
## 📄 License & Usage
Released under Mozilla Public License 2.0 - free for educational and commercial use with proper attribution.
## 🤝 Contributing
As an open-source educational tool, contributions are welcome! Whether it's bug fixes, feature enhancements, or educational improvements, your input helps the trading community learn and grow.
## ⚠️ Disclaimer
This indicator is for educational purposes only. All trading involves risk, and past performance does not guarantee future results. Always practice proper risk management and never risk more than you can afford to lose.
---
*By studying and using this indicator, traders can develop a deeper understanding of market microstructure and improve their ability to read institutional order flow patterns.*

TCP | Market Session | Session Analyzer📌 TCP | Market Session Indicator | Crypto Version
A powerful, real-time market session visualization tool tailored for crypto traders. Track the heartbeat of Asia, Europe, and US trading hours directly on your chart with live session boxes, behavioral analysis, liquidity grab detection, and countdown timers. Know when the action starts, how the market behaves, and where the traps lie.
🔰 Introduction:
Trade the Right Hours with the Right Tools
Time matters in trading. Most significant moves happen during key sessions—and knowing when and how each session unfolds can give you a sharp edge. The TCP Market Session Indicator, developed by Trade City Pro (TCP), puts professional session tracking and behavioral insights at your fingertips.
Whether you're a scalper or swing trader, this indicator gives you the timing context to enter and exit trades with greater confidence and clarity.
🕒 Core Features
• Live Session Boxes :
Highlight active ranges during Asia, Europe, and US sessions with dynamic high/low updates.
• Session Start/End Labels :
Know exactly when each session begins and ends plotted clearly on your chart with context.
• Session Behavior Analysis :
At the end of each session, the indicator classifies the price action as:
- Trend Up
- Trend Down
- Consolidation
- Manipulation
• Liquidity Grab Detection: Automatically detects possible stop hunts (fake breakouts) and marks them on the chart with precision filters (volume, ATR, reversal).
• Session Countdown Table: A live dashboard showing:
- Current active session
- Time left in session
- Upcoming session and how many minutes until it starts
- Utility time converter (e.g. 90 min = 01:30)
• Vertical Session Lines: Visualize past and upcoming session boundaries with customizable history and future range.
• Multi-Day Support: Draw session ranges for previous, current, and future days for better backtesting and forecasting.
⚙️ Settings Panel
Customize everything to fit your trading style and schedule:
• Session Time Settings:
Set the opening and closing time for each session manually using UTC-based minute inputs.
→ For example, enter Asia Start: 0, Asia End: 480 for 00:00–08:00 UTC.
This gives full flexibility to adjust session hours to match your preferred market behavior.
• Enable or Disable Elements:
Toggle the visibility of each session (Asia, Europe, US), as well as:
- Session Boxes
- Countdown Table
- Session Lines
- Liquidity Grab Labels
• Timezone Selection:
Choose between using UTC or your chart’s local timezone for session calculations.
• Customization Options:
Select number of past and future days to draw session data
Adjust vertical line transparency
Fine-tune label offset and spacing for clean layout
📊 Smart Session Boxes
Each session box tracks high, low, open, and close in real time, providing visual clarity on market structure. Once a session ends, the box closes, and the behavior type is saved and labeled ideal for spotting patterns across sessions.
• Asia: Green Box
• Europe: Orange Box
• US: Blue Box
💡 Why Use This Tool?
• Perfect Timing: Don’t get chopped in low-liquidity hours. Focus on sessions where volume and volatility align.
• Pattern Recognition: Study how price behaves session-to-session to build better strategies.
• Trap Detection: Spot manipulation moves (liquidity grabs) early and avoid common retail pitfalls.
• Macro Session Mapping: Use as a foundational layer to align trades with market structure and news cycles.
🔍 Example Use Case
You're watching BTC at 12:45 UTC. The indicator tells you:
The Asia session just ended (label shows “Asia Session End: Trend Up”)
Europe session starts in 15 minutes
A liquidity grab just triggered at the previous high—label confirmed
Now you know who’s active, what the market just did, and what’s about to start—all in one glance.
✅ Why Traders Trust It
• Visual & Intuitive: Fully chart-based, no clutter, no guessing
• Crypto-Focused: Designed specifically for 24/7 crypto markets (not outdated forex models)
• Non-Repainting: All labels and boxes stay as printed—no tricks
• Reliable: Tested across multiple exchanges, pairs, and timeframes
🧩 Built by Trade City Pro (TCP)
The TCP Market Session Indicator is part of a suite of professional tools used by over 150,000 traders. It’s coded in Pine Script v6 for full compatibility with TradingView’s latest capabilities.
🔗 Resources
• Tutorial: Learn how to analyze sessions like a pro in our TradingView guide:
"TradeCityPro Academy: Session Mapping & Liquidity Traps"
• More Tools: Explore our full library of indicators on

Enhanced Market Sessions Indicator by NomadTradesEnhanced Market Sessions Indicator by NomadTrades
Summary
The Enhanced Market Sessions Indicator is a comprehensive trading tool that automatically identifies and marks the high and low price levels for Asia, London, and New York trading sessions. This indicator goes beyond basic session marking by extending previous session levels into the NY session as key support/resistance zones and providing real-time price interaction alerts when these levels are touched.
**Important Setup Notes:**
- **Update Your Timezone**: Ensure you select the correct timezone in the indicator settings to match your trading preferences
- **Verify Session Times**: Double-check that the default session times align with your market analysis requirements, as market hours may vary due to seasonal changes or regional differences
Key Features
**Session Tracking & Visualization**
- **Automatic Session Detection**: Identifies Asia (2300-0800), London (0800-1330), and New York (1430-2100) sessions
- **High/Low Marking**: Draws solid horizontal lines showing each session's highest and lowest price points
- **Color-Coded System**: Distinct colors for each session (Red for Asia, Blue for London, Green for NY)
- **Session Labels**: Clear price labels showing exact high/low values for easy reference
**Advanced Level Extension**
- **Smart Line Extension**: Automatically extends Asia and London session levels into the NY session as dashed lines
- **Key Level Identification**: Transforms previous session levels into actionable support/resistance zones
- **Visual Distinction**: Extended lines use transparent, dashed styling to differentiate from active session boundaries
**Real-Time Alert System**
- **Price Interaction Alerts**: Sends TradingView notifications when price touches Asia or London levels during NY session
- **Customizable Tolerance**: Adjustable touch sensitivity (0.01% to 1.0%) for precise interaction detection
- **Visual Confirmation**: Displays colored labels on chart when price interactions occur
- **Duplicate Prevention**: Smart logic prevents multiple alerts for the same level touch
**Customization & Control**
- **Lookback Period**: Control how many days of historical sessions to display (1-30 days)
- **Timezone Flexibility**: Support for all major timezones (UTC-12 to UTC+12)
- **Session Toggle**: Individual on/off switches for each session display
- **Color Customization**: Full color control for all session lines and labels
- **Clean Interface**: Organized input groups for easy configuration
**Chart Behaviour**
- **Fixed Positioning**: Lines remain anchored to time positions when dragging or scrolling the chart
- **Professional Appearance**: Matches the behaviour of manually drawn horizontal lines
- **Performance Optimized**: Efficient rendering with proper line and label limits
- **Multi-Timeframe Support**: Works reliably across all chart timeframes
**Alert Configuration Options**
- **Script Alerts**: Use "Any alert() function call" for comprehensive notifications
- **Individual Conditions**: Separate alert conditions for granular control
- **Flexible Notifications**: Compatible with mobile app, email, and desktop alerts
- **Session-Specific Logic**: Alerts only trigger during NY session for relevant level interactions
This indicator is perfect for traders who focus on session-based analysis, ICT concepts, and multi-session support/resistance strategies. The combination of visual clarity, automated alerts, and professional chart behaviour makes it an essential tool for serious forex and index traders.

BB Session RangesBB Session Ranges Indicator
Overview
The Bender Bot Session Ranges indicator is a powerful tool for traders who want to visualize and analyze important market sessions throughout the trading day. This indicator identifies and tracks price ranges during specific time periods, helping you spot potential trading opportunities based on session breakouts, retests, and range comparisons.
Key Features
• Multiple Session Tracking: Monitor up to 6 different time-based ranges simultaneously (pre-configured for NY AM Open, NY PM Open, Lunch, Premarket, Midnight Open, and a custom session).
• Range Visualization: Clearly displays high and low boundaries for each session with customizable colors and line styles.
• Historical Comparison: Tracks and displays the average size of ranges over time, helping you identify when current ranges are larger or smaller than typical.
• Flexible Time Settings: Easily configure exact session times based on your trading schedule and preferred markets.
• Range Extension Options: Extend range boundaries by bars, days, or weeks to track the longer-term influence of session ranges.
• Sidecar Information Display: Optional labels show range details, including size, percentage of average, and dollar value.
How It Works
The indicator identifies specific time-based sessions (for example, the first 5 minutes of the NY market open) and tracks the high and low prices established during these periods. Once a session is complete, the range boundaries are plotted on your chart and can be extended for further analysis. The indicator calculates the current range size and compares it to historical averages, giving you context for the day’s market behavior.
Sidecar Functionality
The sidecar feature is a key aspect of this indicator that helps keep your charts clean and organized. Instead of cluttering your price action with labels and annotations directly on the ranges, the sidecar system:
• Creates a dedicated information panel offset from the price action.
• Connects to ranges with discreet connecting lines.
• Displays key statistics like range size, dollar value, and percentage of average.
• Can be positioned at custom distances from the main chart (measured in bars).
• Allows you to see important data without interfering with your price analysis.
• Can be completely disabled when you prefer minimal chart elements.
• Helps maintain visual clarity even when tracking multiple sessions simultaneously.
This design philosophy puts trader experience first by separating information display from price action analysis, giving you the best of both worlds: clean charts and detailed information.
Setup Guide
1. Choose Your Sessions: Enable or disable each of the six available ranges by setting the Max Ranges to Plot parameter (use 0 to disable a range).
2. Configure Session Times: Set exact times for each range using standard 24-hour format (for example, 0930-0935 for 9:30-9:35 AM).
3. Customize Display: Select colors, line widths, and information display options for each range.
4. Set Extension Parameters: Choose how far to extend range lines (by a number of bars, days, or weeks, or select Always for continuous extension).
5. Configure Sidecar Labels: Set the offset for the information displays (use 0 to disable sidecar labels entirely).
Trading Applications
• Identify potential support and resistance levels based on session highs and lows.
• Compare current session ranges to historical averages to gauge volatility.
• Look for breakouts from established session ranges.
• Use range extensions to anticipate potential price targets.
• Monitor multiple session ranges to identify pattern correlations.
Advanced Usage
The indicator includes fields that help you assess range size relative to past performance, including dollar value calculations. This can be particularly useful for position sizing and risk management when trading breakouts from these ranges.
Future Development
We’re actively working on expanding this indicator to include robust strategy and alert functionality. This will allow traders to:
• Backtest trading strategies based on session range breakouts and retests.
• Customize entry, exit, and risk management parameters.
• Receive real-time alerts when price interacts with significant range levels.
• Set conditional alerts based on range size compared to historical averages.
• Automate trading decisions based on your specific session-based criteria.
If these strategy and alert features would be valuable for your trading, please let us know in the comments. Your feedback directly influences our development priorities and helps us create tools that best serve the trading community.
Notes
• All times are based on the America/New_York timezone.
• The indicator dynamically adjusts to different timeframes, providing consistent results whether you’re viewing 1-minute or daily charts.
• Range calculations are based on the highs and lows established during the defined sessions.
All Forex Sessions in One Script OnlyDraws all Forex Sessions:
*it works only with forex*
These Sessions can show Daily Highs and Lows:
- Pre-London / London
- Pre-New York / New York
It's possible to hide Highs and Lows having full background for these sessions
Daily Session Breaks
- Mondays use a different color
- Asian Boxes every day
- All Sessions Ranges/Colors are editable
-All elements (pre-London/London/Pre-New York/New York/Asian Boxes/Session Breaks) can be switched off independently

Institutional Session VWAP Bands (Zeiierman)█ Overview
Institutional Session VWAP Bands (Zeiierman) plots a clean, session-aware VWAP that restarts at the “True Close” (end of the first trading hour) for each session you enable (Sydney, Tokyo, London, New York). From that anchor, the script computes a classic volume-weighted average price plus optional standard-deviation bands to frame session fair value and dispersion.
By aligning VWAP to when institutional flows settle (the first hour), you get a reference that matches real execution behavior, yielding more credible pullbacks, retests, and mean-reversion reads inside each session.
█ How It Works
⚪ Session Detection
You choose the sessions (on/off), their UTC-aligned time windows, and colors. The script detects when each session is active on your chart timeframe.
⚪ True-Close Anchoring
At session open the indicator waits. When the first hour completes, it flips the anchor on and starts a fresh VWAP for that session, mirroring how many desks treat the first hour as the real close for the prior day’s positioning.
⚪ VWAP Core
From the true-close anchor, VWAP is calculated in the standard way: cumulative (price × volume) / cumulative volume using your chosen price source (default hlc3).
⚪ VWAP Bands (σ)
Upper/Lower bands are built using a running standard deviation of the price source since the anchor. You control the σ multiplier and line width, and you can optionally fill between the bands.
█ Why Sessions + True-Close Anchoring
⚪ Institutional Timing Matters
A new anchor at the first-hour close reflects where real flows have settled, giving you a session fair-value line that aligns with how many funds evaluate prices intraday.
⚪ Cleaner Session Reads
Because VWAP and σ-bands restart each session, your retests, squeezes, and mean-reversion signals are based on today’s order-flow context, not yesterday’s inertia.
Result: a session-true fair-value with dispersion bands that stay close to the action, improving the quality of pullback entries and risk framing.
█ How to Use
⚪ Session Fair-Value Guide
Treat VWAP as the magnet for intraday value. Impulsive moves away from VWAP that fold back often present retest opportunities.
⚪ σ-Band Reversion & Breaks
Reversion: Tests beyond the upper/lower band that snap back inside can flag exhaustion.
Trend: Price riding the VWAP band in a strong trend
⚪ Session Handoffs
When one session hands to the next, watch how price behaves around the new session’s VWAP Bands after its anchor triggers. Continuation through the new VWAP vs. rejection often sets the tone.
█ Settings
UTC: Choose the timezone used to evaluate session windows (e.g., UTC+2).
Sessions (Sydney, Tokyo, London, New York): Toggle visibility and define each HHMM-HHMM window.
VWAP Price: Source for weighting.
Band Multiplier (σ): Standard deviation multiplier.
█ Related publications
True Close – Institutional Trading Sessions (Zeiierman)
-----------------
Disclaimer
The content provided in my scripts, indicators, ideas, algorithms, and systems is for educational and informational purposes only. It does not constitute financial advice, investment recommendations, or a solicitation to buy or sell any financial instruments. I will not accept liability for any loss or damage, including without limitation any loss of profit, which may arise directly or indirectly from the use of or reliance on such information.
All investments involve risk, and the past performance of a security, industry, sector, market, financial product, trading strategy, backtest, or individual's trading does not guarantee future results or returns. Investors are fully responsible for any investment decisions they make. Such decisions should be based solely on an evaluation of their financial circumstances, investment objectives, risk tolerance, and liquidity needs.

Trading session High/Low (Lumiere)Trading session High/Low
What it does:
Plots the High and Low for each session (Asia, London, New York) as horizontal zones that “snap” to the first true extreme of the session and then extend right.
Key points:
Snap‑to‑extreme only: Lines don’t draw at the open; they appear only once price makes a new session high or low, and anchor exactly at that bar.
Persistent until next session: Once drawn, each session’s lines stay on the chart after the session ends, and are cleared only when that same session next opens (or when you hide it).
Three configurable sessions:
Asia: 18:00–03:00 (UTC‑4)
London: 03:00–09:30 (UTC‑4)
New York: 09:30–16:00 (UTC‑4)
Customizable appearance:
You can toggle each session on/off, choose its color, and set line width.
The time that is already set on the different sessions is based on the standard session open/close. If you want to change it, it will refer to the NY time, UTC -4.
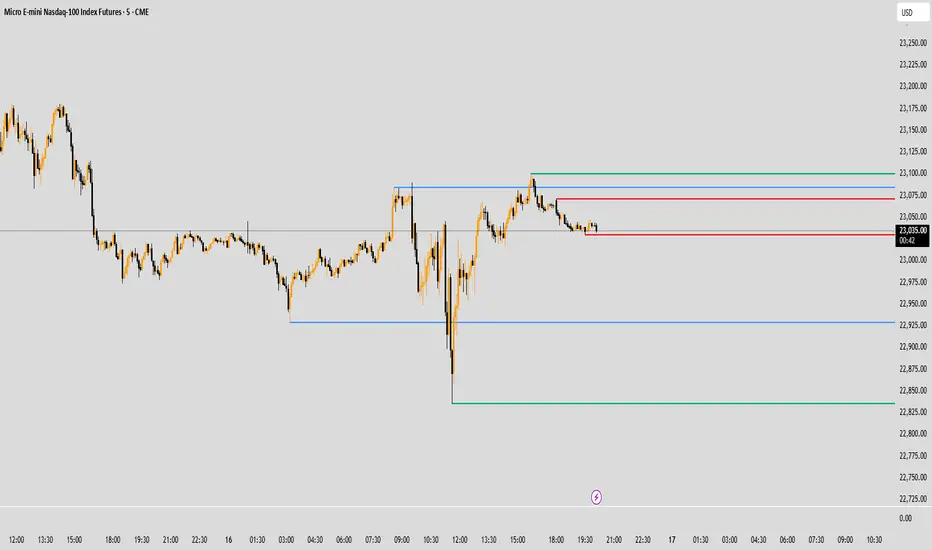
Simple SessionsThis is a simple sessions indicator that allows you to highlight up to 3 different sessions on your chart. This is intended for charts in any timeframe lower than the Daily timeframe. Really simple, clean, and minimalistic on purpose, intended to help and not clutter the chart.
Options/parameters:
Sessions: Check and setup beginning and end of the sessions. Up to 3 sessions at the same time.
Enable specific timezone: You can specify your exact timezone so that the sessions stay consistent even when you’re viewing different assets from different brokers that might be providing the price data in different timezones.
Show next day: Check to allow for your sessions to be viewed in advance for the following day so that you can expect your trading session in the chart (something simple, but quite useful).
Show next day input also accepts an integer value (default at 0). This numeric value is useful only for a few different assets that don’t have price data (aren’t tradable) 24 hours of each week-day. When that’s the case the calculation to show the session in the future day is not precise so with this number you can adjust it. For example, on OANDA:SPX500USD in the 30m time-frame, between 5pm and 6pm NY time there’s no price data. If you check that chart on any day at 4:30pm NY time, the next bar should be at 5pm, however since there’s no data it jumps to 6pm NY time. For that example you can set the input number to -2 and it will move the sessions to the correct time window you specified in the Sessions input.
Optional comment: This is a comment that will be shown in the status line. There’s no other use for this. It’s only helpful when you have multiple instances of the indicator for different assets for example. In that case with this comment you would be able to instantly detect which indicator is for which chart.
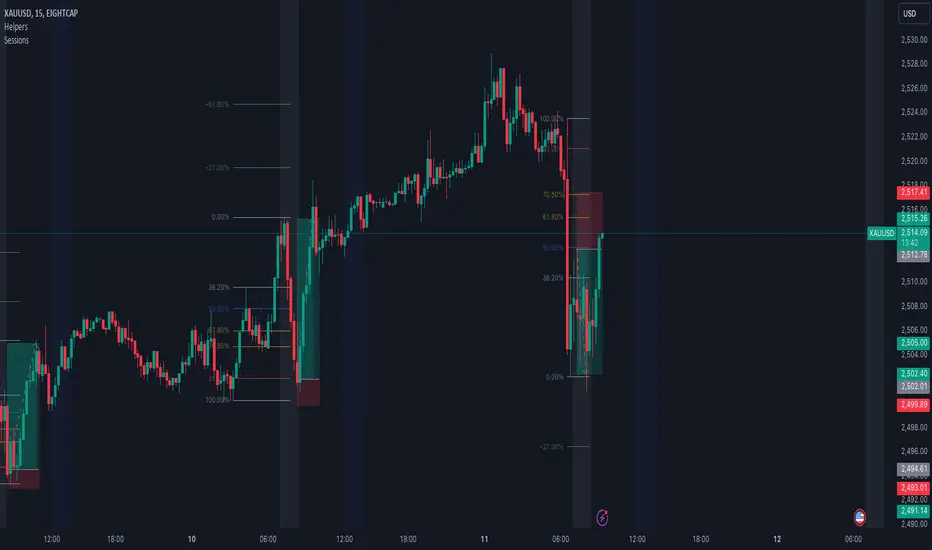
Crypto Trade Sessions-By Blackwolf for Bitfinex 00:00-24:00 v2.0This script shows the graph with 3 different trading sessions: Asia, Europe and America. It also shows the start and end of the day from midnight to midnigh and is configured for Rome time for Bitfinex
Lo script mostra le 3 sessioni di trading: Asia Europa ed America. Inoltre mostra la suddivisione dei giorni da mezzanotte a mezzanotte utilizzando il fuso orario di Roma
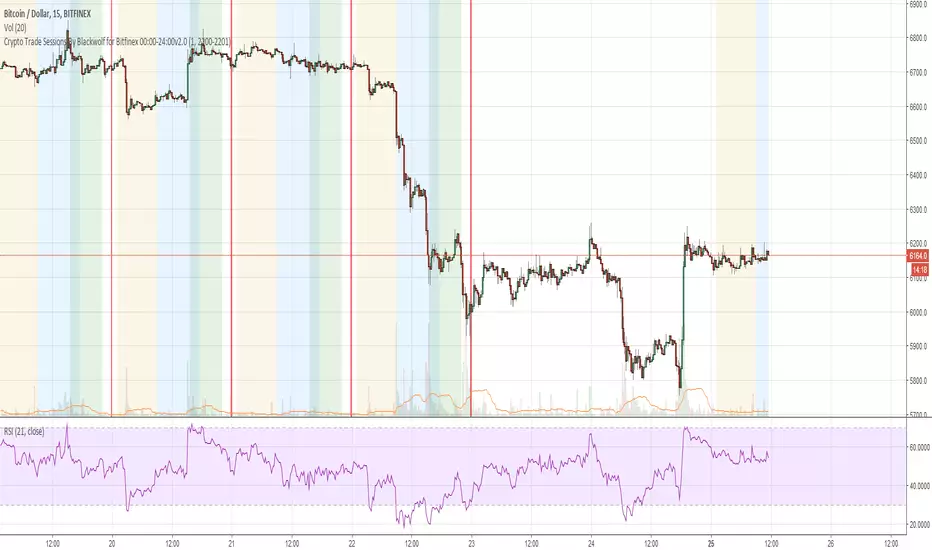
Session HighlighterSession Highlighter Script
This Pine Script highlights the major trading sessions on your chart with distinct background colors and markers:
- Asian Session: From 22:00 to 06:00 UTC (Tokyo Open to Close), highlighted in blue.
-European Session: From 07:00 to 15:00 UTC (London Open to Close), highlighted in green.
-U.S. Session: From 13:00 to 21:00 UTC (New York Open to Close), highlighted in red.
Features:
- Background Colors: Different colors indicate the active trading session.
- Markers: Displays labels or shapes at the start of each session to show session changes.
Usage:
- Helps visualize trading session overlaps and market activity throughout the day.
- Ideal for identifying session-specific trends and planning trading strategies.
This script ensures that you can easily see when each major trading session starts and ends, allowing for better market timing and analysis.
