Main Market Opener Breakout [RH]Based on my observations while analyzing the crypto and forex charts, particularly BTCUSDT and EURUSD, I have noticed that the prices exhibit significant movements during most stock market sessions, particularly during New York main market session.
With the aim of capturing these moves, I embarked on extensive research. Through this research, I discovered that by considering the very first "15m" or "30m" candle of the main market trading session and marking that first candle's high and low points, we can create potential trigger points.
A break above the high point indicates a bullish signal, while a break below the low point suggests a bearish signal. To further refine our analysis and filter out some noise, we can incorporate the Average True Range (ATR) value of that candle.
Candle time is very important here. We will mark the candle when the actual trading begins in New York stock exchange. The trading hours for the New York Stock Exchange (NYSE) typically begin at 9:30 AM and end at 4:00 PM Eastern Time (ET), Monday through Friday. This is known as the "NYSE Regular Trading Session." However, it's important to note that there are also pre-market and after-hours trading sessions that occur outside of these core hours. We will not consider these pre and after-hours.
Example:
First break-above and break-below is marked automatically and alerts are also available for first breaks.
Example:
I have also added the option to add the, London Stock Exchange Main Market and Tokyo Stock Exchange Regular Trading Session. You can add those sessions also and test with different symbols.
Stocks symbols from different stock exchanges just mark the very first candle of the day(main market trading session).
Alerts are available.
Cari dalam skrip untuk "sessions"

ATR GOD Strategy by TradeSmart (PineConnector-compatible)This is a highly-customizable trading strategy made by TradeSmart, focusing mainly on ATR-based indicators and filters. The strategy is mainly intended for trading forex , and has been optimized using the Deep Backtest feature on the 2018.01.01 - 2023.06.01 interval on the EUR/USD (FXCM) 15M chart, with a Slippage value of 3, and a Commission set to 0.00004 USD per contract. The strategy is also made compatible with PineConnector , to provide an easy option to automate the strategy using a connection to MetaTrader. See tooltips for details on how to set up the bot, and check out our website for a detailed guide with images on how to automate the strategy.
The strategy was implemented using the following logic:
Entry strategy:
A total of 4 Supertrend values can be used to determine the entry logic. There is option to set up all 4 Supertrend parameters individually, as well as their potential to be used as an entry signal/or a trend filter. Long/Short entry signals will be determined based on the selected potential Supertrend entry signals, and filtered based on them being in an uptrend/downtrend (also available for setup). Please use the provided tooltips for each setup to see every detail.
Exit strategy:
4 different types of Stop Losses are available: ATR-based/Candle Low/High Based/Percentage Based/Pip Based. Additionally, Force exiting can also be applied, where there is option to set up 4 custom sessions, and exits will happen after the session has closed.
Parameters of every indicator used in the strategy can be tuned in the strategy settings as follows:
Plot settings:
Plot Signals: true by default, Show all Long and Short signals on the signal candle
Plot SL/TP lines: false by default, Checking this option will result in the TP and SL lines to be plotted on the chart.
Supertrend 1-4:
All the parameters of the Supertrends can be set up here, as well as their individual role in the entry logic.
Exit Strategy:
ATR Based Stop Loss: true by default
ATR Length (of the SL): 100 by default
ATR Smoothing (of the SL): RMA/SMMA by default
Candle Low/High Based Stop Loss: false by default, recent lowest or highest point (depending on long/short position) will be used to calculate stop loss value. Set 'Base Risk Multiplier' to 1 if you would like to use the calculated value as is. Setting it to a different value will count as an additional multiplier.
Candle Lookback (of the SL): 50 by default
Percentage Based Stop Loss: false by default, Set the stop loss to current price - % of current price (long) or price + % of current price (short).
Percentage (of the SL): 0.3 by default
Pip Based Stop Loss: Set the stop loss to current price - x pips (long) or price + x pips (short). Set 'Base Risk Multiplier' to 1 if you would like to use the calculated value as is. Setting it to a different value will count as an additional multiplier.
Pip (of the SL): 10 by default
Base Risk Multiplier: 4.5 by default, the stop loss will be placed at this risk level (meaning in case of ATR SL that the ATR value will be multiplied by this factor and the SL will be placed that value away from the entry level)
Risk to Reward Ratio: 1.5 by default, the take profit level will be placed such as this Risk/Reward ratio is met
Force Exiting:
4 total Force exit on custom session close options: none applied by default. If enabled, trades will close automatically after the set session is closed (on next candle's open).
Base Setups:
Allow Long Entries: true by default
Allow Short Entries: true by default
Order Size: 10 by default
Order Type: Capital Percentage by default, allows adjustment on how the position size is calculated: Cash: only the set cash amount will be used for each trade Contract(s): the adjusted number of contracts will be used for each trade Capital Percentage: a % of the current available capital will be used for each trade
ATR Limiter:
Use ATR Limiter: true by default, Only enter into any position (long/short) if ATR value is higher than the Low Boundary and lower than the High Boundary.
ATR Limiter Length: 50 by default
ATR Limiter Smoothing: RMA/SMMA by default
High Boundary: 1000 by default
Low Boundary: 0.0003 by default
MA based calculation: ATR value under MA by default, If not Unspecified, an MA is calculated with the ATR value as source. Only enter into position (long/short) if ATR value is higher/lower than the MA.
MA Type: RMA/SMMA by default
MA Length: 400 by default
Waddah Attar Filter:
Explosion/Deadzone relation: Not specified by default, Explosion over Deadzone: trades will only happen if the explosion line is over the deadzone line; Explosion under Deadzone: trades will only happen if the explosion line is under the deadzone line; Not specified: the opening of trades will not be based on the relation between the explosion and deadzone lines.
Limit trades based on trends: Not specified by default, Strong Trends: only enter long if the WA bar is colored green (there is an uptrend and the current bar is higher then the previous); only enter short if the WA bar is colored red (there is a downtrend and the current bar is higher then the previous); Soft Trends: only enter long if the WA bar is colored lime (there is an uptrend and the current bar is lower then the previous); only enter short if the WA bar is colored orange (there is a downtrend and the current bar is lower then the previous); All Trends: only enter long if the WA bar is colored green or lime (there is an uptrend); only enter short if the WA bar is colored red or orange (there is a downtrend); Not specified: the color of the WA bar (trend) is not relevant when considering entries.
WA bar value: Not specified by default, Over Explosion and Deadzone: only enter trades when the WA bar value is over the Explosion and Deadzone lines; Not specified: the relation between the explosion/deadzone lines to the value of the WA bar will not be used to filter opening trades.
Sensitivity: 150 by default
Fast MA Type: SMA by default
Fast MA Length: 10 by default
Slow MA Type: SMA
Slow MA Length: 20 by default
Channel MA Type: EMA by default
BB Channel Length: 20 by default
BB Stdev Multiplier: 2 by default
Trend Filter:
Use long trend filter 1: false by default, Only enter long if price is above Long MA.
Show long trend filter 1: false by default, Plot the selected MA on the chart.
TF1 - MA Type: EMA by default
TF1 - MA Length: 120 by default
TF1 - MA Source: close by default
Use short trend filter 1: false by default, Only enter long if price is above Long MA.
Show short trend filter 1: false by default, Plot the selected MA on the chart.
TF2 - MA Type: EMA by default
TF2 - MA Length: 120 by default
TF2 - MA Source: close by default
Volume Filter:
Only enter trades where volume is higher then the volume-based MA: true by default, a set type of MA will be calculated with the volume as source, and set length
MA Type: RMA/SMMA by default
MA Length: 200 by default
Date Range Limiter:
Limit Between Dates: false by default
Start Date: Jan 01 2023 00:00:00 by default
End Date: Jun 24 2023 00:00:00 by default
Session Limiter:
Show session plots: false by default, show market sessions on chart: Sidney (red), Tokyo (orange), London (yellow), New York (green)
Use session limiter: false by default, if enabled, trades will only happen in the ticked sessions below.
Sidney session: false by default, session between: 15:00 - 00:00 (EST)
Tokyo session: false by default, session between: 19:00 - 04:00 (EST)
London session: false by default, session between: 03:00 - 11:00 (EST)
New York session: false by default, session between: 08:00 - 17:00 (EST)
Trading Time:
Limit Trading Time: true by default, tick this together with the options below to enable limiting based on day and time
Valid Trading Days Global: 123567 by default, if the Limit Trading Time is on, trades will only happen on days that are present in this field. If any of the not global Valid Trading Days is used, this field will be neglected. Values represent days: Sunday (1), Monday (2), ..., Friday (6), Saturday(7) To trade on all days use: 123457
(1) Valid Trading Days: false, 123456 by default, values represent days: Sunday (1), Monday (2), ..., Friday (6), Saturday(7) The script will trade on days that are present in this field. Please make sure that this field and also (1) Valid Trading Hours Between is checked
(1) Valid Trading Hours Between: false, 1800-2000 by default, hours between which the trades can happen. The time is always in the exchange's timezone
All other options are also disabled by default
PineConnector Automation:
Use PineConnector Automation: false by default, In order for the connection to MetaTrader to work, you will need do perform prerequisite steps, you can follow our full guide at our website, or refer to the official PineConnector Documentation. To set up PineConnector Automation on the TradingView side, you will need to do the following:
1. Fill out the License ID field with your PineConnector License ID;
2. Fill out the Risk (trading volume) with the desired volume to be traded in each trade (the meaning of this value depends on the EA settings in Metatrader. Follow the detailed guide for additional information);
3. After filling out the fields, you need to enable the 'Use PineConnector Automation' option (check the box in the strategy settings);
4. Check if the chart has updated and you can see the appropriate order comments on your chart;
5. Create an alert with the strategy selected as Condition, and the Message as {{strategy.order.comment}} (should be there by default);
6. Enable the Webhook URL in the Notifications section, set it as the official PineConnector webhook address and enjoy your connection with MetaTrader.
License ID: 60123456789 by default
Risk (trading volume): 1 by default
NOTE! Fine-tuning/re-optimization is highly recommended when using other asset/timeframe combinations.

DR/IDR of Omega by TRSTNThis is an EXPERIMENTAL Script by @TRSTNGLRD derived from the coding of @IAmMas7er's "DR/IDR" Indicator that adds a total of 11 additional DR / IDR Ranges on both lower and higher timeframes.
This script is no-longer being worked on, so I have made it public.
Background:
This Script utilizes the Fibonacci-Doubling Sequence between the range of 18:30pm and 16:55pm NY-Time. Each Cycle is grouped into the following:
Omega/2, Omega/4, Omega/8, and Omega/16
The Mas7er's three original sessions are: Omega/4v1, Omega/4v2, and Omega/8v1
These three Sessions above take rule over all others. If you are looking to back-test this version of the script, please use the Experimental ranges as confirmation for the three above.
Important Notes:
- Please only select Sessions with their respected groups (All of Omega/4, All of Omega/16, etc...) rather than selecting all of them at once.
If you select all of them at once, the ranges will not be correct and cut each other off.
The only exceptions to this rule are the Mas7er's original ranges above.
- If you wish to have multiple groups of Ranges together, please add a second indicator to your chart.
- Omega/16v1 and Omega/16v6 are known to have a high-probability of a Judas Swing (takes out both sides of the range) - Be Cautious!
- Omega/2v1 is a very large DR / IDR range. I am working on shrinking it in size, but have more experimenting to do with different ranges.
- I do not use the experimental ranges with the IDR , only the DR . I have not been able to define probabilities fully yet, but the levels are respected nonetheless.
This script is not supposed to work EXACTLY like the Mas7er's, rather, generally instead.
Please comment and leave your opinion below about which ranges work the best and how you may utilize them.
Thank you!

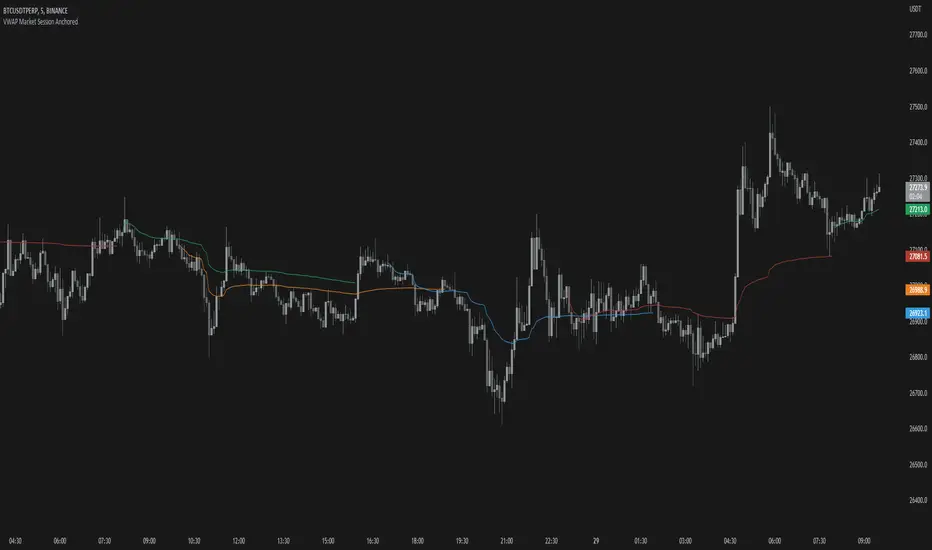
VWAP Market Session AnchoredVWAP Market Session Anchored differs from the traditional VWAP or VWAP Auto Anchored indicator in that the Volume Weighted Average Price calculation is automatically anchored to four major market session starts: Sydney, London, Tokyo, New York.
Settings
Source: the source for the VWAP calculation.
Offset: changing this number will move the VWAP either Forwards or Backwards, relative to the current market. Zero is the default.
Band: enabling this will show Standard Deviation bands.
Band Multiplier: the value the Standard Deviation bands will be multiplied by before being plotted on the chart.
Sessions : enabling the sessions will plot the respective anchored VWAP on chart.
Custom: enabling this will show a custom user-defined session.
Custom UTC : the custom session is defined by a starting UTC hour followed by the ending UTC hour.
Usage
Similar to the traditional VWAP, VWAP Market Session Anchored is a technical analysis tool used to measure the average price weighted by volume. VWAP Market Session Anchored can be used to identify the trend during a specific market session.
Limitations
When setting a custom session, be mindful that calculations are based off of the Coordinated Universal Time (UTC) time, you must convert your local time zone to UTC in order to have an accurate representation of your custom session.
It is not recommended to use this indicator on timeframes above 1 hour as market sessions only last a few hours.
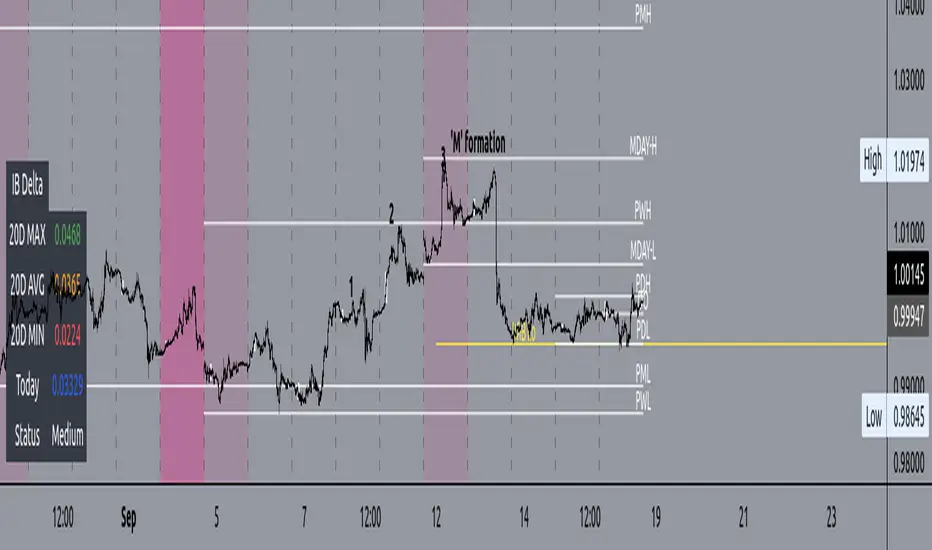
BTMM V2Similar to the first BTMM (R.Noodle) this version of the script is tailored towards key level traders. This includes intraday, daily, and higher TF traders.
**REMOVED** background tckr info, candle color according to day, and market sessions
**Replaced**key levels & market sessions
**NEW**initial balance analytics first Friday and every Monday
Market Sessions
UK=1ST 3HRS US=1ST 3 HRS =ASIA/DAILY INITIAL BALANCE = 1ST SESS 1ST 1HR HIGH/LOW
Since the Asian session starts the day we can also grab the initial balance for the day as well. (note that using the Asian session extend function you will not be given the Asian session end time. Extend function makes the session close run through the entire day)
INITIAL BALANCE PANEL/BOX
WEEKLY INITIAL BALANCE
PIP LINES
double zero (00) and 50 pip levels are strong levels the market respects. one can reduce risk by entering at major confluences and key levels examlpe below
FIRST FRIDAY + EVERY MONDAY
KEY LEVELS
you can have today, yesterday, last week, last month, last qtr, and last year along with the mid point of all. below are key levels for day traders
Earnings Price Move Cheat Sheet [KT]Hello!
This script looks to distinguish replicable sequences and correlations between earnings releases and price. The indicator calculates the average 1-session to 20-session performance of an asset prior to an earnings release, and the 1-session to 20-session performance of an asset subsequent an earnings release.
You can select the number of sessions the script calculates for asset performance.
In the image above the script calculates the average 1-session performance following an earnings surprise, earnings miss, and in general. 20 sessions is the maximum value!
Also measured is the average performance of an asset before and after earnings, in addition to the average performance following an earnings surprise "green earnings" and the average performance following an earnings miss "red earnings".
I included VaR and CVaR calculations - using the historical method - in the script. For those of you unfamiliar with the metrics, both look to quantify the risk of financial loss for a portfolio, or even a particular position.
The script also calculates the 1st - 5th percentile for earnings losses. A more comprehensive explanation of the metrics is stored in tooltips in the user input tab.
The script also calculates the highest high and lowest low following an earnings release, up to 20 sessions, and calculates the difference between the two.
Keep in mind that a company might not have a significant number of earnings misses, or may have only traded publicly for a short while. If true, the resulting earnings/price calculations *will* be misleading - there is an insufficient sample size; no correlations are ascertainable.
I will be working on this script more, so let me know if there is anything you would like included!

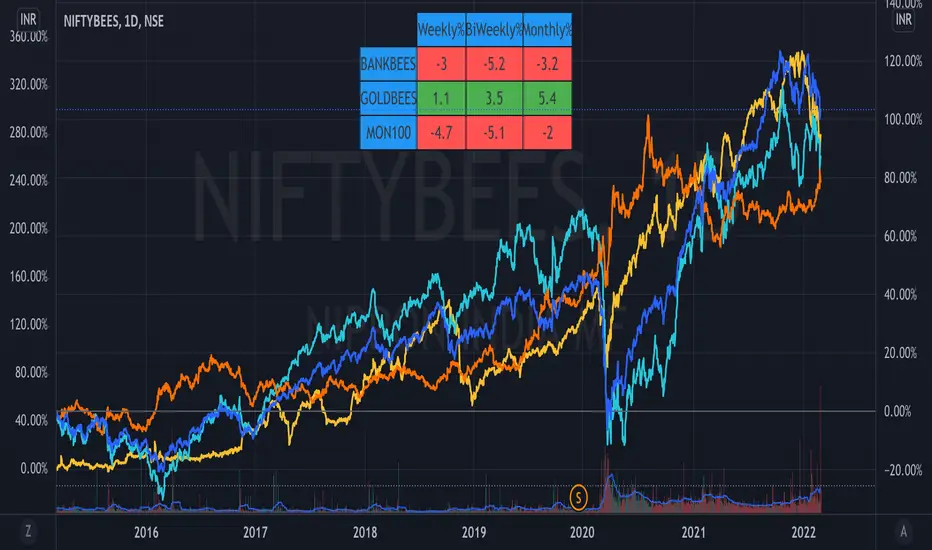
ETF Trends//@Devendra Akolkar - @dakolkar - This indicator will compare and show relative performance of 3 symbols.
// It'll compare those 3 symbols on 3 different Timeframe (Weekly - 5 sessions , BiWeekly - 10 sessions and Monthly - 20 sessions) and display performance in %
Session/Day VWAP & Std Dev Bands/VWAP and Standard Deviation Bands for intra-day & Day sessions
/Intra-day sessions be default are set to crypto
- Asia session
- London Session
- New York Session
- Close Session
Day broken up into sessions as a 24 hour period consists of different market participants and therefore different behaviour.

Average Volume at Time (AVAT)Calculation of average volume at current time for a number of previous sessions, known as Average Volume at Time (AVAT).
Inputs:
* period to use for accumulation. "D" is the default value, useful to view data for each session.
* number of previous sessions to average
TODO: more intelligent accumulation of number of bars in a session, since there may be sessions with different values
TODO: interpolate volume according to current time, inside of the last bar

Forex session - Opening Range- Jayy fixed updatedOpening Range (OR) for Forex 24 hour regular session. This is not for regular market day sessions addressed in a separate script.
This script fixes four issues:
syntax error when code compiles
messed up opening range the day after a holiday Monday
flaky plotting of the opening range and targets that required page reloading
TradingView problems with starting forex session at 1700 hours EST/EDT when using certain securities eg FX_IDC currently (Jan 2017)
Additions in his code are more options for trading range
Time compensation option for some securities that incorrectly start sessions at 1200 hrs instead of 1700 hrs NY time
- this glitch is likely temporary but present when this script update was created
More opening range time period choices
Opening Range Targets:
Opening Range Targets as per Leaf_West
Targets are set at 127% , 162%, 200 %, 262 %, 362%, 423%, 685%, 1109% and 1794% and this can be traded intraday using methods described here charts-by-leaf.com I also have some Leaf West PDFs that describe how the targets are set and how they are traded. There are others that use opening range.
The Time Session Glitch and the Fix:
The script will correctly default to 1700 hrs to 1700hrs EDT/EST session for FXCM.
Strangely some securities appear to erroneously start their session at 1200 hrs ie. My guess is that they are somehow tied to GMT+0 instead of New York time (GMT+5). See this for yourself by selecting EURUSD using the FXCM exchange (FX:EURUSD) and then EURUSD from the IDC exchange (FX_IDC:EURUSD). The FX-IDC session opening range starts 5 hours
before it actually should at 1700 hrs EDT/EST. To correct for this I have implemented an automatic fix (default) and a user selected "5 hour time shift adjust. ment needed on some securities".
There is also a 4 hour time shift button which might be necessary when New York reverts from Eastern Standard Time
to Eastern Daylight Time (1 hour difference) in March (and then back again in November). In the default auto adjust mode you will need to select the 1 hour time shift. That is if this glitch still exists at that time.
I have looked at other scripts, other than my own and where the script is available, that need to use information about the opening bar and all have the same time shift issue
What are the choices for Opening Range?
The dialogue box offers the standard TradingView options.
Also where you see Pick Opening Range 1 to 12 hours , SET TO 0 To USE LINE ABOVE TO DETERMINE OR LENGTH
As the note says a number other than 0 will override the standard options from the line above
The dialogue box below in offers choices by hours 1 to 12. A number greater than 12 will still only give
720 minutes (12 hours) for the length of Opening Range.
What sessions within the FOREX time-frame are available?
The default is 1700 hours to 1700 hours EST/EDT
Check any one (only one) of the time periods to change the opening range period to suit.
New York opens at 8:00 am to 5:00 pm EST (EDT)
Tokyo opens at 7:00 pm to 4:00 am EST (EDT)
Sydney opens at 5:00 pm to 2:00 am EST (EDT)
London opens at 3:00 am to 12:00 noon EST (EDT)
There is a build your own session (click the button to select)
The two lines for inputting session times are almost identical except that the second line starts the be the same as each other.
The default for the build your own session is 2200 hours to 2200 hours. As of the time of publishing this plots EURUSD FX-IDC just right. The GMT+5 and GMT+4 do not apply to this selection.
See my comments above on this strange aberration.
The script originated from work done by Chris Moody. It has changed significantly but there are remnants of that script lurking within.
Script is free to all - that way you can see what is inside
Cheers Jayy

AI-Enhanced MSS HunterAI-Enhanced MSS Hunter
This indicator is a hybrid trading system that merges Mechanical Price Action (ICT Concepts) with Statistical Machine Learning (K-Nearest Neighbors). It is designed to assist traders in identifying high-probability reversals after liquidity sweeps, as well as trend-continuation entries during specific "Kill Zone" sessions.
How It Works
The script operates on a strict 3-step validation process to filter out false signals during choppy market conditions.
1. Liquidity Sweep (The Trigger) The system automatically plots the Previous Day High (PDH) and Previous Day Low (PDL).
The logic begins only when price "sweeps" (breaks) one of these key levels.
State Persistence: Once a level is swept, the system remembers this event for the remainder of the session (or until a signal fires), waiting for the market to reverse.
2. Market Structure Shift (The Setup) After a sweep, the indicator hunts for a Market Structure Shift (MSS).
It tracks dynamic Swing Highs and Swing Lows.
A signal is prepared only if price breaks a recent structural swing point in the opposite direction of the sweep (e.g., Sweep PDL -> Break Swing High).
3. AI / Machine Learning Filter (The Confirmation) To reduce false positives, the signal must be confirmed by a K-Nearest Neighbors (KNN) algorithm.
The Logic: The script analyzes the current values of RSI (14), CCI (14), and ROC (10).
The Comparison: It looks back at the last ~1,000 bars of history to find similar market conditions (neighbors).
The Prediction: If the majority of those historical "neighbors" resulted in a favorable move, the AI confirms the trade. If historical data suggests chop or reversal, the signal is blocked.
Key Features
🎯 Primary Reversal Signals (Circles)
Green Circle: Price swept PDL + Bullish MSS + AI Confirmation.
Red Circle: Price swept PDH + Bearish MSS + AI Confirmation.
♻️ Golden Zone Re-Entries (Triangles) Once a Primary Signal is active, the script tracks the new trend leg.
It automatically draws a dynamic Golden Zone (0.5 – 0.618 Fibonacci Retracement).
If price pulls back into this zone and forms a new MSS, a Re-Entry Triangle is plotted.
Invalidation: If the pullback breaks the original setup's low/high, the zone is removed to prevent bad trades.
⏰ Kill Zone Time Filters Signals are filtered by time to ensure you are trading during high-volume sessions.
Default AM Session: 08:30 – 10:00 (New York Time)
Default PM Session: 14:00 – 15:00 (New York Time)
Fully customizable in settings.
Settings Guide
Key Levels: Toggle PDH/PDL lines and customize colors.
Kill Zones: Enable/Disable time filtering and highlight background colors.
AI Settings:
K-Nearest Neighbors (k): Number of historical neighbors to compare (Default: 5).
Training Window: How far back the AI looks for patterns (Default: 1000 bars).
Visuals: Turn on/off the Golden Zone fib clouds or text labels.
Disclaimer
This tool is for educational purposes only. The "AI" component is a statistical classification algorithm based on historical momentum and does not guarantee future results. Always manage risk and use this indicator as part of a comprehensive trading plan.

Joanne's EMA Strategie V2Signale nach 3 EMA Strategie, Pivot Points werden berücksichtigt. Signalkerze mit Volumenfilter nach Wahl mit Sessions.
Signals according to 3 EMA strategy, pivot points are taken into account. Signal candle with volume filter of your choice with sessions.
V2 enthält
Entry, SL,TP1 und TP2 werden durch Linien angezeigt.
V2 contains
Entry, SL, TP1, and TP2 are indicated by lines.

Joanne's EMA StrategieSignale nach 3 EMA Strategie, Pivot Points werden berücksichtigt. Signalkerze mit Volumenfilter nach Wahl mit Sessions.
Signals according to 3 EMA strategy, pivot points are taken into account. Signal candle with volume filter of your choice with sessions.

cd_VW_Cx IMPROVED - Quant VWAP System: Regime, Magnets & Z-ScoQuant VWAP System: Regime, Magnets & Z-Score Matrix
This indicator is a comprehensive Quantitative Trading System designed to move beyond simple support and resistance. Instead of static lines, it uses Statistical Probability (Z-Score) and Standard Deviation to define the current market regime, identify institutional value zones, and project high-probability liquidity targets.
It is engineered for Day Traders and Scalpers (Crypto & Futures) who need to know if the market is Trending, Ranging, or preparing for a Breakout.
1. The "Regime" System (Standard Deviation Bands)
The core engine anchors a VWAP (Volume Weighted Average Price) to your chosen timeframe (Daily, Weekly, or Monthly) and projects volatility bands based on market variance.
The Trend Zone (Inner Band / 1.0 SD): This is the "Fair Value" zone. In a healthy trend, price will pull back into this zone and hold. A hold here signals a high-probability continuation (Trend Following).
The Reversion Zone (Outer Band / 2.0 SD): This represents a statistical extreme. Price rarely sustains movement beyond 2 Standard Deviations without a reversion. A touch of this band signals "Overbought" or "Oversold" conditions.
2. Liquidity Magnets (Virgin VWAPs)
The script automatically tracks "Unvisited VWAPs" from previous sessions. These are price levels where significant volume occurred but have not yet been re-tested.
The Logic: Algorithms often target these "open loops." The script visualizes them as Blue Dashed Lines with price tags.
Smart Scaling (Anti-Scrunch): Includes a custom "Ghost Engine" that automatically hides or "ghosts" magnets that are too far away. This prevents your chart from being squashed (scrunched) on lower timeframes, keeping your candles perfectly readable while still tracking targets in the background.
3. The Quant Matrix (Dashboard)
A real-time Heads-Up Display (HUD) that interprets the data for you:
Regime: Detects Volatility Squeezes. If the bands compress, it signals "⚠ SQUEEZE", warning you to stop mean-reversion trading and prepare for an explosive breakout.
Bias: Color-coded Trend Direction (Bullish/Bearish) based on VWAP slope.
Signal: actionable text prompts such as "BUY DIP" (Trend Following), "FADE EXT" (Mean Reversion), or "PREP BREAK" (Squeeze).
4. Visual Intelligence
Bold Day Separators: Clear, vertical dotted dividers with Date Stamps to instantly separate trading sessions.
Dynamic Labels: Floating labels on the right axis identify exactly which deviation level is which, preventing chart confusion.
How to Use
Strategy A: The Trend Pullback (continuation)
Check Matrix: Ensure Bias is BULLISH (Green).
Wait: Allow price to pull back into the Inner Band (Dark Green Zone).
Trigger: If price holds the Center VWAP or the -1.0 SD line, enter Long.
Target: The next Liquidity Magnet above or the +2.0 SD band.
Strategy B: The Reversion Fade (Counter-Trend)
Check Matrix: Ensure price is labeled "EXTREME" or Signal says "FADE EXT".
Trigger: Price touches or pierces the Outer Band (2.0 SD).
Action: Enter counter-trend (Short) with a target back to the Center VWAP (Mean Reversion).
Strategy C: The Magnet Target
Identify a "MAGNET" line (Blue Dashed) near current price.
These act as high-probability Take Profit levels. Price will often rush to these levels to "close the loop" before reversing.
Settings
Anchor: Daily (default), Weekly, or Monthly.
Magnet Focus Range: Adjusts how aggressively the script hides distant magnets to fix chart scaling (Default: 2%).
Visuals: Fully customizable colors, label sizes, and dashboard position.

Daily Midnight Marker (NYC)This indicator automatically plots a vertical line at midnight (00:00) New York time on every trading day.
Each line is drawn in light gray to mark the start of a new day, helping traders visually separate daily sessions.
A weekday label (e.g., Monday, Tuesday, Wednesday...) is displayed to the right of each line, making it easy to identify daily transitions when analyzing intraday price action or reviewing trading sessions.
Perfect for traders who:
Trade based on daily session structure or pre-market setups
Use NY time as a market reference
Prefer a clean and minimal visual day separator

Island Reversal [LuxAlgo]The Island Reversal tool allows traders to identify reversal patterns directly on the chart. These patterns signal a potential change in trend, either from bullish to bearish or vice versa.
The tool enables traders to filter these patterns by trend, volume, and range, making it easy to display pure or less constrained island reversals.
🔶 USAGE
An island reversal pattern may indicate a change in trend. It occurs when prices change direction from an uptrend to a downtrend, or vice versa.
This pattern is a great tool for timing the market. Traders should be aware of when these patterns develop and watch how prices behave after the pattern forms.
Now, let's take a closer look at one of these island reversal patterns to highlight its different components.
The different parts are depicted in the image above.
1. A trend prior to the pattern
2. A gap starts the pattern.
3. A range of prices
4. A final gap, opposite to the first one, closes the pattern.
5. In this case, the pattern leads to a bearish trend, which is opposite to the trend in the first step.
🔹 Trend, Volume and Range Filters
Enabling the trend filter causes the tool to only detect top island reversals during a bullish trend and bottom island reversals during a bearish trend.
Traders can adjust the size of the detected trend in the settings panel. The larger the trend size, the more relevant the reversal patterns can be.
The volume filter only detects reversal patterns if there is more volume within the range of the pattern than in the preceding trend.
The idea is that more people tend to participate at the top and bottom of a trend as it changes direction.
The tool has two range filters that discriminate the range within the island reversal pattern:
Horizontality Filter (R2): Based on the R-squared statistic from linear regression, it detects whether the price is moving sideways within the range.
Volatility Filter: Based on long-term volatility, it detects the size of the range within the pattern.
The smaller the value in the Horizontality Filter, the more horizontal the prices will be within the range. A larger value will detect more reversal patterns.
The larger the value in the Volatility Filter, the larger the ranges will be. A smaller value will detect fewer reversal patterns.
🔶 SETTINGS
🔹 Trend Filter
Trend Filter: Enable or disable the trend filter.
Trend Length: Select the size of the detected trend.
🔹 Volume Filter
Volume Filter: Enable or disable the volume filter.
🔹 Range Filter
Horizontality Filter (R2): Enable or disable the Horizontality filter and select a threshold value.
Volatility Filter: Enable or disable the Volatility filter and select the multiplier value.
🔹 Style
Bullish: Select a color for bullish sessions.
Bearish: Select a color for bearish sessions.
Transparency: Select a transparency level from 100 to 0.

Session Dominator — Asia • London • New York Precision ZonesRule the global market sessions.
Session Dominator is a precision-engineered indicator built for traders who want total clarity across Asia, London, and New York sessions.
It automatically plots:
🔷 Dynamic Session Boxes — visually map institutional killzones in real time
⚙️ Session Mean Line — track equilibrium and liquidity shifts
📊 EMA-50 Confluence — align directional bias and intraday trend
🎯 BSL / SSL Levels — reveal active liquidity sweeps and reversals
💡 Bias Engine — evaluates structure and locks the session bias automatically
Toggle between Asia / London / New York / Overlap / Custom modes to dominate any timezone.
Designed with minimalist visuals, high precision, and ICT-based logic — this tool helps you anticipate where liquidity will be taken before it happens.
✳️ For XAUUSD traders, scalpers, and ICT-style analysts seeking sniper-level clarity.

ORBs, EMAs, AVWAPThis Pine Script (version 6) is a multi-session trading indicator that combines Opening Range Breakouts (ORBs), Exponential Moving Averages (EMAs), and an Anchored VWAP (AVWAP) system — all in one overlay script for TradingView.
Here’s a clear breakdown of its structure and functionality:
🕒 1. Session Logic and ORB Calculation
Purpose: Identify and plot the high and low of the first 30 minutes (default) for the Tokyo, London, and New York trading sessions.
Session Anchors (NY time):
Tokyo → 20:00
London → 03:00
New York → 09:30
(All configurable in inputs.)
ORB Duration: Default is 30 minutes (orbDurationMin), also user-configurable.
Resets:
London and NY ORBs reset at the start of each new New York trading day (17:00 NY time).
Tokyo ORB resets independently using a stored timestamp.
Process:
For each session:
While the time is within the ORB window, the script captures the session’s high and low.
Once the window closes, those levels remain plotted until reset.
Plot Colors:
Tokyo → Yellow (#fecc02)
London → Gray (#8c9a9c)
New York → Magenta (#ff00c8)
These form visible horizontal lines marking the prior session ranges — useful for breakout or retest trading setups.
📈 2. EMA System
Purpose: Provide trend and dynamic support/resistance guidance.
It calculates and plots four EMAs:
EMA Period Color Purpose
EMA 9 Short-term Green Fast signal
EMA 20 Short-term Red Confirms direction
EMA 113 Medium Aqua Trend filter
EMA 200 Long-term Orange Macro trend baseline
Each EMA is plotted directly on the price chart for visual confluence with ORB and VWAP levels.
⚖️ 3. Anchored VWAP (AVWAP)
Purpose: Display a volume-weighted average price anchored to specific timeframes or events, optionally with dynamic deviation or percentage bands.
Features:
Anchor Options:
Time-based: Session, Week, Month, Quarter, Year, Decade, Century
Event-based: Earnings, Dividends, Splits
VWAP resets when the chosen anchor condition is met (e.g., new month, new earnings event, etc.).
Bands:
Up to three levels of symmetric upper/lower bands.
Choose between Standard Deviation or Percentage-based widths.
Display Toggles:
Each band’s visibility is optional.
VWAP can be hidden on 1D+ timeframes (hideonDWM option).
Color Scheme:
VWAP: Fuchsia (magenta-pink) line
Bands: Green / Olive / Teal with light-filled zones
⚙️ 4. Technical Highlights
Uses ta.vwap() with built-in band calculations.
Handles instruments with or without volume (errors if missing volume).
Uses time-zone aware timestamps (timestamp(NY_TZ, …)).
Uses timeframe.change() to detect new anchors for the VWAP.
Employs persistent variables (var) to maintain session state across bars.
💡 In Practice
This indicator is designed for multi-session intraday traders who:
Trade Tokyo, London, or NY open breakouts or retests.
Use EMA stacking and crossovers for trend confirmation.
Use Anchored VWAP as a fair-value or mean-reversion reference.
Need clear visual structure across different market sessions.
It provides strong session separation, trend context, and volume-weighted price reference — making it ideal for discretionary or semi-systematic trading strategies focused on liquidity zones and session momentum.

Forecast PriceTime Oracle [CHE] Forecast PriceTime Oracle — Prioritizes quality over quantity by using Power Pivots via RSI %B metric to forecast future pivot highs/lows in price and time
Summary
This indicator identifies potential pivot highs and lows based on out-of-bounds conditions in a modified RSI %B metric, then projects future occurrences by estimating time intervals and price changes from historical medians. It provides visual forecasts via diagonal and horizontal lines, tracks achievement with color changes and symbols, and displays a dashboard for statistical overview including hit rates. Signals are robust due to median-based aggregation, which reduces outlier influence, and optional tolerance settings for near-misses, making it suitable for anticipating reversals in ranging or trending markets.
Motivation: Why this design?
Standard pivot detection often lags or generates false signals in volatile conditions, missing the timing of true extrema. This design leverages out-of-bounds excursions in RSI %B to capture "Power Pivots" early—focusing on quality over quantity by prioritizing significant extrema rather than every minor swing—then uses historical deltas in time and price to forecast the next ones, addressing the need for proactive rather than reactive analysis. It assumes that pivot spacing follows statistical patterns, allowing users to prepare entries or exits ahead of confirmation.
What’s different vs. standard approaches?
- Reference baseline: Diverges from traditional ta.pivothigh/low, which require fixed left/right lengths and confirm only after bars close, often too late for dynamic markets.
- Architecture differences:
- Detects extrema during OOB runs rather than post-bar symmetry.
- Aggregates deltas via medians (or alternatives) over a user-defined history, capping arrays to manage resources.
- Applies tolerance thresholds for hit detection, with options for percentage, absolute, or volatility-adjusted (ATR) flexibility.
- Freezes achieved forecasts with visual states to avoid clutter.
- Practical effect: Charts show proactive dashed projections instead of retrospective dots; the dashboard reveals evolving hit rates, helping users gauge reliability over time without manual calculation.
How it works (technical)
The indicator first computes a smoothed RSI over a specified length, then applies Bollinger Bands to derive %B, flagging out-of-bounds below zero or above one hundred as potential run starts. During these runs, it tracks the extreme high or low price and bar index. Upon exit from the OOB state, it confirms the Power Pivot at that extreme and records the time delta (bars since prior) and price change percentage to rolling arrays.
For forecasts, it calculates the median (or selected statistic) of recent deltas, subtracts the confirmation delay (bars from apex to exit), and projects ahead by that adjusted amount. Price targets use the median change applied to the origin pivot value. Lines are drawn from the apex to the target bar and price, with a short horizontal at the endpoint. Arrays store up to five active forecasts, pruning oldest on overflow.
Tolerance adjusts hit checks: for highs, if the high reaches or exceeds the target (adjusted by tolerance); for lows, if the low drops to or below. Once hit, the forecast freezes, changing colors and symbols, and extends the horizontal to the hit bar. Persistent variables maintain last pivot states across bars; arrays initialize empty and grow until capped at history length.
Parameter Guide
Source: Specifies the data input for the RSI computation, influencing how price action is captured. Default is close. For conservative signals in noisy environments, switch to high; using low boosts responsiveness but may increase false positives.
RSI Length: Sets the smoothing period for the RSI calculation, with longer values helping to filter out whipsaws. Default is 32. Opt for shorter lengths like 14 to 21 on faster timeframes for quicker reactions, or extend to 50 or more in strong trends to enhance stability at the cost of some lag.
BB Length: Defines the period for the Bollinger Bands applied to %B, directly affecting how often out-of-bounds conditions are triggered. Default is 20. Align it with the RSI length: shorter periods detect more potential runs but risk added noise, while longer ones provide better filtering yet might overlook emerging extrema.
BB StdDev: Controls the multiplier for the standard deviation in the bands, where wider settings reduce false out-of-bounds alerts. Default is 2.0. Narrow it to 1.5 for highly volatile assets to catch more signals, or broaden to 2.5 or higher to emphasize only major movements.
Show Price Forecast: Enables or disables the display of diagonal and target lines along with their updates. Default is true. Turn it off for simpler chart views, or keep it on to aid in trade planning.
History Length: Determines the number of recent pivot samples used for median-based statistics, where more history leads to smoother but potentially less current estimates. Default is 50. Start with a minimum of 5 to build data; limit to 100 to 200 to prevent outdated regimes from skewing results.
Max Lookahead: Limits the number of bars projected forward to avoid overly extended lines. Default is 500. Reduce to 100 to 200 for intraday focus, or increase for longer swing horizons.
Stat Method: Selects the aggregation technique for time and price deltas: Median for robustness against outliers, Trimmed Mean (20%) for a balanced trim of extremes, or 75th Percentile for a conservative upward tilt. Default is Median. Use Median for even distributions; switch to Percentile when emphasizing potential upside in trending conditions.
Tolerance Type: Chooses the approach for flexible hit detection: None for exact matches, Percentage for relative adjustments, Absolute for fixed point offsets, or ATR for scaling with volatility. Default is None. Begin with Percentage at 0.5 percent for currency pairs, or ATR for adapting to cryptocurrency swings.
Tolerance %: Provides the relative buffer when using Percentage mode, forgiving small deviations. Default is 0.5. Set between 0.2 and 1.0 percent; higher values accommodate gaps but can overstate hit counts.
Tolerance Points: Establishes a fixed offset in price units for Absolute mode. Default is 0.0010. Tailor to the asset, such as 0.0001 for forex pairs, and validate against past wick behavior.
ATR Length: Specifies the period for the Average True Range in dynamic tolerance calculations. Default is 14. This is the standard setting; shorten to 10 to reflect more recent volatility.
ATR Multiplier: Adjusts the ATR scale for tolerance width in ATR mode. Default is 0.5. Range from 0.3 for tighter precision to 0.8 for greater leniency.
Dashboard Location: Positions the summary table on the chart. Default is Bottom Right. Consider Top Left for better visibility on mobile devices.
Dashboard Size: Controls the text scaling for dashboard readability. Default is Normal. Choose Tiny for dense overlays or Large for detailed review sessions.
Text/Frame Color: Sets the color scheme for dashboard text and borders. Default is gray. Align with your chart theme, opting for lighter shades on dark backgrounds.
Reading & Interpretation
Forecast lines appear as dashed diagonals from confirmed pivots to projected targets, with solid horizontals at endpoints marking price levels. Open targets show a target symbol (🎯); achieved ones switch to a trophy symbol (🏆) in gray, with lines fading to gray. The dashboard summarizes median time/price deltas, sample counts, and hit rates—rising rates indicate improving forecast alignment. Colors differentiate highs (red) from lows (lime); frozen states signal validated projections.
Practical Workflows & Combinations
- Trend following: Enter long on low forecast hits during uptrends (higher highs/lower lows structure); filter with EMA crossovers to ignore counter-trend signals.
- Reversal setups: Short above high projections in overextended rallies; use volume spikes as confirmation to reduce false breaks.
- Exits/Stops: Trail stops to prior pivot lows; conservative on low hit rates (below 50%), aggressive above 70% with tight tolerance.
- Multi-TF: Apply on 1H for entries, 4H for time projections; combine with Ichimoku clouds for confluence on targets.
- Risk management: Position size inversely to delta uncertainty (wider history = smaller bets); avoid low-liquidity sessions.
Behavior, Constraints & Performance
Confirmation occurs on OOB exit, so live-bar pivots may adjust until close, but projections update only on events to minimize repaint. No security or HTF calls, so no external lookahead issues. Arrays cap at history length with shifts; forecasts limited to five active, pruning FIFO. Loops iterate over small fixed sizes (e.g., up to 50 for stats), efficient on most hardware. Max lines/labels at 500 prevent overflow.
Known limits: Sensitive to OOB parameter tuning—too tight misses runs; assumes stationary pivot stats, which may shift in regime changes like low vol. Gaps or holidays distort time deltas.
Sensible Defaults & Quick Tuning
Defaults suit forex/crypto on 1H–4H: RSI 32/BB 20 for balanced detection, Median stats over 50 samples, None tolerance for exactness.
- Too many false runs: Increase BB StdDev to 2.5 or RSI Length to 50 for filtering.
- Lagging forecasts: Shorten History Length to 20; switch to 75th Percentile for forward bias.
- Missed near-hits: Enable Percentage tolerance at 0.3% to capture wicks without overcounting.
- Cluttered charts: Reduce Max Lookahead to 200; disable dashboard on lower TFs.
What this indicator is—and isn’t
This is a forecasting visualization layer for pivot-based analysis, highlighting statistical projections from historical patterns. It is not a standalone system—pair with price action, volume, and risk rules. Not predictive of all turns; focuses on OOB-derived extrema, ignoring volume or news impacts.
Disclaimer
The content provided, including all code and materials, is strictly for educational and informational purposes only. It is not intended as, and should not be interpreted as, financial advice, a recommendation to buy or sell any financial instrument, or an offer of any financial product or service. All strategies, tools, and examples discussed are provided for illustrative purposes to demonstrate coding techniques and the functionality of Pine Script within a trading context.
Any results from strategies or tools provided are hypothetical, and past performance is not indicative of future results. Trading and investing involve high risk, including the potential loss of principal, and may not be suitable for all individuals. Before making any trading decisions, please consult with a qualified financial professional to understand the risks involved.
By using this script, you acknowledge and agree that any trading decisions are made solely at your discretion and risk.
Do not use this indicator on Heikin-Ashi, Renko, Kagi, Point-and-Figure, or Range charts, as these chart types can produce unrealistic results for signal markers and alerts.
Best regards and happy trading
Chervolino

Session Breakout Detector (SBD)Overview:
The Session Breakout Detector (SBD) is a TradingView indicator designed to identify and visualize breakouts from major trading sessions. It tracks a selected session (Tokyo, London, or New York) and detects price movements beyond the session's high or low, assisting traders in spotting potential breakout opportunities.
Key Features:
- Session Selection: Choose between Tokyo, London, or New York sessions.
- Breakout Detection Modes:
- Confirmed Bar: Detects breakouts when a candle closes beyond the session's range.
- Intrabar: Detects breakouts as soon as the price exceeds the session's high or low within a
candle.
- Visual Indicators:
- Displays session high, low, and range with a colored box for clear visualization.
- Marks breakouts with green (bullish) or red (bearish) triangles.
- Optional 50-Period SMA: Adds a 50-period Simple Moving Average to the chart for trend
analysis.
- Alerts: Configurable alerts for bullish and bearish breakouts.
Usage Instructions:
1. Select Session: Choose the desired trading session (Tokyo, London, or New York) from the
input settings.
2. Choose Breakout Detection Mode: Select between 'By confirmed bar' or 'By intrabars' based
on your trading preference.
3. Enable SMA (Optional): Toggle the 'Use SMA?' option to display the 50-period Simple Moving
Average.
4. Set Alerts: Configure alerts for breakout signals as per your trading strategy.
⚠️Note: This indicator is intended for informational purposes only and should not be construed as financial advice. Users are encouraged to conduct their own research and consider their individual risk tolerance before making trading decisions.

Session Gap Fill [LuxAlgo]The Session Gap Fill tool detects and highlights filled and unfilled price gaps between regular sessions. It features a dashboard with key statistics about the detected gaps.
The tool is highly customizable, allowing users to filter by different types of gaps and customize how they are displayed on the chart.
🔶 USAGE
By default, the tool detects all price gaps between sessions. A price gap is defined as a difference between the opening price of one session and the closing price of the previous session. In this case, the tool uses the opening price of the first bar of the session against the closing price of the previous bar.
A bullish gap is detected when the session open price is higher than the last close, and a bearish gap is detected when the session open price is lower than the last close.
Gaps represent a change in market sentiment, a difference in what market participants think between the close of one trading session and the open of the next.
What is useful to traders is not the gap itself, but how the market reacts to it.
Unfilled gaps occur when prices do not return to the previous session's closing price.
Filled gaps occur when prices come back to the previous session's close price.
By analyzing how markets react to gaps, traders can understand market sentiment, whether different prices are accepted or rejected, and take advantage of this information to position themselves in favor of bullish or bearish market sentiment.
Next, we will cover the Gap Type Filter and Statistics Dashboard.
🔹 Gap Type Filter
Traders can choose from three options: display all gaps, display only overlapping gaps, or display only non-overlapping gaps. All gaps are displayed by default.
An overlapping gap is defined when the first bar of the session has any price in common with the previous bar. No overlapping gap is defined when the two bars do not share any price levels.
As we will see in the next section, there are clear differences in market behavior around these types of gaps.
🔹 Statistics Dashboard
The Statistics Dashboard displays key metrics that help traders understand market behavior around each type of gap.
Gaps: The percentage of bullish and bearish gaps.
Filled: The percentage of filled bullish and bearish gaps.
Reversed: The percentage of filled gaps that move in favor of the gap
Bars Avg.: The average number of bars for a gap to be filled.
Now, let's analyze the chart on the left of the image to understand those stats. These are the stats for all gaps, both overlapping and non-overlapping.
Of the total, bullish gaps represent 55%, and bearish ones represent 44%. The gap bias is pretty balanced in this market.
The second statistic, Filled, shows that 63% of gaps are filled, both bullish and bearish. Therefore, there is a higher probability that a gap will be filled than not.
The third statistic is reversed. This is the percentage of filled gaps where prices move in favor of the gap. This applies to filled bullish gaps when the close of the session is above the open, and to filled bearish gaps when the close of the session is below the open. In other words, first there is a gap, then it fills, and finally it reverses. As we can see in the chart, this only happens 35% of the time for bullish gaps and 29% of the time for bearish gaps.
The last statistic is Bars Avg., which is the average number of bars for a gap to be filled. On average, it takes between one and two bars for both bullish and bearish gaps. On average, gaps fill quickly.
As we can see on the chart, selecting different types of gaps yields different statistics and market behavior. For example, overlapping gaps have a greater than 90% chance of being filled, whereas non-overlapping gaps have a less than 40% chance.
🔶 SETTINGS
Gap Type: Select the type of gap to display.
🔹 Dashboard
Dashboard: Enable or disable the dashboard.
Position: Select the location of the dashboard.
Size: Select the dashboard size.
🔹 Style
Filled Bullish Gap: Enable or disable this gap and choose the color.
Filled Bearish Gap: Enable or disable this gap and choose the color.
Unfilled Gap: Enable or disable this gap and choose the color.
Max Deviation Level: Enable or disable this level and choose the color.
Open Price Level: Enable or disable this level and choose the color.

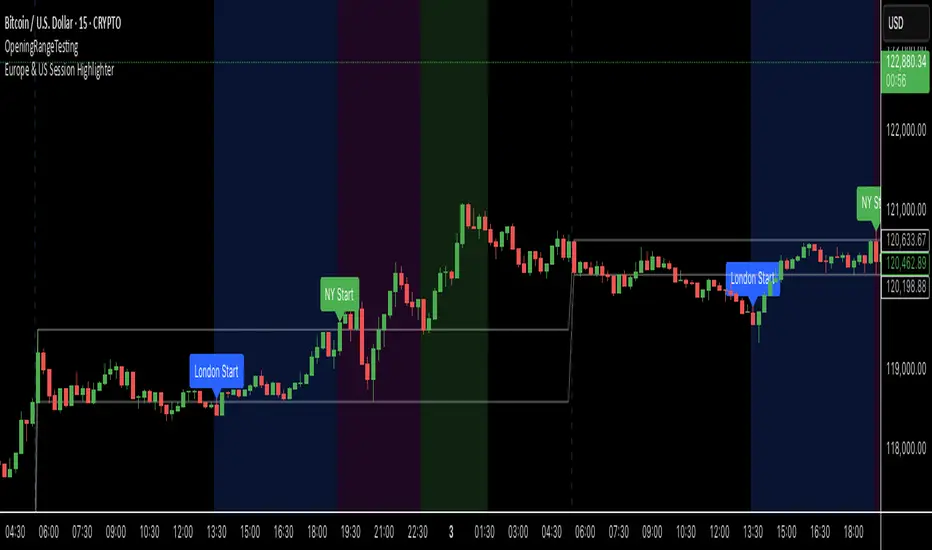
Europe & US Session Highlighter
Bitcoin trading volumes peak during the Europe-US session overlap (13:30–17:00 UTC), driven by institutional activity and market news. This indicator helps traders:
- Focus on high-liquidity periods for better trade execution.
- Avoid low-volume, high-volatility periods outside major sessions.
- Plan entries and exits during Bitcoin’s most active hours.
How to Use:
- Apply the indicator to any Bitcoin intraday chart (e.g., 1M, 5M, 15M).
- Look for blue (London), green (NY), or purple (overlap) backgrounds to identify active sessions.
Period Separator + Future LinesDescription
This indicator draws vertical separator lines for each selected timeframe (e.g., daily or hourly) and also projects additional separator lines into the future.
It helps traders visually divide the chart into consistent time periods and see upcoming period boundaries in advance.
Features
- Draws vertical lines at the start of each chosen period (daily by default).
- Extends several separator lines into the future so you can anticipate upcoming sessions.
- Fully customizable: color, style (solid/dashed/dotted), line width, and timeframe can be adjusted from the settings.
- Lines are plotted without distorting auto-scaling, so the chart view remains clean.
Use Case
Ideal for intraday and swing traders who want clear visual time markers and the ability to prepare for upcoming trading sessions.
