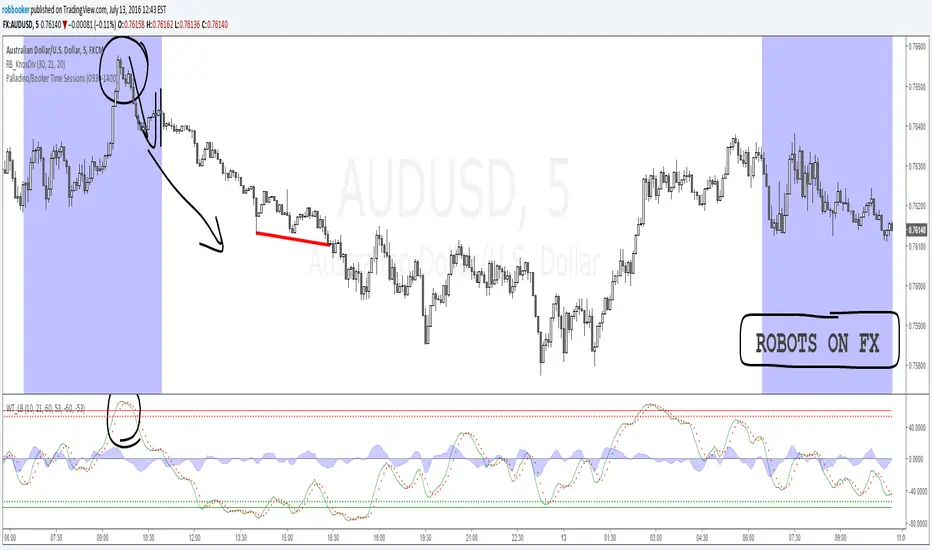
Palladino/Booker Time SessionsThe Palladino/Booker Time Sessions script will allow you to highlight certain periods of time during the day that are best suited to your trading. Add the script to your chart as many times as you like to highlight as many Time Sessions as you like.
Cari dalam skrip untuk "sessions"
BD SessionsSession boxes indicator for intraday charts.
Highlights up to four customizable market sessions using transparent boxes with clearly defined high/low ranges and labels.
Each session can be individually configured by name, time, timezone, and color.

Market Sessions V2🔄 MAJOR UPDATE v2.0
✨ NEW FEATURES:
- Live Info Panel with session status, timer, range & change%
- Average range statistics (based on history period)
- Weekend mode highlighting (Fri US Close → Mon Asia Open)
- Pre-market & Post-market tracking for US session (table only)
- Auto/Manual session times with validation
🔧 IMPROVEMENTS:
- Accurate official exchange hours (TSE 09:00-15:30, LSE 08:00-16:30, NYSE 09:30-16:00, ASX 10:00-16:00)
- Automatic DST handling via native timezones
- Tokyo Lunch Break indicator (11:30-12:30 JST)
- Works on all timeframes with smart adaptation (boxes ≤4H, table always)
- Bar Replay compatible
🛡️ RELIABILITY:
- Input validation for manual time entries
- Graceful handling of higher timeframes
- Optimized memory management
📖 For Forex/Crypto traders: Sessions show continuous trading hours.
Tokyo lunch (11:30-12:30 JST) is indicated in table only.

Simple Trading SessionsThis indicator highlights the major global trading sessions (Tokyo, London, and New York) directly on your chart with clean background shading.
Tokyo Session (default 00:00–09:00 exchange time)
London Session (default 07:00–16:00 exchange time)
New York Session (default 12:30–21:00 exchange time)
Each session is displayed as a different shaded block, making it easy to:
Spot when the market is most active.
Identify overlapping periods (e.g., London–New York overlap).
Backtest strategies that depend on session timing.
⚙️ How to Use
Add the indicator to any intraday chart.
Adjust session times in the settings panel to match your broker or preferred timezone.
Use the shading to guide your trading around regional liquidity zones.
✅ Notes
By default, session times follow the chart’s exchange timezone.
You can change the inputs to match your own session definitions.
Very lightweight and designed for traders who want a simple, uncluttered session map without extra calculations.

[TTM] ICT Sessions & Ranges🌟 Overview 🌟
The ICT Sessions & Ranges Indicator helps traders identify key intraday price levels by marking custom session highs/lows and opening ranges.
It helps traders spot potential liquidity grabs, reversals, and breakout zones by tracking price behavior around these key areas
🌟 Session Highs & Lows – Liquidity Zones 🌟
Session highs and lows often attract price due to stop orders resting above or below them. These levels are frequently targeted during high-volatility moves.
🔹 Asia Session
- Usually ranges in low volatility.
- Highs/lows often get swept during early London.
- Price may raid these levels, then reverse.
🔹 London Session
- First major volatility of the day.
- Highs/lows often tested or swept in New York.
- Commonly forms the day’s true high or low.
🌟 Opening Range Concepts 🌟
The Opening Range is the first 15, 30, or 60 minutes of a session (e.g., New York).
The high (ORH) and low (ORL) define the market’s initial balance and key reaction levels.
🔹 Breakout Trade
- Price breaks ORH/ORL with momentum.
- Signals directional intent.
- Traders enter on the breakout, with stops inside the range.
🔹 Liquidity Raid
- Price briefly breaks ORH/ORL to trigger stops.
- Reverses after the sweep.
- Look for structure shift and entry near FVG or OB.
🌟 Customizable Settings 🌟
The indicator includes 3 configurable ranges , each with:
Start & End Time – Set any custom time window.
Display Type – Choose Box (highlight range) or Lines (mark high/low).
Color Settings – Set custom colors for boxes and lines.
🌟 Default Settings 🌟
Range 1 : 19:00–00:00 (Asia Session)
Range 2 : 01:45–05:15 (London Session)
Range 3 : 09:30–10:00 (NY Opening Range – 30m)

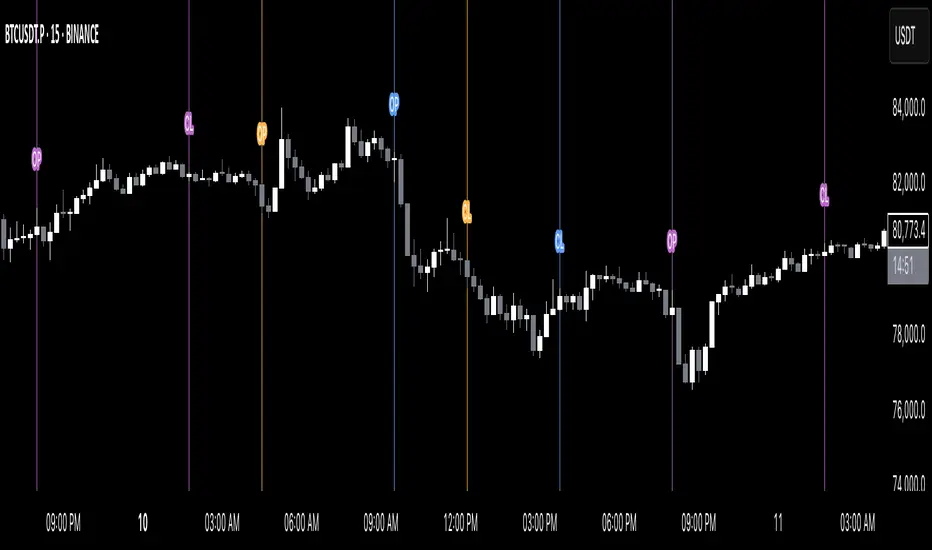
Simple Sessions========== TLDR ==========
The "Simple Sessions" indicator plots vertical lines and labels at the open and close of the US (New York), Asia (Tokyo), and Europe (London), daily session. The existing session indicators I could find all changed the background color of the chart for the entire session or added extra information to the chart that cluttered up my view. This is meant to be a less noisy and easy to interpret indication that the session you trade has started or is ending.
========== Features ==========
- Show or hide vertical lines for session opens and closes
- Show or hide labels for session opens and closes
- Show or hide each session individually
- Show or hide just the session close indications
- Change the color used for each session open and close
- Change the labels text, size, and text color
========== Limitations ==========
The session start and end times are hard coded in for their time zones and can't be changed:
- US (New York) - 9:30 - 16:00
- Asia (Tokyo) - 9:00 - 15:00
- Europe (London) - 8:30 - 16:30
========== Use Cases ==========
- Easily see when each session started and ended without the chart being too noisy
- Make it easier to identify price action patterns and trade setups that may occur on the open of each session
=============================
If you'd like more features or options feel free to request them in the comments.
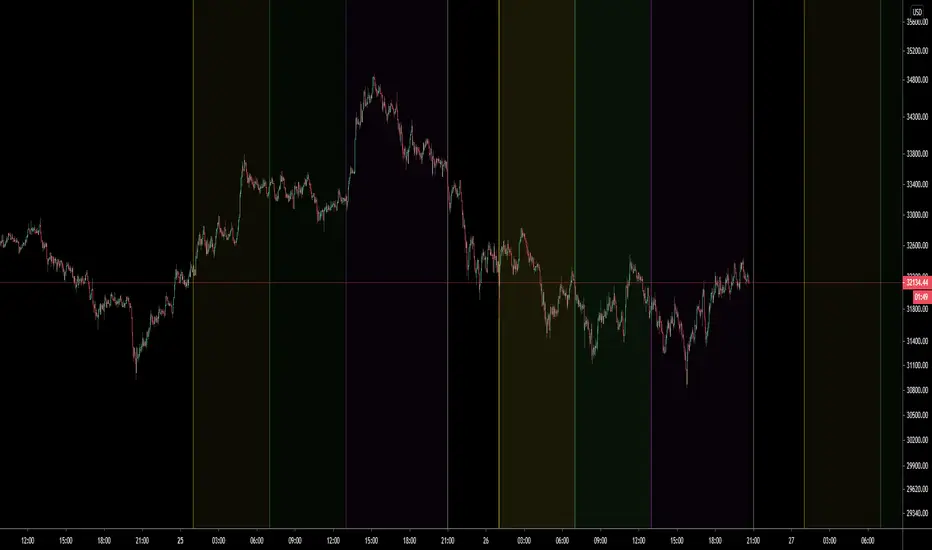
Indian Market Sessions for BacktestingThis indicator is designed to increase the quality of your backtesting in the Indian Market.
NSE & BSE run from 9:15 am IST to 3:30 pm IST.
Naturally different times have different kinds of volatility.
On your chart you will find premarked -
Saffron - 9:15 am to 10:30 am - Opening Session - High Volatility Observed Historically
White - 10:35 am to 2:25 pm - Middle Session - Lower Volatility Observed Historically
Green - 2:30 pm to 3:30 pm - Closing Session - Medium to High Volatility Observed Historically
You will also find the start of each session marked with an arrow.
Feel free to change the times from the input settings and the color and visibility from the style settings.
_______________
Usage:
When you backtest any strategies, say moving average crossovers, also mark the sessions in your sheet which will help you further increase accuracy.
Feel free to drop your doubts in the comments.

FVG Sessions [LuxAlgo]The FVG Sessions indicator highlights the first fair value gap of the trading session as well as the session range. Detected fair value gaps extend to the end of the trading session.
Alerts are included on the formation of a session fair value gap, price being within a session fair value gap, mitigations, and price crossing session fair value gaps average.
🔶 USAGE
Trader ICT states that the first fair value gap of the trading session can attract the most significant reaction. Having only one FVG per session allows users to further focus on that precise imbalance as well as external elements.
The mitigation of a fair value gap is clearly indicated on the chart with a more transparent color allowing users to see inverse FVGs.
Extending the fair value gaps allows the imbalance area to provide potential support and resistance.
Do note that this script should be used on intraday charts.
🔶 ALERTS
The script includes the following alerts:
🔹 Bullish/Bearish FVG
Alerts on the formation of the first bullish or bearish FVG of the session.
🔹 Bullish/Bearish FVG Mitigation
Alerts when the first bullish or bearish FVG of the session is mitigated.
🔹 Price Within FVG
Alerts when price is within the first bullish or bearish FVG area of the session.
🔹 Price Cross FVG Average
Alerts when price cross the average level of the first bullish or bearish FVG of the session.

Sessions By SaintSessions indicator for traders wanting to look for breakouts early. This tool will help you differentiate between Tokyo, London, New York and Sydney sessions on a daily basis with the option of a daily high and low view.

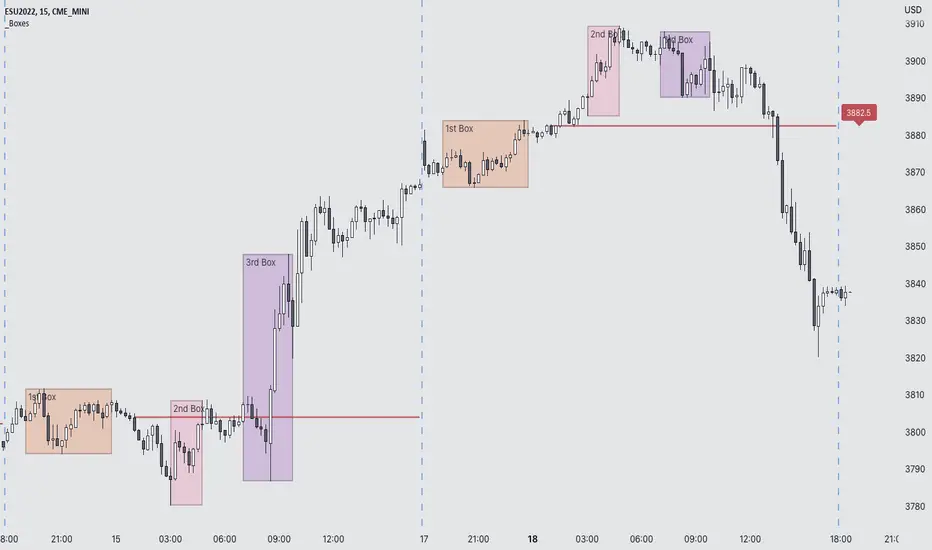
Futures Exchange Sessions 3.0Description
The ultimate conclusion to the Futures Exchange Sessions 2.0 indicator. In version 3.0 the user gets full control of the start and end times of three separate dynamic boxes and one horizontal line. If the user wants to visually keep track of killzones, lunches, or any other time span in a trading day, version 3.0 will dynamically expand and keep track of price within the time specified by the user.
Inputs and Style
Everything about the three dynamic boxes and one horizontal line can but independently configured. Color, style, border, width can all be adjusted. In the Settings each box has a text box so the user can give each one a unique name.
Timezone
All of the start and end times are in EST. Additionally, each box and line need a dependent start of each day. This is controlled by a setting where the user can specify a timezone called Start Day Timezone which would be midnight of the respective timezone. In general if a box or line resides within a particular Session pick the corresponding timezone. If the users box/line fits in the Asian Session then choose Asia/Shanghai. If the box/line is within the London Session then choose Europe/London. And the same goes for the New York Session.
Special Notes
If start time is within one period of the Start Day Timezone in the Settings, then the line/box won't display
Boxes and time lines only display when timeframe is <= 30 minute
To turn off box text label set opacity to 0%
Market Sessions Open/Close LevelsThis indicator displays the market open and close price levels for the main trading sessions (Sydney, Tokyo, Frankfurt, London and New York). The Daily Line changes color depending on if price is trading above or below the level. Feel free to add or replace levels depending on your trading style and trading times.

Yesterday's RTH&ON sessions OHLCsThe indicator plots the OHLC levels of both trading sessions of the day before: the overnight session and the Regular Trading Hours.

NRD Sessions Basic FunctionsThis script is an extension and modification of a popular BackGround color script.
Added
1. Style and programming standards to make is easier to read and modify
2. broke out Asia to Sydney and Tokyo Sessions
3. added override to show ICT Kill zones for London and New York
4. Made all this configurable via settings Menu
Enjoy
watch this space as I intend to do more complex session scripts to allow for High and Lows and Mondays too :-)

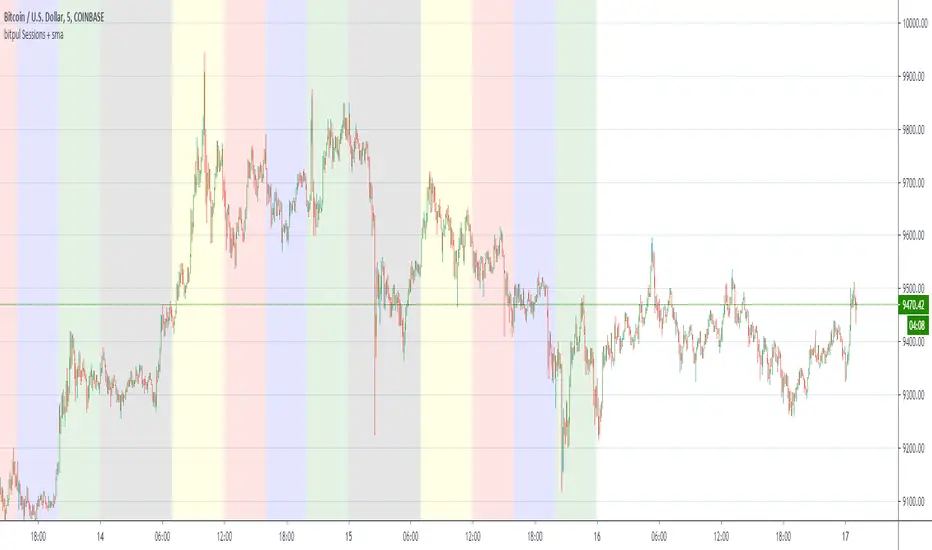
bitpul Sessions + sma [MHMK]Background colors that show open-close of the major market sessions ( Tokyo, London, joint time, New York, free time).
I added two sma to get more confirmation for the reversal - You can hide smas


Sum and Subtract Hours and Minutes to Sessions SampleThis indicators it's a programming sample of how to sum and subtract hours and minutes to sessions on Tradingview

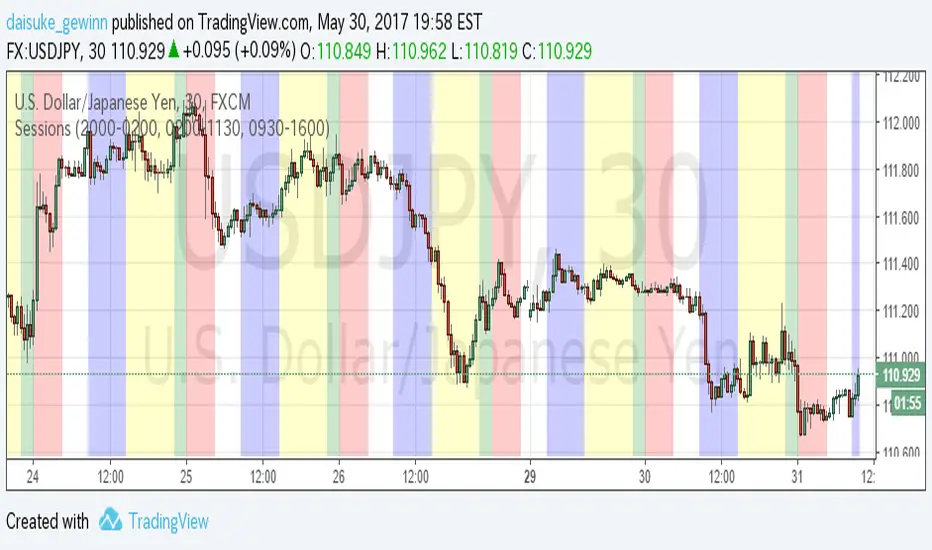
Time Sessions for FXCMThis indicator show Japan, EU and USA sessions for Currency.
The default parameters setting for FXCM summer time.(UTC-4)
英語の意味があっているか自信がないため、日本語でも書いておきます。
Trading Viewの通貨チャートで日本時間、EU時間、アメリカ時間を表示するインジケータです。
夏時間の自動判別などは入れていません。デフォルト設定はFXCMのUTC-4に合わせています。
もっと汎用的に作りたかったのですが、すごく面倒な感じになってしまったので、まずシンプルに
作成しました。
Timezone Sessions IndicatorBasic timezones and sessions indicator
I have mine collapsed down to a minimum height and it serves only to indicate the time in a more visual way.

Forex Trading Sessions with Daylight Savings TimeV1 - Max WarrenDifferent version of the CM one but everything is configurable and easy to manage.
Daylight savings may also be toggled, I cannot automatically toggle it yet but hopefully with a pine update I will be able to.
It had the four main sessions but version two could possibly have all of them as optional toggles
Hope it is useful

Sessions and High/Low/andrewSessions and High/Low/andrew
this indictors covers all the session high and low including frankfurt

