Fear & Greed [theUltimator5]This indicator attempts to replicate CNN's Fear & Greed Index methodology to measure market sentiment on a scale from 0-100. It combines seven key market components into a single sentiment score, where lower values indicate fear and higher values indicate greed.
Note: It is impossible to perfectly replicate the true Fear & Greed indicator due to data limitations, so this indicator attempts to best replicate the output for each of the (7) components using available data.
The uniqueness of this indicator comes from the calculation methods for the 7 components as well as the visual representation of the data, which includes a table and selectable plots for each of the 7 components which make up the overall sentiment. Existing variants of the Fear & Greed Index have substantial flaws in the calculations of several of the components which result in warped final sentiment numbers. This indicator attempts to better track all 7 components and provide a closer model to the actual Fear & Greed index.
Here are the seven components and a brief description of how each are calculated:
1. Market Momentum
Calculation: S&P 500 current price vs. 125-day moving average
Measures how far the market has moved from its long-term trend
Uses CNN-style Z-score normalization over 252 trading days
Higher values indicate strong upward momentum (greed)
Lower values suggest declining momentum (fear)
2. Stock Strength
Calculation: S&P 500 RSI scaled to 252-day range
Uses 14-period RSI of the S&P 500 index
Normalizes RSI values based on their 252-day minimum and maximum
Measures overbought/oversold conditions relative to recent history
Higher values indicate overbought conditions (greed)
Lower values suggest oversold conditions (fear)
3. Price Breadth
Calculation: Modified McClellan Oscillator
Primary: Uses NYSE advancing vs. declining issues with 7-day smoothing
Fallback: Compares sector performance (QQQ, IWM vs. SPY)
Measures how many stocks participate in market moves
Broader participation indicates healthier trends
Narrow breadth suggests selective or weak trends
4. Put/Call Ratio
Calculation: Inverted CBOE Put/Call ratios
Primary: CBOE Equity-only Put/Call ratio (more sensitive)
Fallback: CBOE Total Put/Call ratio
Uses 5-day average and applies CNN normalization
Higher put/call ratios indicate fear (inverted to lower scores)
Lower put/call ratios suggest complacency (higher scores)
5. Market Volatility
Calculation: VIX relative to its 50-day average
Compares current VIX level to its 50-day moving average
Measures deviation from normal volatility expectations
Higher VIX relative to average indicates fear (lower scores)
Lower relative VIX suggests complacency (higher scores)
6. Safe Haven Demand
Calculation: Stock returns vs. bond yield changes
Compares 20-day smoothed S&P 500 returns to Treasury yield changes
When stocks outperform bonds, indicates risk appetite (higher scores)
When bonds outperform stocks, suggests risk aversion (lower scores)
Uses Treasury 10-year yields as the safe haven benchmark
7. Junk Bond Demand
Calculation: High-yield bond spread analysis
Measures yield spread between junk bonds (JNK ETF) and Treasuries
Compares current spread to its 5-day average
Narrowing spreads indicate risk appetite (higher scores)
Widening spreads suggest risk aversion (lower scores)
The combined sentiment is plotted as a single line which changes color based on the current sentiment value.
0-25: Extreme Fear (Red) - Market panic, oversold conditions
26-45: Fear (Orange) - Cautious sentiment, bearish bias
46-55: Neutral (Yellow) - Balanced market sentiment
56-75: Greed (Light Green) - Optimistic sentiment, bullish bias
76-100: Extreme Greed (Green) - Market euphoria, potentially overbought
There are dashed lines to represent the threshold values for each of the sentiments to better visualize transitions.
The table displays each of the (7) components of the index and their respective values. The table can be toggled on/off and the position can be moved.
An optional secondary line can be toggled on to display (1) of the (7) components as a unique color and the component name and value will highlight on the table. The secondary line can be used to dig into the main driving forces behind the overall index value.
Cari dalam skrip untuk "spy"

Benchmark Relative Performance BRPBenchmark Relative Performance (BRP) is a comprehensive technical analysis tool that compares any stock's performance against a chosen benchmark (QQQ, SPY, IWM, etc.) to identify outperformance and underperformance patterns.
Key Features:
Dual-line visualization: Shows both ticker and relative strength performance
Dynamic color coding: 5-level color system indicating performance strength
Customizable benchmark: Choose from any ticker via TradingView's symbol picker
Volume weighting: Optional volume analysis for stronger signal confirmation
Performance zones: Visual thresholds for strong/moderate performance levels
Compact info table: Real-time performance status and values
What It Shows:
Benchmark Performance Line (Blue): Shows your chosen benchmark's percentage performance
Relative Strength Line (Color-coded): Shows how much the ticker outperforms/underperforms
Fill Area: Visual gap between ticker and benchmark performance
Performance Zones: Dotted lines marking significant performance thresholds
Color System:
Green: Strong outperformance (above custom threshold)
Lime: Standard outperformance
Yellow: Neutral/Equal performance
Orange: Standard underperformance
Red: Strong underperformance (below custom threshold)
Best Used For:
Stock selection and rotation strategies
Sector/ETF relative strength analysis
Identifying momentum shifts vs benchmarks
Portfolio performance evaluation
Market timing based on relative performance
Settings:
Customizable lookback period (default: 20)
Adjustable strong performance threshold (default: 5%)
Optional volume weighting factor
Full table customization (position, colors, fonts)
Performance display (percentage or decimal)
Perfect for traders and investors who want to identify stocks showing relative strength or weakness compared to major market benchmarks.

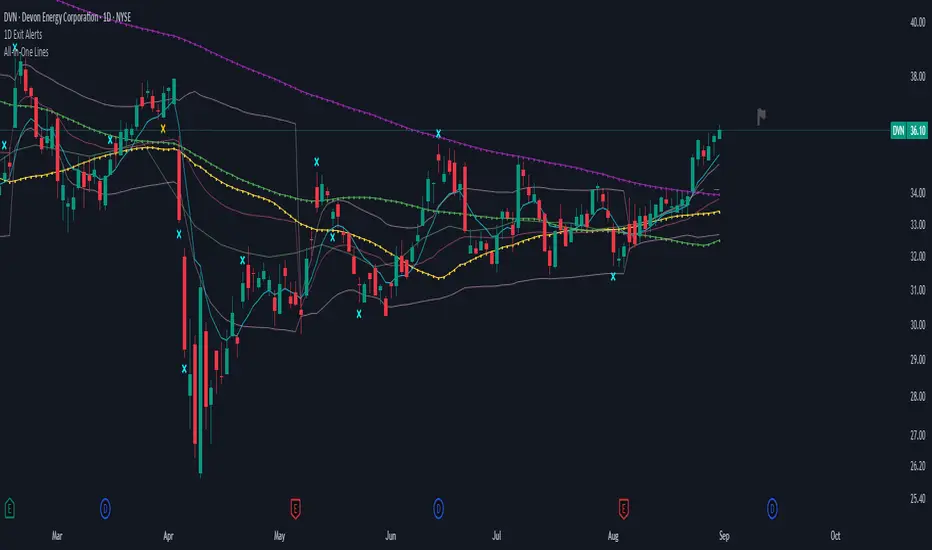
1D Exit Alerts"A Daily Exit LONG" + "B Daily Exit SHORT":
I'm not using this one anymore since they often make me worry more than necessary, and I focus more on aiming to reach specific price targets, or using the 5m Exit alerts instead.
Also swing trades require less time-sensitive operations than day trades, so for me personally they felt a bit redundant.
But maybe it helps some of you:
There are 4 conditions that trigger it. As with 5m Exit Alerts, the triggering reasons show up in the exit alert message (unfortunately only as a number, since alert messages can't have "dynamic text" in TradingView).
Here are the conditions sorted from best to worst:
Gap Up / Down. Better check SPY and the stock whether a Gap Reversal is likely to happen (aka get out) or whether the stock will keep going higher / lower.
Earnings: End of day or Tomorrow morning. Alert is triggered at beginning of morning before earnings, and then again 15m before market close.
Mental stop loss: Broke daily EMA 8 or SMA - in the wrong direction....
Wrong direction: Broke below / above yesterday's Low / High. It's not immediately triggered, but only after re-touching VWAP again, to prevent too impulsive exits.
As with 5m Exit alerts: Always consider how the market and stock looks like, then decide whether to exit or not! These are meant to make you look at the chart, not to FOMO-exit.
"X Candle Close":
Same as in 1D Enter alert: Is triggered 15m before market close (I put it in here as well because I kept forgetting whether I put this one into Enter or Exit alerts...)
More infos: www.reddit.com
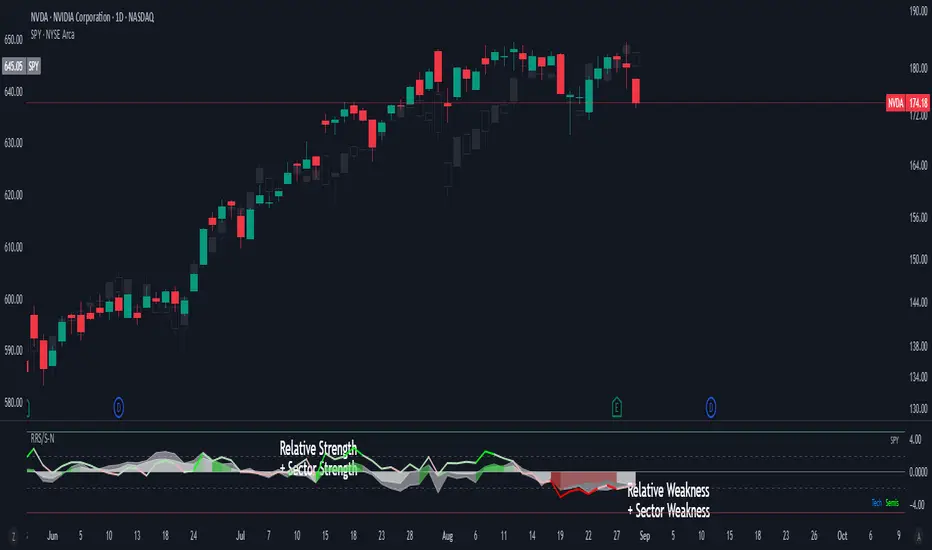
Real Relative Sector Strength - NormalizedShows RS/RW, which is esp. helpful if it's not fully clear based on the stock's chart movement compared to SPY's movement.
"Glowing green" = safely strong
"Glowing red" = safely weak
More infos: www.reddit.com
All-In-One LinesIt's like a "torch in the darkness" that shows the "terrain" in which you are trading, and in which the candle movement unfolds.
It is meant to be used on 5m + 1D intervals. Additionally useful on 15m, 30m, and 1W if you use these.
Shows:
VWAP (on < 1D interval)
EMA 8 from 5m/15m/30m/1D/1W
Yesterday's High (on < 1D interval)
Yesterday's Low (on < 1D interval)
SMA 50/100/200
AVWAPE / AVWAPQ (if SPY) incl. +1/-1 Stdev for each
More infos: www.reddit.com

ForecastForecast (FC), indicator documentation
Type: Study, not a strategy
Primary timeframe: 1D chart, most plots and the on-chart table only render on daily bars
Inspiration: Robert Carver’s “forecast” concept from Advanced Futures Trading Strategies, using normalized, capped signals for comparability across markets
⸻
What the indicator does
FC builds a volatility-normalized momentum forecast for a chosen symbol, optionally versus a benchmark. It combines an EWMAC composite with a channel breakout composite, then caps the result to a common scale. You can run it in three data modes:
• Absolute: Forecast of the selected symbol
• Relative: Forecast of the ratio symbol / benchmark
• Combined: Average of Absolute and Relative
A compact table can summarize the current forecast, short-term direction on the forecast EMAs, correlation versus the benchmark, and ATR-scaled distances to common price EMAs.
⸻
PineScreener, relative-strength screening
This indicator is excellent for screening on relative strength in PineScreener, since the forecast is volatility-normalized and capped on a common scale.
Available PineScreener columns
PineScreener reads the plotted series. You will see at least these columns:
• FC, the capped forecast
• from EMA20, (price − EMA20) / ATR in ATR multiples
• from EMA50, (price − EMA50) / ATR in ATR multiples
• ATR, ATR as a percent of price
• Corr, weekly correlation with the chosen benchmark
Relative mode and Combined mode are recommended for cross-sectional screens. In Relative mode the calculation uses symbol / benchmark, so ensure the ratio ticker exists for your data source.
⸻
How it works, step by step
1. Volatility model
Compute exponentially weighted mean and variance of daily percent returns on D, annualize, optionally blend with a long lookback using 10y %, then convert to a price-scaled sigma.
2. EWMAC momentum, three legs
Daily legs: EMA(8) − EMA(32), EMA(16) − EMA(64), EMA(32) − EMA(128).
Divide by price-scaled sigma, multiply by leg scalars, cap to Cap = 20, average, then apply a small FDM factor.
3. Breakout momentum, three channels
Smoothed position inside 40, 80, and 160 day channels, each scaled, then averaged.
4. Composite forecast
Average the EWMAC composite and the breakout composite, then cap to ±20.
Relative mode runs the same logic on symbol / benchmark.
Combined mode averages Absolute and Relative composites.
5. Weekly correlation
Pearson correlation between weekly closes of the asset and the benchmark over a user-set length.
6. Direction overlay
Two EMAs on the forecast series plus optional green or red background by sign, and optional horizontal level shading around 0, ±5, ±10, ±15, ±20.
⸻
Plots
• FC, capped forecast on the daily chart
• 8-32 Abs, 8-32 Rel, single-leg EWMAC plus breakout view
• 8-32-128 Abs, 8-32-128 Rel, three-leg composite views
• from EMA20, from EMA50, (price − EMA) / ATR
• ATR, ATR as a percent of price
• Corr, weekly correlation with the benchmark
• Forecast EMA1 and EMA2, EMAs of the forecast with an optional fill
• Backgrounds and guide lines, optional sign-based background, optional 0, ±5, ±10, ±15, ±20 guides
Most plots and the table are gated by timeframe.isdaily. Set the chart to 1D to see them.
⸻
Inputs
Symbol selection
• Absolute, Relative, Combined
• Vs. benchmark for Relative mode and correlation, choices: SPY, QQQ, XLE, GLD
• Ticker or Freeform, for Freeform use full TradingView notation, for example NASDAQ:AAPL
Engine selection
• Include:
• 8-32-128, three EWMAC legs plus three breakouts
• 8-32, simplified view based on the 8-32 leg plus a 40-day breakout
EMA, applied to the forecast
• EMA1, EMA2, with line-width controls, plus color and opacity
Volatility
• Span, EW volatility span for daily returns
• 10y %, blend of long-run volatility
• Thresh, Too volatile, placeholders in this version
Background
• Horizontal bg, level shading, enabled by default
• Long BG, Hedge BG, colors and opacities
Show
• Table, Header, Direction, Gain, Extension
• Corr, Length for correlation row
Table settings
• Position, background, opacity, text size, text color
Lines
• 0-lines, 10-lines, 5-lines, level guides
⸻
Reading the outputs
• Forecast > 0, bullish tilt; Forecast < 0, bearish or hedge tilt
• ±10 and ±20 indicate strength on a uniform scale
• EMA1 vs EMA2 on the forecast, EMA1 above EMA2 suggests improving momentum
• Table rows, label colored by sign, current forecast value plus a green or red dot for the forecast EMA cross, optional daily return percent, weekly correlation, and ATR-scaled EMA9, EMA20, EMA50 distances
⸻
Data handling, repainting, and performance
• Daily and weekly series are fetched with request.security().
• Calculations use closed bars, values can update until the bar closes.
• No lookahead, historical values do not repaint.
• Weekly correlation updates during the week, it finalizes on weekly close.
• On intraday charts most visuals are hidden by design.
⸻
Good practice and limitations
• This is a research indicator, not a trading system.
• The fixed Cap = 20 keeps a common scale, extreme moves will be clipped.
• Relative mode depends on the ratio symbol / benchmark, ensure both legs have data for your feed.
⸻
Credits
Concept inspired by Robert Carver’s forecast methodology in Advanced Futures Trading Strategies. Implementation details, parameters, and visuals are specific to this script.
⸻
Changelog
• First version
⸻
Disclaimer
For education and research only, not financial advice. Always test on your market and data feed, consider costs and slippage before using any indicator in live decisions.

Market BreadthMarket breadth is a technical analysis technique that gauges the strength or weakness of moves in a major index.
Supported index ETF: SPY, NDX, DIA, IWM, OEF, MDY, IWB, IWV.
Supported sector index ETF: XLK, XLC, XLY, XLP, XLV, XLU, XLF, XLRE, XLE, XLB, XLI.

Ludvig Indicator PROThe Ludvig Indicator is designed to identify high-probability breakout setups by combining trend, volume, volatility, and relative strength filters. It helps you enter stocks (or ETFs/crypto) when institutional money is likely flowing in, while avoiding false breakouts and weak trends.
🔑 Core Features
Zero-Lag EMA (ZLEMA)
Faster, less lagging trend detection compared to traditional EMAs.
Used as the basis for dynamic ATR bands.
ATR Volatility Bands
Adaptive bands based on the Average True Range (ATR).
Define the zone where price must close outside to confirm trend strength.
Breakout Confirmation
Requires price to close above recent highs (lookback configurable).
Ensures signals are “true breakouts,” not just noise around moving averages.
Volume Filter (Relative Volume)
Validates breakouts with significantly higher volume than average.
Prevents low-liquidity signals from triggering.
Trend Strength (ADX)
Built-in ADX calculation ensures only strong, trending moves are considered.
Default filter: ADX ≥ 18 (configurable).
Relative Strength vs. Benchmark
Compares the asset’s momentum against a benchmark (default: SPY).
Only signals when the asset is outperforming the benchmark.
Useful for sector rotation and picking leaders instead of laggards.
Alerts & Signals
Breakout entries are marked with small green triangles.
Built-in alerts for automated notifications (TradingView alerts).

ABS NR — Fail-Safe Confirm (v4.2.2)
# ABS NR — Fail-Safe Confirm (v4.2.2)
## What it is (quick take)
**ABS NR FS** is a **non-repainting “arm → confirm” entry framework** for intraday and swing execution. It blends:
* **Regime** (EMA stack + 60-min slope),
* **Location** (Keltner basis/edges),
* **Stretch** (session-anchored **VWAP Z-score**),
* **Momentum gating** (TSI cross/slope),
* **Guards** (session window, minimum ATR%, gap filter, optional market alignment).
You’ll see a **small dot** when a setup is **armed** (candidate) and a **triangle** when that setup **confirms** within a user-defined number of bars. A **gray “X”** marks a timeout (candidate canceled).
> Tip: This entry tool works best when paired with a trend context filter and a dedicated exit tool.
---
## How to use it (operational workflow)
1. **Read the regime**
* **Bull trend**: fast > slow > long EMA **and** 60-min slope up.
* **Bear trend**: fast < slow < long EMA **and** 60-min slope down.
* **Range**: neither bull nor bear.
2. **Wait for a candidate (dot)**
Two families:
* **Reclaim (trend-following):** price crosses the **KC basis** with acceptable |Z| (not overstretched) and passes the TSI gate.
* **Fade (range-revert):** price **pokes a KC band**, prints a **reversal wick**, |Z| is stretched, and TSI gate agrees.
3. **Trade the confirmation (triangle)**
The confirm must occur **within N bars** and follow your chosen **Confirm mode** logic (see Inputs). If confirmation doesn’t arrive in time, an **X** cancels the candidate.
4. **Use guards to avoid junk**
Session windows (US focus), minimum ATR%, gap guard, and optional **market alignment** (e.g., SPY above EMA20 for longs).
5. **Manage the position**
* Entries: take **triangles** in the direction of your playbook (reclaims with trend; fades in clean ranges).
* Filters and exits: use your own process or pair with a trend/exit companion.
---
## Visual semantics & alerts
* **Candidate L / S (dot)** → a setup armed on this bar.
* **CONFIRM L / S (triangle)** → actionable signal that met confirm rules within your time window.
* **Cancel L / S (X)** → candidate expired without confirmation; ignore the dot.
**Alerts (stable names for automation):**
* **ABS FS — Confirmed** → fires on confirmed long or short.
* **ABS FS — Candidate Armed** → fires as a candidate arms.
---
## Non-repainting behavior (why signals don’t repaint)
* All HTF requests use **lookahead\_off**.
* With **Strict NR = true**, the 60-min slope uses the **prior completed** 60-min bar and arming/confirming only occurs on confirmed bars.
* Confirmation triangles finalize on bar close.
* If you disable strictness, signals may appear slightly earlier but with more intrabar sensitivity.
---
## Inputs reference (what each control does and the trade-offs)
### A) Behavior / Modes
**Mode** (`Turbo / Aggressive / Balanced / Conservative`)
Changes multiple internal thresholds:
* **Turbo** → most signals; relaxes prior-bar break & VWAP-side checks and time/vol/gap guards. Highest frequency, highest noise.
* **Aggressive** → more signals than Balanced, fewer than Turbo.
* **Balanced** → default; steady trade-off of frequency vs. quality.
* **Conservative** → tightens |Z| and other checks; fewest but cleanest signals.
**Strict NR (bar close + prior HTF 60m)**
* **true** = safer: uses prior 60-min slope; arms/confirms on confirmed bars → **fewer/cleaner** signals.
* **false** = earlier and more reactive; slightly noisier.
---
### B) Keltner Channel (location engine)
* **KC EMA Length (`kcLen`)**
Higher → smoother basis (fewer basis crosses). Lower → snappier basis (more crosses).
* **ATR Length (`atrLen`)**
Higher → steadier band width; Lower → more reactive band width.
* **KC ATR Mult (`kcMult`)**
Higher → wider bands (fewer edge pokes → fewer fades). Lower → narrower (more fades).
---
### C) Trend & HTF slope
* **Trend EMA Fast/Slow/Long (`emaFastLen / emaSlowLen / emaLongLen`)**
Larger = slower regime flips (fewer reclaims); smaller = faster flips (more reclaims).
* **HTF EMA Len (60m) (`htfLen`)**
Larger = steadier HTF slope (fewer signals); smaller = more sensitive (more signals).
---
### D) VWAP Z-Score (stretch / mean-revert logic)
* **VWAP Z-Length (`zLen`)**
Window for Z over session-anchored VWAP distance. Larger = smoother |Z| (fewer fades/re-entries). Smaller = more reactive (more).
* **Range Fade |Z| (base) (`zFadeBase`)**
Minimum |Z| to allow **fades** in ranges. Raise to demand more stretch (fewer fades). Lower to take more fades.
* **Max |Z| Trend Re-entry (base) (`maxZTrendBase`)**
Caps how stretched price can be and still permit **reclaims** with trend. Lower = stricter (avoid chases). Higher = will chase further.
---
### E) TSI Momentum Gate
* **TSI Long/Short/Signal (`tsiLong / tsiShort / tsiSig`)**
Larger = smoother/laggier momentum; smaller = snappier.
* **TSI gate (`CrossOnly / CrossOrSlope / Off`)**
* **CrossOnly**: require TSI cross of its signal (strict).
* **CrossOrSlope**: cross *or* favorable slope (balanced default).
* **Off**: no momentum gate (most signals, most noise).
---
### F) Guards (filters to avoid low-quality tape)
* **US focus 09:35–10:30 & 14:00–15:45 (base) (`useTimeBase`)**
`true` limits to high-quality windows. `false` trades all session.
* **Skip N bars after 09:30 ET (`skipFirst`)**
Skips the open scramble. Larger = skip longer.
* **Min volatility ATR% (base)** = `useVolMinBase` + `atrPctMinBase`
Requires `ATR(10)/Close*100 ≥ atrPctMinBase`. Raise threshold to avoid dead tape; lower to accept quieter sessions.
* **Gap guard (base)** = `gapGuardBase` + `gapMul`
Blocks signals when the opening gap exceeds `gapMul * ATR`. Increase `gapMul` to allow more gapped opens; decrease to be stricter.
---
### G) Visuals & Sides
* **Plot Keltner (`plotKC`)** → show/hide basis & bands.
* **Show Longs / Show Shorts** → enable/disable each side.
---
### H) Fail-Safe Confirmation
* **Confirm mode (`BreakHighOnly / BreakHigh+Hold / TwoBarImpulse`)**
* **BreakHighOnly**: confirm by taking out the armed bar’s extreme. Fastest, most frequent.
* **BreakHigh+Hold**: must **break**, have **body ≥ X·ATR**, **and** hold above/below the basis → higher quality, fewer signals.
* **TwoBarImpulse**: decisive follow-through vs. prior bar with **body ≥ X·ATR** → momentum-biased confirmations.
* **Confirm within N bars (`confirmBars`)**
Confirmation window size. Smaller = faster validation; larger = more patience (can be later).
* **Impulse body ≥ X·ATR (`impulseBodyATR`)**
Raise for stronger confirmations (fewer weak triangles). Lower to accept lighter pushes.
* **Require market alignment (`needMarket`) + `marketTicker`**
When enabled: Longs require **market > EMA20 (5m)**; Shorts require **market < EMA20 (5m)**.
* **Diagnostics: Show debug letters (`debug`)**
Tiny “B/C” audit marks for base/confirm while tuning.
---
## Tuning recipes (quick, practical)
* **If you’re getting chopped:**
* Set **Mode = Conservative**
* **Confirm mode = BreakHigh+Hold**
* Raise **impulseBodyATR** (e.g., 0.45)
* Keep **needMarket = true**
* Keep **Strict NR = true**
* **If you need more signals:**
* **Mode = Aggressive** (or Turbo if you accept more noise)
* **Confirm mode = BreakHighOnly**
* Lower **impulseBodyATR** (0.25–0.30)
* Increase **confirmBars** to 3
* **Range-day focus (fades):**
* Keep session guard on
* Raise **zFadeBase** to demand real stretch
* Keep **maxZTrendBase** moderate (don’t chase)
* **Trend-day focus (reclaims):**
* Slightly **lower `maxZTrendBase`** (avoid chasing excessive stretch)
* Use **CrossOrSlope** TSI gating
* Consider turning **needMarket** on
---
## Best practices & notes
* **Instrument specificity:** Tune Z, TSI, and guards per symbol and timeframe.
* **Session awareness:** Session filter uses **exchange-local** time; adjust for non-US markets.
* **Automation:** Use the two provided alert names; they’re stable.
* **Risk management:** Confirmation improves quality but doesn’t remove risk. Always pre-define stop/size logic.
---
## Suggested starting point (balanced profile)
* **Mode = balanced**
* **Strict NR = true**
* **Confirm mode = BreakHigh+Hold**
* **confirmBars = 2**
* **impulseBodyATR ≈ 0.35**
* **needMarket = off** (turn on for extra confluence)
* Leave Keltner/TSI defaults; then nudge `zFadeBase` and `maxZTrendBase` to match your symbol.
---
*This tool is a signal generator, not a broker or strategy. Validate on your markets/timeframes and integrate with your risk plan.*

Whaley Thrust — ADT / UDT / SPT (2010) + EDT (EMA) + Info BoxDescription
Implements Wayne Whaley’s 2010 Dow Award breadth-thrust framework on daily data, with a practical extension:
• ADT (Advances Thrust) — 5-day ratio of advances to (adv+dec). Triggers: > 73.66% (thrust), < 19.05% (capitulation).
• UDT (Up-Volume Thrust) — 5-day ratio of up-volume to (up+down). Triggers: > 77.88%, < 16.41%. Defaults to USI:UVOL / USI:DVOL (edit if your feed differs).
• SPT (Price Thrust) — 5-day % change of a benchmark (default SPY, toggle to use chart symbol). Triggers: > +10.05%, < −13.85%.
• EDT (EMA extension) — Declines-share thrust derived from WBT logic (not in Whaley’s paper): EMA/SMA of Declines / (Adv+Decl). Triggers: > 0.8095 (declines thrust), < 0.2634 (declines abating).
• All-Clear — Prints when ADT+ and UDT+ occur within N days (default 10); marks the second event and shades brighter green.
Visuals & Controls
• Shape markers for each event; toggle text labels on/off.
• Optional background shading (green for thrusts, red for capitulations; brighter green for All-Clear).
• Compact info box showing live ADT / UDT / SPT (white by default; turns green/red at thresholds).
• Min-spacing filter to prevent duplicate prints.
Tips
• Use on Daily charts (paper uses 5 trading days). Weekly views can miss mid-week crosses.
• If UDT shows 100%, verify your Down Volume symbol; the script requires both UVOL and DVOL to be > 0.
• Best use: treat capitulations (−) as setup context; act on thrusts (+)—especially when ADT+ & UDT+ cluster (All-Clear).
Credit
Core method from Wayne Whaley (2010), Planes, Trains and Automobiles (Dow Award). EDT is an added, complementary interpretation using WBT-style smoothing.

Relative Strength Buy/Sell SignalsThis Pine Script builds on the MarketSurge-style Relative Strength indicator. It calculates the RS line by comparing the stock's close to a benchmark (default: SPY). Buy signals are generated when the RS line crosses above its moving average (default 10-period SMA), indicating improving relative strength. Sell signals occur when it crosses below, suggesting weakening relative strength. Signals are labeled "BUY" (green) and "SELL" (red) on the chart, with background highlights.
It also retains the new 52-week RS highs (orange circles) and lows (purple circles), which can serve as additional confirmation for outperformance or underperformance.
Note: This approximates relative strength for trading signals but does not replicate the proprietary IBD RS Rating (a 1-99 percentile rank across all stocks). For best results, use on daily charts and combine with other analysis. Backtest thoroughly, as no strategy guarantees profits

Signal Stack MeterWhat it is
A lightweight “go or no‑go” meter that combines your manual read of Structure, Location, and Momentum with automatic context from volatility and macro timing. It surfaces a single, tradeable answer on the chart: OK to engage or Standby.
Why traders like it
You keep your discretion and nuance, and the meter adds guardrails. It prevents good trade ideas from being executed in the wrong conditions.
What it measures
Manual buckets you set each day: Structure, Location, Momentum from 0 to 2
Volatility from VIX, term structure, ATR 5 over 60, and session gaps
Time windows for CPI, NFP, and FOMC with ET inputs and an exchange‑offset
Total score and a simple gate: threshold plus a “strong bucket” rule you choose
How to use in 30 seconds
Pick a preset for your market.
Set Structure, Location, Momentum to 0, 1, or 2.
Leave defaults for the auto metrics while you get a feel.
Read the header. When it says OK to engage, you have both your read and the context.
Defaults we recommend
OK threshold: 5
Strong bucket rule: Either Structure or Location equals 2
VIX triggers: 22 and 1.25× the 20‑SMA
Term mode: Diff at 0.00 tolerance. Ratio mode at 1.00+ is available
ATR 5/60 defense: 1.25. Offense cue: 0.85 or lower
ATR smoothing: 1
Gap mode: RTH with 0.60× ATR5 wild gap. ON wild range at 0.80× ATR5
CPI window 08:25 to 08:40 ET. FOMC window 13:50 to 14:30 ET
ET to exchange offset: −60 for CME index futures. Set to 0 for NYSE symbols like SPY
Alert cadence: Once per RTH session. Snooze first 30 minutes optional
New since the last description
Parity with Defense Mode for presets, sessions, ratio vs diff term mode, ATR smoothing, RTH‑key cadence, and snooze options
Event windows in ET with a simple offset to your exchange time
Alternate row backgrounds and full color control for readability
Exposed series for automation: EngageOK(1=yes) plus TotalScore
Debug toggle to see ATR ratio, term, and gap measurements directly
Notes
Dynamic alerts require “Any alert() function call”.
The meter is designed to sit opposite Defense Mode on the chart. Use the position input to avoid overlap.

RS Ratio vs Benchmark (Colored)📈 RS Ratio vs Benchmark (with Color Change)
A simple but powerful tool to track relative strength against a benchmark like QQQ, SPY, or any other ETF.
🔍 What it Shows
RS Ratio (orange line): Measures how strong a stock is relative to a benchmark.
Moving Average (teal line): Smooths out RS to show trend direction.
Color-coded RS Line:
🟢 Green = RS is above its moving average → strength is increasing.
🔴 Red = RS is below its moving average → strength is fading.
📊 How to Read It
Above 100 = Stock is outperforming the benchmark.
Below 100 = Underperforming.
Rising & Green = Strongest signal — accelerating outperformance.
Above 100 but Red = Consolidating or losing momentum — potential rest period.
Crosses below 100 = Warning sign — underperformance.
✅ Best Uses
Spot leading stocks with strong momentum vs QQQ/SPY.
Identify rotation — when strength shifts between sectors.
Time entries and exits based on RS trends and crossovers.

RSI Cloud Zones (by AButterfly)RSI instruction: Uptrend market only. LONG only. Should use only when SPY and QQQ are above 50 SMA and 200 SMA, and the 50sma is above 200sma, and RSI(14) is above 50 ............... BUY only in the GREEN area. Do NOT buy above GREEN green area. That would be chase (after a train, a ship that left). Take profit in the RED area, preferably on a green candle. This does not encourage SHORT-ing. LONG only. Disclaimer: This is an entertainment. If you lose money, don't blame this indicator or the creator. You have to pay attention to whether the market is on uptrend.

Dark Pool Block Trades - Institutional Volume📊 Dark Pool Block Trades - Institutional Volume
Visualize where institutional money positions before major price moves occur. This indicator reveals hidden dark pool block trades that often precede significant price movements - because when smart money deploys millions and billions in strategic accumulation or distribution, retail traders need to see where it's happening.
🎯 WHY DARK POOL DATA MATTERS:
Institutions don't move large capital randomly. Dark pool block trades represent strategic positioning by sophisticated money managers with superior research and conviction. These trades create hidden support/resistance levels that often predict future price action.
The key principle: Follow institutional flow, don't fight it. When institutions get involved, they create high-probability trading opportunities.
💰 HOW INSTITUTIONS INFLUENCE PRICE:
- Large block trades establish hidden accumulation/distribution zones
- Smart money builds positions BEFORE retail awareness increases
- Institutional activity creates "footprints" at key technical levels
- These trades often signal conviction plays ahead of major moves
- Institutions typically add to winning positions throughout trends
🔍 WHAT THIS INDICATOR SHOWS:
- Visual overlay of dark pool block trades directly on price charts
- Track institutional positioning across major stocks and ETFs
- Identify accumulation/distribution zones before they become obvious to retail
- Spot high-conviction institutional trades in real-time visualization
- Customizable block trade size filters and timeframe selection
- Historical institutional activity up to 5 years or custom ranges
💡 THE TRADING ADVANTAGE:
Instead of guessing price direction, see where institutions are already positioning. When large block trades appear in dark pools, you're witnessing strategic institutional commitment that frequently leads to significant price movements.
⚡ HOW IT WORKS:
This Pine Script displays institutional dark pool transactions as visual markers on your charts. The script comes with sample data for immediate use. For expanded ticker coverage and real-time updates, external data services are available.
🎯 IDEAL FOR:
- Swing traders following institutional footprints
- Traders seeking setups backed by smart money conviction
- Position traders looking for accumulation zones
- Anyone wanting to align with institutional flow rather than fight it
🔄 SAMPLE DATA INCLUDED:
Pre-loaded with institutional activity data across popular tickers, updated daily to demonstrate how dark pool activity correlates with future price movements.
The script initially covers these tickers going back 6 months showing the top 10 trades by volume over 400,000 shares: AAPL, AMD, AMZN, ARKK, ARKW, BAC, BITO, COIN, COST, DIA, ETHA, GLD, GOOGL, HD, HYG, IBB, IWM, JNJ, JPM, LQD, MA, META, MSFT, NVDA, PG, QQQ, RIOT, SLV, SMCI, SMH, SOXX, SPY, TLT, TSLA, UNH, USO, V, VEA, VNQ, VOO, VTI, VWO, WMT, XLE, XLF, XLK, XLU, XLV, XLY

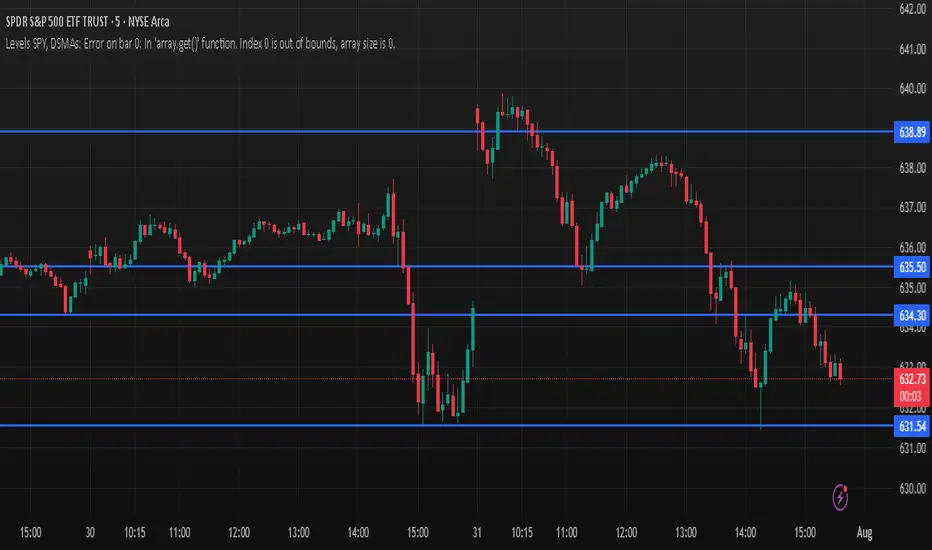
Cross-Symbol Price LevelsThis script enables you to map given price levels from a source symbol to the chart symbol. Originally intended for drawing Gamma Exposure levels from SPY onto ES and SPX.
Note that it uses the opening bar of the regular session to calculate the price conversion ratio.
(Developed with ChatGPT)

First Candle Low Break SignalTheory: If the SPY (or anything really) starts the day with a green candle, it never breaks below that candle on that day.
This indicator was quickly made to check that theory with some interesting results.
Requirement: The Symbol must be set to "extended trading hours", otherwise the script cannot see the changes between days.

IV PercentileIV Percentile Indicator - Brief Description
What It Does
The IV Percentile Indicator measures where current implied volatility ranks compared to the past year, showing what percentage of time volatility was lower than today's level.
How It Works
Data Collection:
Tracks implied volatility (or historical volatility as proxy) for each trading day
Stores the last 252 days (1 year) of volatility readings
Uses VIX data for SPY/SPX, historical volatility for other stocks
Calculation:
IV Percentile = (Days with IV below current level) ÷ (Total days) × 100
Example: If IV Percentile = 75%, it means current volatility is higher than 75% of the past year's readings.
Visual Output
Main Display:
Blue line showing percentile (0-100%)
Reference lines at key levels (20%, 30%, 50%, 70%, 80%)
Color-coded backgrounds for quick identification
Info table with current readings
Key Levels:
80%+ (Red): Very high IV → Sell premium
70-79% (Orange): High IV → Consider selling
30-20% (Green): Low IV → Consider buying
<20% (Bright Green): Very low IV → Buy premium
Trading Application
When IV Percentile is HIGH (70%+):
Options are expensive relative to recent history
Good time to sell premium (iron condors, credit spreads)
Expect volatility to decrease toward normal levels
When IV Percentile is LOW (30%-):
Options are cheap relative to recent history
Good time to buy premium (straddles, long options)
Expect volatility to increase from compressed levels
Core Logic
The indicator helps answer: "Is this a good time to buy or sell options based on how expensive/cheap they are compared to recent history?" It removes the guesswork from volatility timing by providing historical context for current option prices.

Reversal Signal avec TICK + RSIThis indicator is a potential reversal indicator for SCALPING, don't use it for swing. It's base on TICK and on an overbrought/oversold condition of the RSI. You can play with the setting, typicaly I like my TICK to be over reacting an 800/-800 and my rsi over 20 and 80, but it give not enough signal. So I set the TICK signal at 651/-651 and the RSI at 25/75. This indicator is made for SP500 and Nasdaq, so SPY/QQQ/SPX/ES/NQ should work well. It's the first version of it, so maybe I'll add so more data to it to increase signal and lower false one. For now I've test it on live market yet(26/7/25).
The RSI is Fast(5 period), I like to use it on the 1 or 5 min chart.
Please not that it only work during 9h30am to 4pm EST.(Because of the TICK)
Feel free to try and even comment. Don't be harsh on me, it's my first try!
(Sorry for my 'english' it's not my first language)
FAUCON
Cross-Correlation Lead/Lag AnalyzerCross-Correlation Lead/Lag Analyzer (XCorr)
Discover which instrument moves first with advanced cross-correlation analysis.
This indicator analyzes the lead/lag relationship between any two financial instruments using rolling cross-correlation at multiple time offsets. Perfect for pairs trading, market timing, and understanding inter-market relationships.
Key Features:
Universal compatibility - Works with any two symbols (stocks, futures, forex, crypto, commodities)
Multi-timeframe analysis - Automatically adjusts lag periods based on your chart timeframe
Real-time correlation table - Shows current correlation values for all lag scenarios
Visual lead/lag detection - Color-coded plots make it easy to spot which instrument leads
Smart "Best" indicator - Automatically identifies the strongest relationship
How to Use:
Set your symbols in the indicator settings (default: NQ1! vs RTY1!)
Adjust correlation length (default: 20 periods for smooth but responsive analysis)
Watch the colored lines:
• Red/Orange: Symbol 2 leads Symbol 1 by 1-2 periods
• Blue: Instruments move simultaneously
• Green/Purple: Symbol 1 leads Symbol 2 by 1-2 periods
Check the table for exact correlation values and the "Best" relationship
Interpreting Results:
Correlation > 0.7: Strong positive relationship
Correlation 0.3-0.7: Moderate relationship
Correlation < 0.3: Weak/no relationship
Highest line indicates the optimal timing relationship
Popular Use Cases:
Index Futures : NQ vs ES, RTY vs IWM
Sector Rotation : XLF vs XLK, QQQ vs SPY
Commodities : GC vs SI, CL vs NG
Currency Pairs : EURUSD vs GBPUSD
Crypto : BTC vs ETH correlation analysis
Technical Notes:
Cross-correlation measures linear relationships between two time series at different time lags. This implementation uses Pearson correlation with adjustable periods, calculating correlations from -2 to +2 period offsets to detect leading/lagging behavior.
Perfect for quantitative analysts, pairs traders, and anyone studying inter-market relationships.

🌊 Reinhart-Rogoff Financial Instability Index (RR-FII)Overview
The Reinhart-Rogoff Financial Instability Index (RR-FII) is a multi-factor indicator that consolidates historical crisis patterns into a single risk score ranging from 0 to 100. Drawing from the extensive research in "This Time is Different: Eight Centuries of Financial Crises" by Carmen M. Reinhart and Kenneth S. Rogoff, the RR-FII translates nearly a millennium of crisis data into practical insights for financial markets.
What It Does
The RR-FII acts like a real-time financial weather forecast by tracking four key stress indicators that historically signal the build-up to major financial crises. Unlike traditional indicators based only on price, it takes a broader view, examining the global market's interconnected conditions to provide a holistic assessment of systemic risk.
The Four Crisis Components
- Capital Flow Stress (Default weight: 25%)
- Data analyzed: Volatility (ATR) and price movements of the selected asset.
- Detects abrupt volatility surges or sharp price falls, which often precede debt defaults due to sudden stops in capital inflow.
- Commodity Cycle (Default weight: 20%)
- Data analyzed: US crude oil prices (customizable).
- Watches for significant declines from recent highs, since commodity price troughs often signal looming crises in emerging markets.
- Currency Crisis (Default weight: 30%)
- Data analyzed: US Dollar Index (DXY, customizable).
- Flags if the currency depreciates by more than 15% in a year, aligning with historical criteria for currency crashes linked to defaults.
- Banking Sector Health (Default weight: 25%)
- Data analyzed: Performance of financial sector ETFs (e.g., XLF) relative to broad market benchmarks (SPY).
- Monitors for underperformance in the financial sector, a strong indicator of broader financial instability.
Risk Scale Interpretation
- 0-20: Safe – Low systemic risk, normal conditions.
- 20-40: Moderate – Some signs of stress, increased caution advised.
- 40-60: Elevated – Multiple risk factors, consider adjusting positions.
- 60-80: High – Significant probability of crisis, implement strong risk controls.
- 80-100: Critical – Several crisis indicators active, exercise maximum caution.
Visual Features
- The main risk line changes color with increasing risk.
- Background colors show different risk zones for quick reference.
- Option to view individual component scores.
- A real-time status table summarizes all component readings.
- Crisis event markers appear when thresholds are breached.
- Customizable alerts notify users of changing risk levels.
How to Use
- Apply as an overlay for broad risk management at the portfolio level.
- Adjust position sizes inversely to the crisis index score.
- Use high index readings as a warning to increase vigilance or reduce exposure.
- Set up alerts for changes in risk levels.
- Analyze using various timeframes; daily and weekly charts yield the best macro insights.
Customizable Settings
- Change the weighting of each crisis factor.
- Switch commodity, currency, banking sector, and benchmark symbols for customized views or regional focus.
- Adjust thresholds and visual settings to match individual risk preferences.
Academic Foundation
Rooted in rigorous analysis of 66 countries and 800 years of data, the RR-FII uses empirically validated relationships and thresholds to assess systemic risk. The indicator embodies key findings: financial crises often follow established patterns, different types of crises frequently coincide, and clear quantitative signals often precede major events.
Best Practices
- Use RR-FII as part of a comprehensive risk management strategy, not as a standalone trading signal.
- Combine with fundamental analysis for complete market insight.
- Monitor for differences between component readings and the overall index.
- Favor higher timeframes for a broader macro view.
- Adjust component importance to suit specific market interests.
Important Disclaimers
- RR-FII assesses risk using patterns from past crises but does not predict future events.
- Historical performance is not a guarantee of future results.
- Always employ proper risk management.
- Consider this tool as one element in a broader analytical toolkit.
- Even with high risk readings, markets may not react immediately.
Technical Requirements
- Compatible with Pine Script v6, suitable for all timeframes and symbols.
- Pulls data automatically for USOIL, DXY, XLF, and SPY.
- Operates without repainting, using only confirmed data.
The RR-FII condenses centuries of financial crisis knowledge into a modern risk management tool, equipping investors and traders with a deeper understanding of when systemic risks are most pronounced.

All SMAs Bullish/Bearish Screener (Enhanced)All SMAs Bullish/Bearish Screener Enhanced: Uncover High-Conviction Trend Alignments with Confidence
Description:
Are you ready to elevate your trading from mere guesswork to precise, data-driven decisions? The "All SMAs Bullish/Bearish Screener Enhanced" is not just another indicator; it's a sophisticated, yet user-friendly, trend-following powerhouse designed to cut through market noise and pinpoint high-probability trading opportunities. Built on the foundational strength of comprehensive Moving Average confluence and fortified with critical confirmation signals from Momentum, Volume, and Relative Strength, this script empowers you to identify truly robust trends and manage your trades with unparalleled clarity.
The Power of Multi-Factor Confluence: Beyond Simple Averages
In the unpredictable world of financial markets, true strength or weakness is rarely an isolated event. It's the harmonious alignment of multiple technical factors that signals a high-conviction move. While our original "All SMAs Bullish/Bearish Screener" intelligently identified stocks where price was consistently above or below a full spectrum of Simple Moving Averages (5, 10, 20, 50, 100, 200), this Enhanced version takes it a crucial step further.
We've integrated a powerful three-pronged confirmation system to filter out weaker signals and highlight only the most compelling setups:
Momentum (Rate of Change - ROC): A strong trend isn't just about price direction; it's about the speed and intensity of that movement. Positive momentum confirms that buyers are still aggressively pushing price higher (for bullish signals), while negative momentum validates selling pressure (for bearish signals).
Volume: No trend is truly trustworthy without the backing of smart money. Above-average volume accompanying an "All SMAs" alignment signifies strong institutional participation and conviction behind the move. It separates genuine trend starts from speculative whims.
Relative Strength Index (RSI): This versatile oscillator ensures the trend isn't just "there," but that it's developing healthily. We use RSI to confirm a bullish bias (above 50) or a bearish bias (below 50), adding another layer of confidence to the direction.
When the price aligns above ALL six critical SMAs, and is simultaneously confirmed by robust positive momentum, healthy volume, and a bullish RSI bias, you have an exceptionally strong "STRONGLY BULLISH" signal. This confluence often precedes sustained upward moves, signaling prime accumulation phases. Conversely, a "STRONGLY BEARISH" signal, where price is below ALL SMAs with negative momentum, confirming volume, and a bearish RSI bias, indicates powerful distribution and potential for significant downside.
How to Use This Enhanced Screener:
Add to Chart: Go to TradingView's Pine Editor, paste the script, and click "Add to Chart."
Customize Parameters: Fine-tune the lengths of your SMAs, RSI, Momentum, and Volume averages via the indicator's settings. Experiment to find what best suits your trading style and the assets you trade.
Choose Your Timeframe Wisely:
Daily (1D) and 4-Hour (240 min) are highly recommended. These timeframes cut through intraday noise and provide more reliable, actionable signals for swing and position trading.
Shorter timeframes (e.g., 15min, 60min) can be used by advanced day traders for very short-term entries, but be aware of increased volatility and noise.
Visual Confirmation:
Green/Red Triangles: Appear on your chart, indicating confirmed bullish or bearish signals.
Background Color: The chart background will subtly turn lime green for "STRONGLY BULLISH" and red for "STRONGLY BEARISH" conditions.
On-Chart Status Table: A clear table displays the current signal status ("STRONGLY BULLISH/BEARISH," or "SMAs Mixed") for immediate feedback.
Set Up Alerts (Your Primary Screener Tool): This is the game-changer! Create custom alerts on TradingView based on the "Confirmed Bullish Trade" and "Confirmed Bearish Trade" conditions. Receive instant notifications (email, pop-up, mobile) for any stock in your watchlist that meets these stringent criteria. This allows you to scan the entire market effortlessly and act decisively.
Strategic Stop-Loss Placement: The Trader's Lifeline
Even the most robust signals can fail. Protecting your capital is paramount. For this trend-following strategy, your stop-loss should be placed where the underlying trend structure is broken.
For a "STRONGLY BULLISH" Trade: Place your stop-loss just below the most recent significant swing low (higher low). This is the last point where buyers stepped in to support the price. If price breaks below this, your bullish thesis is invalidated.
For a "STRONGLY BEARISH" Trade: Place your stop-loss just above the most recent significant swing high (lower high). If price breaks above this, your bearish thesis is invalidated.
Alternatively, consider placing your stop-loss just below the 20-period SMA (for bullish trades) or above the 20-period SMA (for bearish trades). A significant close beyond this intermediate-term average often indicates a critical shift in momentum. Always ensure your chosen stop-loss adheres to your pre-defined risk per trade (e.g., 1-2% of capital).
Disciplined Profit Booking: Maximizing Gains
Just as important as knowing when you're wrong is knowing when to take profits.
Trailing Stop-Loss: As your trade moves into profit, trail your stop-loss upwards (for longs) or downwards (for shorts). You can trail it using:
Previous Swing Lows/Highs: Move your stop to just below each new higher low (for longs) or just above each new lower high (for shorts).
A Moving Average (e.g., 10-period or 20-period SMA): If price closes below your chosen trailing SMA, exit. This allows you to ride the trend while protecting accumulated profits.
Target Levels: Identify potential resistance levels (for longs) or support levels (for shorts) using pivot points, previous highs/lows, or Fibonacci extensions. Consider taking partial profits at these levels and letting the rest run with a trailing stop.
Loss of Confluence: If the "STRONGLY BULLISH/BEARISH" condition ceases to be met (e.g., RSI crosses below 50, or volume drops significantly), this can be a signal to reduce or exit your position, even if your stop-loss hasn't been hit.
The "All SMAs Bullish/Bearish Screener Enhanced" is your comprehensive partner in navigating the markets. By combining robust trend identification with critical confirmation signals and disciplined risk management, you're equipped to make smarter, more confident trading decisions. Add it to your favorites and unlock a new level of precision in your trading journey!
#PineScript #TradingView #SMA #MovingAverage #TrendFollowing #StockScreener #TechnicalAnalysis #Bullish #Bearish #QQQ #Momentum #Volume #RSI #SPY #TradingStrategy #Enhanced #Signals #Analysis #DayTrading #SwingTrading
