TICK strategy for SPY optionsImportant notes:
1. This strategy is designed for same day SPY option scalping. All profit shown in back testing report is based on Profit/Loss (P/L) estimates from trading options with approximately 6 months of data. By default, it is set to 10 option contracts. By default the initial capital is set to $5000. Pyramiding is set to 3.
2. This strategy works better with non-extended market data.
3. This strategy is mainly developed for SPY trading on 5 min chart, it probably will not be very profitable with other tickers or time frame without tweaking all the parameters first.
4. This strategy will work with QQQ as well, but please adjust the profit multiplier to match the P/L of QQQ options.
How it works:
When trading the indices, many rely on the TICK for market directions. This strategy is a trend following strategy that uses a combination of conditions using the following indicators:
- TICK
- RSI
- VIX volatility index
- EMA
For entries, the conditions are:
1. TICK moving average crossover with a delayed signal line
2. Bullish or bearish RSI signal, RSI > 50 for bullish, < 50 for bearish
3. VIX must be above a certain threshold to take advantage of high market volatility
4. Price must be on top of EMA line for long, and below for short
For exits, there are 3 scenarios:
1. Stop loss set by a percentage of the daily ATR value
2. Trend changes on the TICK and the RSI
3. Bearish or bullish divergence on price with TICK
This strategy automatically signal to close all trades at 3:50 pm EST at the end of the day.
Extras:
- There is an option to show P/L for reinvesting profits
Enjoy~!!! Let's all make $$$
Cari dalam skrip untuk "spy"

SPY Ninja Oscillator
SPY Ninja Oscillator correlates the true strength index exponential moving averages of SPY (green) and VIX (red) together. In doing so we can determine the start of trend shifts via SPY / VIX convergence in addition to crossover, with potential market entries and exits represented by the vertical green and red bars.
MACD and RSI have been scaled proportionally to the oscillator range ( for rsi: (rsi-50)*. 01 , and for macd: macd /3) and when overlaid and used in conjunction with the market vertical entry and exit signals, potential trend prediction becomes much more apparent.

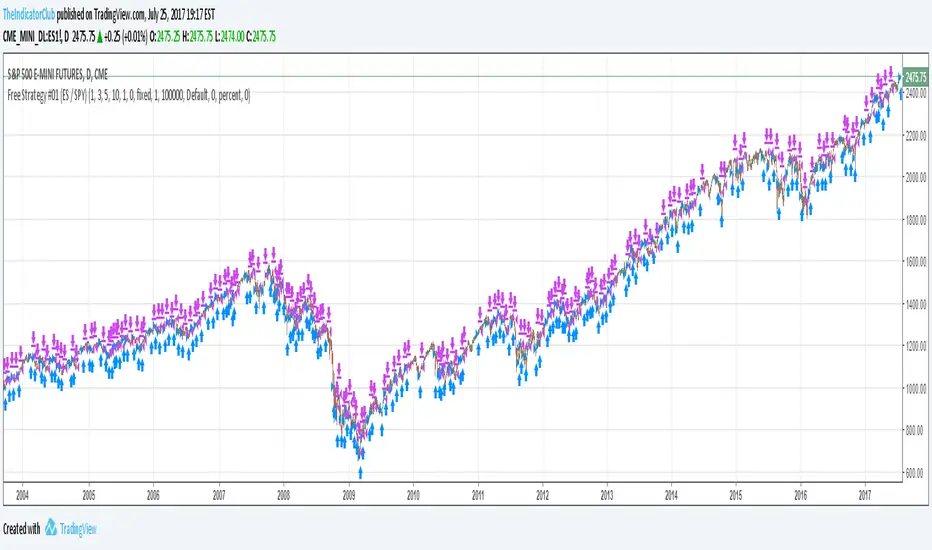
Free Strategy #02 (ES / SPY)This strategy was designed to be traded on daily data on the ES and SPY—the strategy was originally developed for NinjaTrader, which displays daily ES data based on RTH hours instead of 24 hours (1440 minute) like TradingView does, so we are presenting the results on the SPY until we figure out how to overcome this hurdle.
Strategy #02
Quantity 100
Slippage: 2 ticks
Commission: 4.95 per order
Net Profit: 10,118.30
Max Drawdown: 4.037.60
Buy and Hold (Custom)
Quantity 100
Slippage: 2 ticks
Commission: 4.95 per order
Entry Long: 1993-02-01 @ 43.99
Exit Long: 2017-07-28 @ 246.34
Net Profit: 20,225.10
Max Drawdown: 9,042.00

IBS (Internal Bar Strength) Trading Strategy for SPY and NDQImplementation by AlgoTradeKit
Overview
The IBS Trading Strategy is a daily bars long-only trading system, based on the concept of Internal Bar Strength (IBS). The strategy aims to identify potential reversals by monitoring how the previous bar’s close positions itself within its high-low range. It is suitable for stock and US indices. The default parameters are optimized for SPY/SPX and NDQ/QQQ
Strategy Concept
The Internal Bar Strength (IBS) is calculated using the formula:
IBS = (Previous Close - Previous Low) / (Previous High - Previous Low)
This value always lies between 0 and 1. An IBS value below 0.2 is typically interpreted as an oversold condition, while a value above 0.9 suggests an overbought state.
Trading Rules
- Long Entry :
- Condition 1 : IBS is below the user-defined entry threshold (default is 0.2).
- Condition 2 : The current price is above an N-period Exponential Moving Average (EMA) (default period is 252).
- Note : You can disable the EMA condition by setting the EMA period to 0.
- Long Exit
- The position is closed when IBS rises above the user-defined exit threshold (default is 0.9).
Customization Options
- IBS Entry Threshold : Adjust to set the sensitivity for entering a long trade based on oversold conditions.
- IBS Exit Threshold : Customize to define the exit point when the market becomes overbought.
- EMA Period : Set the lookback period for the EMA to align with your trend bias; disable this condition by setting the period to 0.
Risk Management & Trading Considerations
- Designed for daily charts, the strategy captures higher timeframe trends and minimizes noise.
- The entry and exit conditions are straightforward, aiming to avoid over-trading while letting clear signals dictate trade management.
- Always use proper risk management techniques and test the strategy thoroughly on historical data and in a simulated environment before applying it in live markets.
Disclaimer
This strategy is for educational and informational purposes only and does not constitute financial advice. Trading involves risk, and past performance is not indicative of future results. Always conduct your own research and consider your risk tolerance before making any trades.

ORB Heikin Ashi SPY 5min Correlation StrategyOverview:
The ORB (Opening Range Breakout) strategy combined with Heikin Ashi candles and Relative Volume (RVOL) indicator aims to capitalize on significant price movements that occur shortly after the market opens. This strategy identifies breakouts above or below the opening range, using Heikin Ashi candles for smoother price visualization and RVOL to gauge the strength of the breakout.
Components:
Opening Range Breakout (ORB): The strategy starts by defining the opening range, typically the first few minutes of the trading session. It then identifies breakouts above the high or below the low of this range as potential entry points.
Heikin Ashi Candles: Heikin Ashi candles are used to provide a smoother representation of price movements compared to traditional candlesticks. By averaging open, close, high, and low prices of the previous candle, Heikin Ashi candles reduce noise and highlight trends more effectively.
Relative Volume (RVOL): RVOL compares the current volume of a stock to its average volume over a specified period. It helps traders identify abnormal trading activity, which can signal potential price movements.
Candle for correlation : In this case we are using SPY candles. It can also use different asset
Strategy Execution:
Initialization: The strategy initializes by setting up variables and parameters, including the ORB period, session timings, and Heikin Ashi candle settings.
ORB Calculation: It calculates the opening range by identifying the high and low prices during the specified session time. These values serve as the initial reference points for potential breakouts. For this we are looking for the first 30 min of the US opening session.
After that we are going to use the next 2 hours to check for breakout opportunities.
Heikin Ashi Transformation: Optionally, the strategy transforms traditional candlestick data into Heikin Ashi format for smoother visualization and trend identification.
Breakout Identification: It continuously monitors price movements within the session and checks if the current high breaches the ORB high or if the current low breaches the ORB low. These events trigger potential long or short entry signals, respectively.
RVOL Analysis: Simultaneously, the strategy evaluates the relative volume of the asset to gauge the strength of the breakout. A surge in volume accompanying the breakout confirms the validity of the signal. In this case we are looking for at least a 1 value of the division between currentVolume and pastVolume
Entry and Exit Conditions: When a breakout occurs and is confirmed by RVOL and is within our session time, the strategy enters a long or short position accordingly. It does not have a stop loss or a takie profit level, instead it will always exit at the end of the trading session, 5 minutes before
Position Sizing and Commissions: For the purpose of this backtest, the strategy allocated 10% of the capital for each trade and assumes a trading commission of 0.01$ per share ( twice the IBKR broker values)
Session End: At the end of the trading session, the strategy closes all open positions to avoid overnight exposure.
Conclusion:
The combination of ORB breakout strategy, Heikin Ashi candles, and RVOL provides traders with a robust framework for identifying and capitalizing on early trends in the market. By leveraging these technical indicators together, traders can make more informed decisions and improve the overall performance of their trading strategies. However, like any trading strategy, it's essential to backtest thoroughly and adapt the strategy to different market conditions to ensure its effectiveness over time.

Stock Gaps SPY Correlation StrategyThis is daytrade stock strategy, designed to take the best out of the daily gaps that are forming between the close of previous day and opening of present day.
At the same time its logic has been adapted for SPY chart, in order to use correlation with the other stocks/assets/ etf which are linked with SP500 movement.
Lastly it has been added 2 new confirmation logics, based on the USI: advance/decline chart and percentage above vwap among all US stocks.
The rules for entry are simple :
We are at the opening daily candle, we have a long/short gap based on where the opening is happening and at the same time we are checking to see that the current different between the current difference between low and previous high (or viceversa) is higher than an established parameter(minimal deviation )
For exit, we exit based on time/clock parameter, in this case by default I selected 1h and half before close of the US session.
For testing purposes I have used 10% of the available capital, with a 0.0035$ comission per each share bought ( IBKR comissions)
If there are any questions, please let me know either here or in private !

Free Strategy #01 (ES / SPY)The strategy was designed to be traded based on daily data on the ES and SPY--the strategy was originally developed on NinjaTrader using approximately 50% out of sample data with a slippage of 1 tick on the ES. This is our first strategy that we converted from NinjaTrader to TradingView, so if you see any issues with our conversion, please let us know as we are still learning TradingView Pine Script.
SPY Options Targets -IV Expected MoveWhat this indicator is?
This tool turns option implied volatility into two things:
1) Expected move levels on the SPY chart for a chosen time horizon
2) Estimated option premium targets if SPY reaches those levels
It is built to answer three trading questions:
1) How far can SPY reasonably move in my holding window
2) What SPY levels should I use for profit targets or invalidation
3) If SPY hits those levels, what option price is a realistic target
What the bands mean on the SPY chart
The bands are expected move levels on the underlying, recalculated each bar from the selected option’s implied volatility.
One sigma band
The teal band is the expected one standard deviation move over the next Horizon minutes. In practice, this is a normal move zone for that holding window.
Two sigma band
The orange band is the expected two standard deviation move over the next Horizon minutes. In practice, this is a large move zone for that holding window.
How to interpret value
If price is near the middle of the bands, the market is behaving normally for that window.
If price approaches the one sigma band, the move is extended for that window.
If price approaches the two sigma band, the move is unusually large for that window and you should expect either strong continuation or sharp mean reversion depending on market context.
What the table means and how to use it
IV
Implied volatility solved from the selected option price. Higher IV widens the bands and increases option targets.
DTE
Days to expiry of the selected option. Near expiry options can change faster and IV can shift quickly.
H move 1 sigma
The projected one sigma SPY move in dollars for the selected Horizon minutes. This is the key number for planning.
Opt at plus 1 sigma and minus 1 sigma
If SPY reaches the one sigma upper band or the one sigma lower band, the indicator estimates what your selected option should be worth at that moment, assuming implied volatility does not change.
Opt at plus 2 sigma and minus 2 sigma
Same idea for the two sigma bands.
Now opt px
Current option price for reference.
.................................................................................................................
How to trade using it?
Step 1 Pick the right option input
Choose the same expiry you plan to trade and pick a liquid contract, ideally at the money or near the money. This makes the IV reading more representative of the current tape.
Step 2 Set the horizon to your holding time
If you typically hold 15 to 30 minutes, set Horizon minutes to 15 or 30.
If you typically hold 60 to 120 minutes, set it accordingly.
This matters because the bands represent expected move for that exact window.
Step 3 Use the bands to define trade planning
For a long bias
Entry is your setup. The bands are used for targets and risk.
Target 1 is the one sigma upper band.
Target 2 is the two sigma upper band if momentum supports continuation.
Invalidation can be defined as losing the mid zone and failing to reclaim, or a clear level based stop. The indicator does not choose your stop. It gives your realistic upside distance.
For a short bias
Target 1 is the one sigma lower band.
Target 2 is the two sigma lower band if momentum supports continuation.
Invalidation can be defined similarly using your structure.
Step 4 Use the option targets as profit taking levels
Once you enter an option trade, ignore random premium swings and anchor to the table.
Common approach
Take partial profit when the option approaches the plus or minus one sigma target value.
Hold a smaller runner for the plus or minus two sigma target value.
If SPY hits the one sigma band but the option is far below the table target, it usually means implied volatility is dropping. Reduce expectations or exit earlier.
If SPY hits the one sigma band and the option is above the table target, it usually means implied volatility expanded. Consider taking profits sooner because this extra premium can mean revert.
Step 5 Use it to choose strikes
Before entering, check whether your desired option profit requires SPY to travel to the two sigma band within your horizon.
If yes, that is a lower probability trade for that window.
If your plan is achievable around the one sigma band, it is typically more realistic.
..................................................................................................................
Practical examples
Scalp example
Horizon 30 minutes.
If H move 1 sigma is about 1 dollar, then expecting a 3 dollar SPY move in 30 minutes is a two to three sigma expectation and should be treated as a low probability scalp unless a news event is active.
Intraday example
Horizon 120 minutes.
If H move 1 sigma is about 2 dollars, a 2 dollar move is a reasonable target and a 4 dollar move is the stretch target.
Important limitations
Implied volatility changes
The option target prices assume IV stays constant. In real markets IV can change during the move, especially on 0DTE, around news, or during sharp selloffs. Treat option targets as a baseline estimate.
Not a standalone signal
This indicator does not generate buy or sell signals. Combine it with your entry model, structure, or momentum confirmation.
Liquidity matters
Very wide bid ask spreads can distort the inferred IV. Use liquid contracts.
Suggested defaults for SPY
Use a liquid near the money option for the current expiry.
Horizon 30 for scalps, 60 for intraday, 120 for swings.
Keep expiry time at 16:00 New York.
Disclaimer
This script is for educational and informational purposes only and is not financial advice. Options involve risk and may not be suitable for all traders.

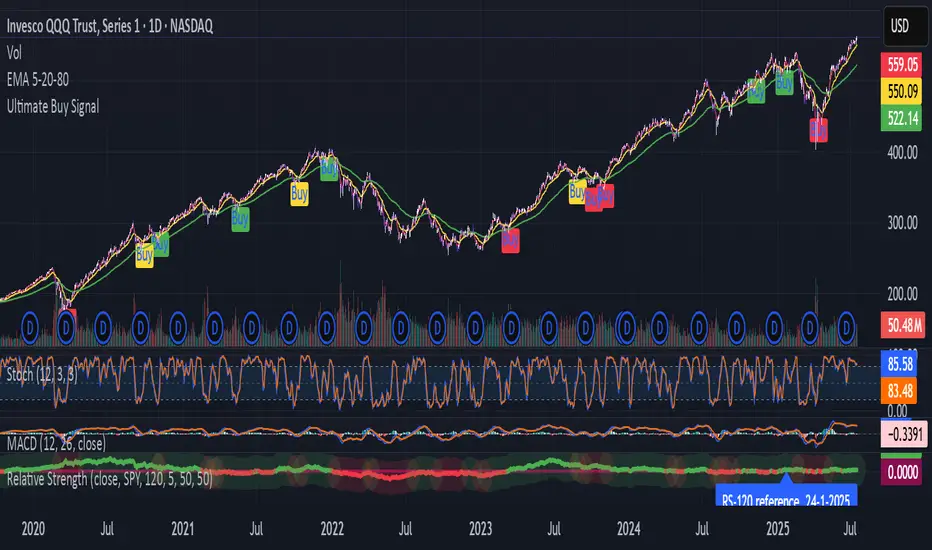
SPY Trend-Based Buy Signals🔹 Overview
This indicator identifies potential buy signals on any asset by combining MACD and Stochastic Oscillator crossovers, while using the SPY’s trend (via exponential moving averages) as a broader market filter.
It helps traders stay aligned with macro momentum and avoid counter-trend entries.
🔍 How it works
SPY Trend Filter (Daily Timeframe):
Pulls SPY (S&P 500 ETF) data using EMAs (5, 20, 80)
Categorizes SPY market trend with color codes:
🟢 Green: Strong uptrend (EMA5 > EMA20 > EMA80)
🟡 Yellow: Potential uptrend / early momentum (EMA5 < EMA20 > EMA80)
🔴 Red: Downtrend (EMA5 < EMA20 < EMA80)
🔵 Blue: Possible trend reversal or mixed trend (EMA5 > EMA20 < EMA80)
Buy Signal Conditions (Combined Logic):
A signal is only triggered when:
- SPY trend is either yellow or blue (indicating a neutral-to-bullish or early recovery environment)
-The Stochastic Oscillator's %D line is below 50, showing possible upside
- A bullish MACD crossover occurs on the current symbol
🟢 Green signal: MACD crossover occurs below 0 (early reversal)
🟠 Orange signal: MACD crossover occurs above 0 (momentum continuation)
📈 Visual Output
🟢 Green label below the bar when an early reversal setup occurs
🟠 Orange label above the bar when a trend continuation signal appears
✅ Best Use Case
Ideal for:
Swing traders and position traders
LEAPS (long-term options) traders aligning entries with SPY trend
Anyone seeking clean, contextual entries filtered by market momentum
⚠️ Note: This indicator is most effective when used on fundamentally strong stocks that are sector leaders with solid earnings growth and market presence. Use technical signals as a complement to quality fundamentals.
ℹ️ Clarification: The moving averages displayed on the chart (e.g., on QQQ) are for visual reference only, to help users understand the color logic of the SPY trend filter. The actual logic and signals are based on SPY’s moving averages, regardless of the charted symbol.
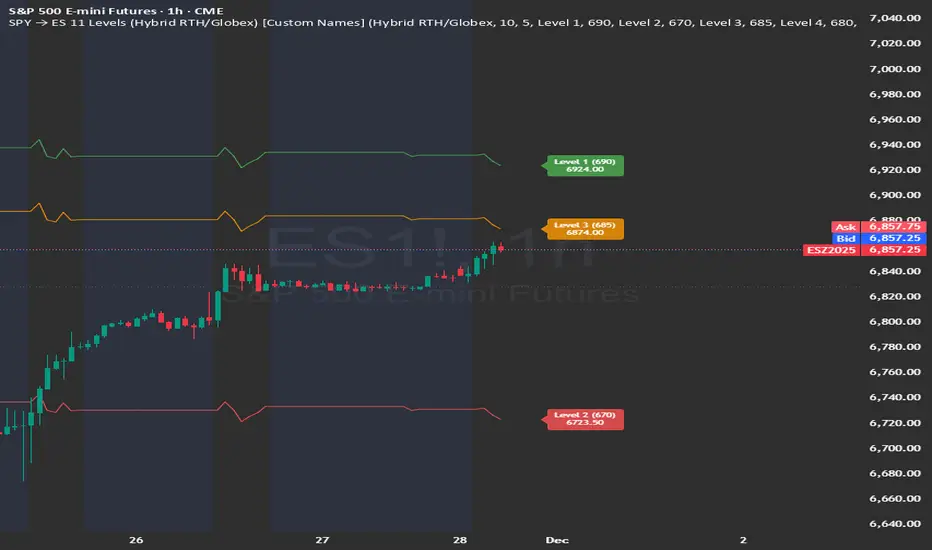
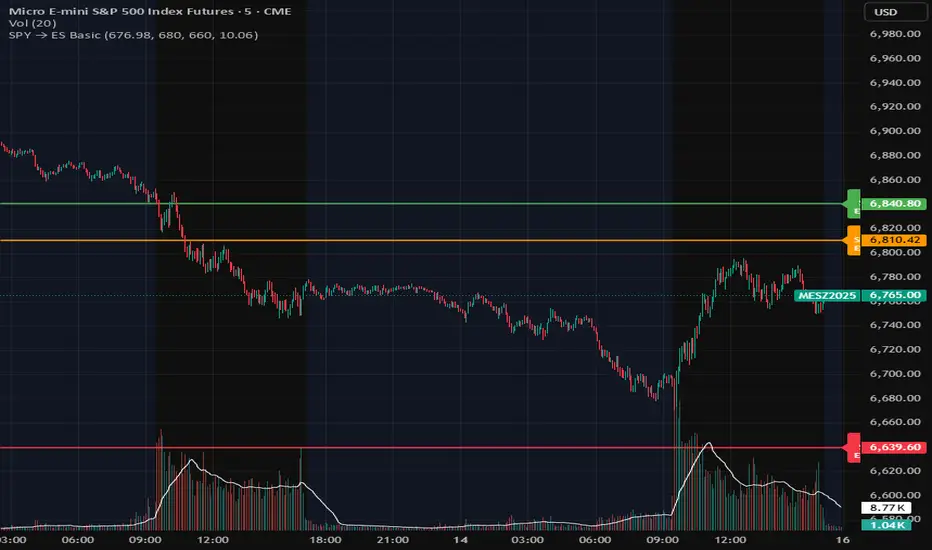
SPY → ES 11 Levels (Hybrid RTH/Globex) [Tick Fixed]📌 Description for SPY → ES 11-Level Converter (with Labels)
This script converts important SPY options-based levels into their equivalent ES futures prices and plots them directly on the ES chart.
Because SPY trades at a different price scale than ES, each SPY level is multiplied by a customizable ES/SPY ratio to project accurate ES levels.
It is designed for traders who use SpotGamma, GEXBot, MenthorQ, Vol-trigger levels, or their own gamma/oi/volume models.
🔍 Features
✅ Converts SPY → ES using custom or automatic ratio
Option to manually enter a ratio (recommended for accuracy)
Or automatically compute ES/SPY from live prices
✅ Plots 11 major levels on the ES chart
Each level can be individually turned ON/OFF:
Call Wall
Put Wall
Volume Trigger
Spot Price
+Gamma Level
–Gamma Level
Zero Gamma
Positive OI
Negative OI
Positive Volume
Negative Volume
All levels are drawn as clean horizontal lines using the converted ES value.
SPY → ES 11 Levels with Labels📌 Description for SPY → ES 11-Level Converter (with Labels)
This script converts important SPY options-based levels into their equivalent ES futures prices and plots them directly on the ES chart.
Because SPY trades at a different price scale than ES, each SPY level is multiplied by a customizable ES/SPY ratio to project accurate ES levels.
It is designed for traders who use SpotGamma, GEXBot, MenthorQ, Vol-trigger levels, or their own gamma/oi/volume models.
🔍 Features
✅ Converts SPY → ES using custom or automatic ratio
Option to manually enter a ratio (recommended for accuracy)
Or automatically compute ES/SPY from live prices
✅ Plots 11 major levels on the ES chart
Each level can be individually turned ON/OFF:
Call Wall
Put Wall
Volume Trigger
Spot Price
+Gamma Level
–Gamma Level
Zero Gamma
Positive OI
Negative OI
Positive Volume
Negative Volume
All levels are drawn as clean horizontal lines using the converted ES value.

SPY vs VIX SMA Slope Alignment (Adjustable Days)Use this on VIX Chart only.
This indicator compares the SLOPE of the daily SMA of SPY, to the SLOPE of the Daily SMA to VIX
When SPY and VIX are trending UP for the length of time that you define, you will get a GREEN ARROW on the VIX chart showing that the condition has been met.
EXAMPLE:
Set 3 day SMA for VIX and SPY
THEN
Set Look back time to 2 days
---IF SPY 3day SMA AND VIX 3day SMA are both ASCENDING during any 3 day lookback period, a green indicator arrow will be showing on the VIX Chart
DO NOT Use this indicator on SPY Chart
(SPY and VIX have different daily open/close times. This indicator DOES NOT work propertly on SPY Chart. But it DOES work properly on VIX chart. )

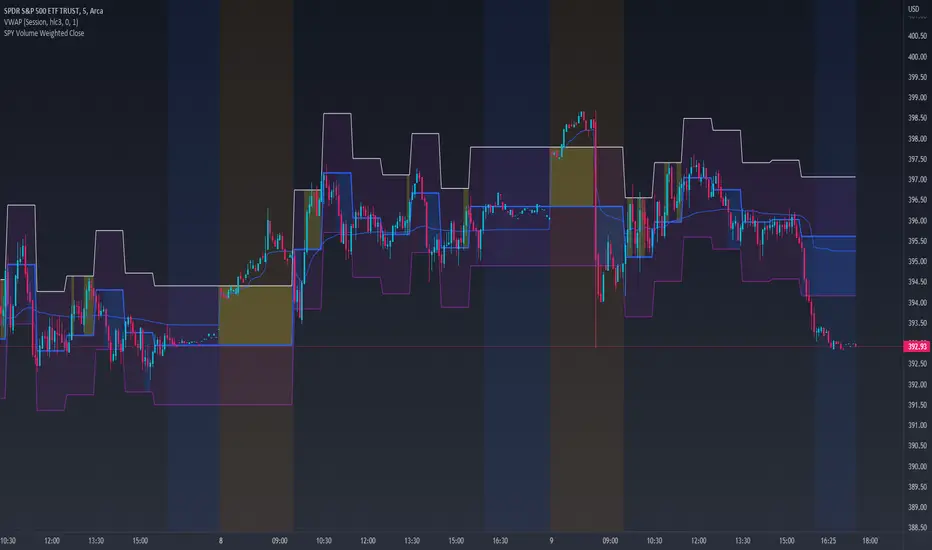
SPY Volume Weighted CloseHey everyone!
Deciding to make this indicator public and open access.
This is a volume weighted close indicator for SPY. It is a statistics based indicator.
How it works:
It uses volume data mixed with some price action data to prospectively predict where SPY's price will close within a 30 minute interval.
As such, its different from other indicators in the sense that its not reactive, it proactive and actively predicts the price that SPY will see within the next 30 minutes and where SPY will most likely close at.
It has 3 bands. The main centre band (blue, but colour can be changed) is the most likely price that SPY will close at within the next 30 minutes.
The Upper Level Confidence and Lower Level Confidence bands are the expected range that the analysis thinks SPY will remain confined in based on current volume and price action.
How to Use it:
I personally use this in place of VWAP, but the applications are infinite. Take a look at the chart below:
Applications:
This is specifically programmed for SPY but I have used it with other stocks such as QQQ, UPRO and DIA. However, using it with those stocks, the upper and lower confidence bands are not helpful. But YMMV with other stocks. This is specifically designed for SPY.
Let me know your questions and thoughts!
Thanks for reading and checking this out!
(SPY to ES) ETF→Futures Multi-Level (10 Levels + Select All)Converts selected ETF levels (SPY or QQQ) into equivalent futures levels (ES or NQ).
Uses live price ratio between ETF and futures for real-time level translation.
Supports 10 independent levels (A–J) with user-defined ETF price inputs.
Provides checkboxes to toggle each level’s visibility or show all at once.
Applies smoothing (ta.sma) to reduce noise from short-term price movement.
Lets user customize each line’s color, width, and style (solid, dashed, dotted).
Automatically updates lines as new bars form without user interaction.
Uses persistent line objects to keep levels stable when scrolling or zooming.
Adapts to either SPY→ES or QQQ→NQ depending on the “Convert SPY?” toggle.
Draws clean horizontal lines without legend clutter for visual precision.
SOME ONE PUBLISHED THIS FUNCTIONALITY FOR A CHARGE SO I MADE IT FREE.
-rA

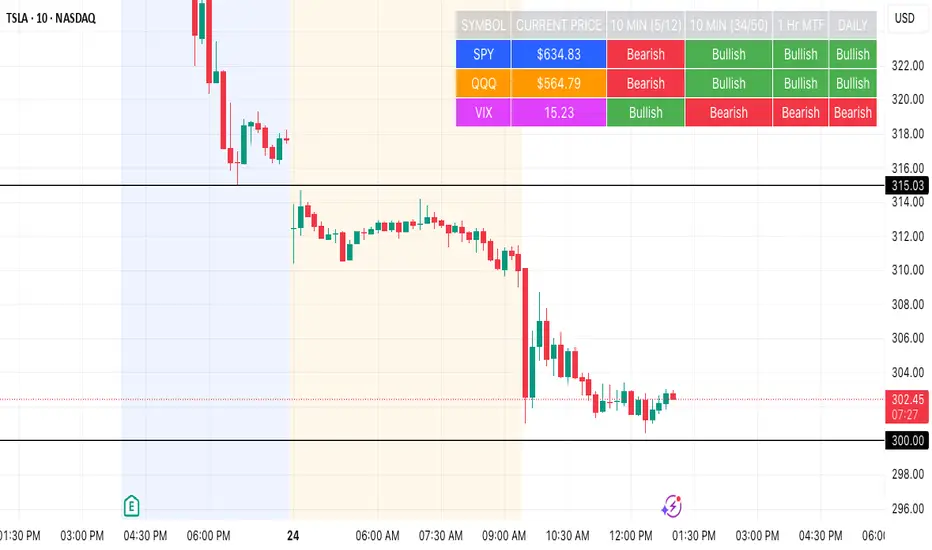
SPY, QQQ, VIX Status TableBased on Ripster EMA and 1 hour MTF Clouds, this custom TradingView indicator displays a visual trend status table for SPY, QQQ, and VIX using multiple timeframes and EMA-based logic to be used on any stock ticker.
🔍 Key Features:
✅ Tracks 3 symbols: SPY, QQQ, and VIX
✅ Multiple trend conditions:
10-min (5/12 EMA) Ripster cloud trend
10-min (34/50 EMA) Ripster cloud trend
1-Hour Multi-Timeframe Ripster EMA trend
Daily open/close trend
✅ Color-coded trend strength:
🟩 Green = Bullish
🟥 Red = Bearish
🟨 Yellow = Sideways
✅ TO save screen space, customizations available:
Show/hide individual rows (SPY, QQQ, VIX)
Show/hide any trend column (10m, 1H MTF, Daily)
Change header/background colors and font color
Bold white top row for readability
✅ Auto-updating table appears on your chart, top-right
This tool is great for active traders looking to quickly scan short-term and longer-term momentum in key market instruments without having to go back and forth market charts.
SPY VXX RSI crisscross// Shows mean of SPY and VXX RSI's. While SPY and VXX often play "tag",
//crisscrossing each other, the game of tag is either 'down' or 'up'
LIME= SPY RSI
AQUA=VXX RSI
BLUE= Average of both
Gray= change of blue
The indicator: is the average above or below 50 (are we going up or down).
Reminder - its an RSI 0-100
// Useful in taking hedged positions in Volatility
//Ex. Short VXX and Long SDS
//Ex. Short XIV and Long SSO

SPY Key LevelsUse Case
Do you belong to a group of traders that post key levels based on their technical analysis to be utilized for trading opportunities? The goal of this indicator is to reduce your daily prep time by allowing you to paste in the actual level values instead of trying to manually create each of the horizontal lines.
How it works
Simply enter the values of the key levels that you would like to plot horizontal lines for
Settings
You can enable/disable any of the levels
You can change the colors of the levels
You can add Previous Day High and Previous Day Low levels to the chart
Limitations
Currently the levels (besides PDH/PDL) are hardcoded to only display for the SPY security "AMEX:SPY"
// Terms \\
Feel free to use the script, If you do use the script could you please just tag me as I am interested to see how people are using it. Good Luck!

SPY, QQQ, VIX - Multi TF Trend Table***CURRENTLY IN BACKTESTING PHASE***
This TradingView script creates a real-time multi-timeframe trend status table for SPY, QQQ, and VIX using the Ripster-style EMA cloud logic.
🔍 What It Shows:
Current Price (1 Min): Live snapshot of each symbol.
10min Trend (5/12 EMA): Short-term momentum.
10min Trend (34/50 EMA): Intermediate-term direction.
1 Hour Trend: Higher timeframe trend.
Daily Trend: Long-term trend using 5/12 and 34/55 EMA alignment.
Each cell is color-coded:
✅ Green = Bullish
❌ Red = Bearish
Yellow can be used for neutral if customized.
⚙️ How It Works:
Uses request.security() to pull multi-timeframe EMA values for each symbol.
Compares fast/slow EMAs to determine bullish or bearish alignment.
The table is refreshed live and placed in a corner of your choice.
✅ Ideal For:
Trend traders using Ripster EMA clouds
SPY/QQQ/VIX correlation watchers
Traders seeking real-time trend clarity across multiple timeframes

SPY 5m Scalper + Auto Exit 3PM ET5m chart scalper for Spy/QQQ. It uses the 9,21,50 ema and the vwap to time puts and calls while trading options, you can also use it on other stocks.

SPY Overlay on ES/SPXEnhanced version of @ptgambler's for drawing SPY levels over ES/SPX.
lines/labels are configurable. The levels updates only when ES/SPX price moves by two dollars. That reduces jitter, and makes the code efficient.

SPY 1 Minute Day TraderWhen scalping options, users are looking for where breakouts are going to occur instead of sitting thru areas choppy price action that drain delta and cause them to lose value even if price is up trending. This script tries to identify when a trend reversal is expected based on one minute price action on the SPY. It alerts users to prepare for potential breakout when 5 out of the 6 key optimized parameters are discovered by showing a white L or S. Once all six trigger, it informs the user at the close of that candle with a golden triangle with Pivot Up or Pivot Down. As scalping options is something that is expected to be short in duration, a take profit and stop loss of 30 cents of price actions is established. If five or more parameters occur after the pivot is initiated, then stop losses and take profits are adhered to; however, if there are less, then it waits to take profit or stop the trade, as likely it is just noise and it will finish trend with an additional breakout.
This script has been created to take into account how the following variables impact trend for SPY 1 Minute:
ema vs 13 ema : A cross establishes start of trend
MACD (Line, Signal & Slope) : If you have momentum
ADX : if you are trending
RSI : If the trend has strength
The above has been optimized to determine pivot points in the trend using key values for these 6 indicators
bounce up = ema5 > ema13 and macdLine < .5 and adx > 20 and macdSlope > 0 and signalLine > -.1 and rsiSignal > 40
bounce down = ema5 < ema13 and macdLine > -.5 and adx > 20 and signalLine < 0 and macdSlope < 0 and rsiSignal < 60
White L's indicate that 5 of 6 conditions are met due to impending uptrend w/ missing one in green below it
Yellow L's indicate that 6 of 6 conditions still are met
White S's indicate that 5 of 6 conditions are met due to impending downtrend w/ missing condition in red above it
Yellow S's indicate that 6 of 6 conditions still are met
After a downtrend or uptrend is established, once it closes it can't repeat for 10 minutes
Won't open any trades on last two minutes of any hours to avoid volatility
Will close any open trades going into last minute of hour to avoid large overnight random swings.

SPY DXY VIX MonitorIf you like to monitor DXY and VIX while trading SPY this tool is for you. It gives you the price of all three and the direction they are going based on a smoothed derivative. This should help you make trading decisions based on this strategy of monitoring the three much easier as you get a small box on your chart. You can change the location of this on your chart to! I know its a small release but I hope you can find great use with this!