Cari dalam skrip untuk "stoch"

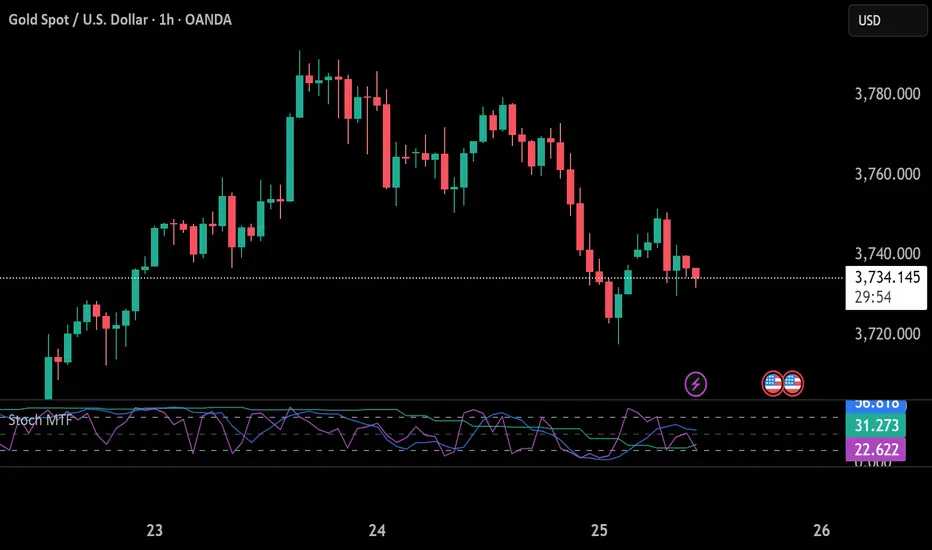
Stochastic Average (2 TFs)“Stoch (2 TFs)” plots two separate Stochastic oscillators from two different timeframes in a single pane and adds an average line of all four values (%K and %D from each timeframe). It is designed to quickly compare short-term vs higher-timeframe momentum and see whether they are aligned or diverging.
The script is an overlay-off oscillator, so it appears in its own window under the price chart.
How it works
The indicator calculates a classic Stochastic (%K and %D) on two user-selectable timeframes:
tf1 (default 30 minutes)
tf2 (default 60 minutes)
For each timeframe it:
Requests the high, low and close series from that timeframe using request.security.
Computes %K as the smoothed position of the close within the lookback high/low range.
Computes %D as a moving average of %K.
So you get four lines in total:
K1 and D1 from timeframe 1
K2 and D2 from timeframe 2
A small table in the top-right of the pane shows which timeframes are currently selected for TF1 and TF2, so you always know what you are looking at even if you change the chart timeframe.
Inputs
%K Length – lookback period used to find highest high and lowest low.
%K Smoothing – smoothing length for the %K line.
%D Smoothing – smoothing length for the %D line.
30 (tf1) – first Stochastic timeframe (default 30m).
%K Color (1) / %D Color (1) – colors for K1 and D1.
60 (tf2) – second Stochastic timeframe (default 60m).
%K Color (2) / %D Color (2) – colors for K2 and D2.
Average Color – color for the current bar average line.
Average Prev Color – color for the previous-bar average line.
You can put this indicator on any chart timeframe; the internals always use the two selected timeframes via request.security.
Visual elements
The pane shows:
Four Stochastic lines:
K1 and D1 (for tf1), K2 and D2 (for tf2), using the input colors.
Three horizontal reference levels:
80 (upper band), 50 (middle), 20 (lower band).
A light blue background band between 80 and 20 to make the overbought/oversold zone easier to see visually.
A 2-cell table in the top-right with the current values of tf1 and tf2.
These elements make it easy to see when each timeframe is overbought, oversold, or in the middle zone, and whether the two timeframes are synchronized or showing divergence.
Average and previous-average lines
At the bottom of the script there is a simple composite measure:
Sum KD adds K1 + D1 + K2 + D2 and divides by 4.
Prev Sum KD does the same for the previous bar ( ).
Both are plotted as separate lines:
Sum KD – current bar average of all four Stochastic values (main composite).
Prev Sum KD – previous bar average (for comparison).
This makes it easy to see whether overall multi-timeframe Stochastic momentum is increasing or decreasing from bar to bar without having to visually average four separate curves.
How to use
Typical uses:
See short- vs higher-timeframe Stochastic at a glance and trade only when they agree.
Look for divergence between TF1 and TF2 (e.g., lower timeframe overbought while higher timeframe still neutral).
Use the average lines (Sum KD and Prev Sum KD) as a simple “multi-TF momentum gauge” for confirmations or filters.

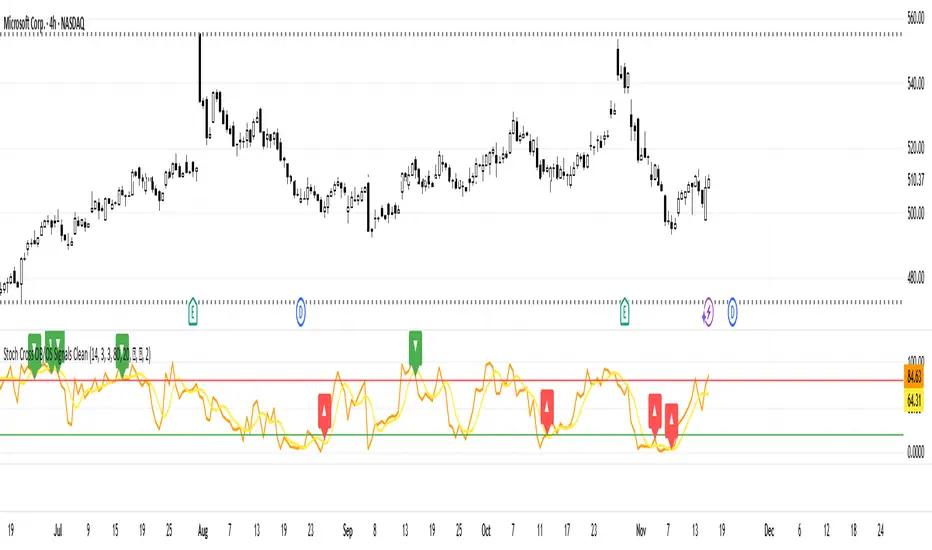
Stoch Cross OB/OS Signals CleanStoch Cross OB/OS Signals
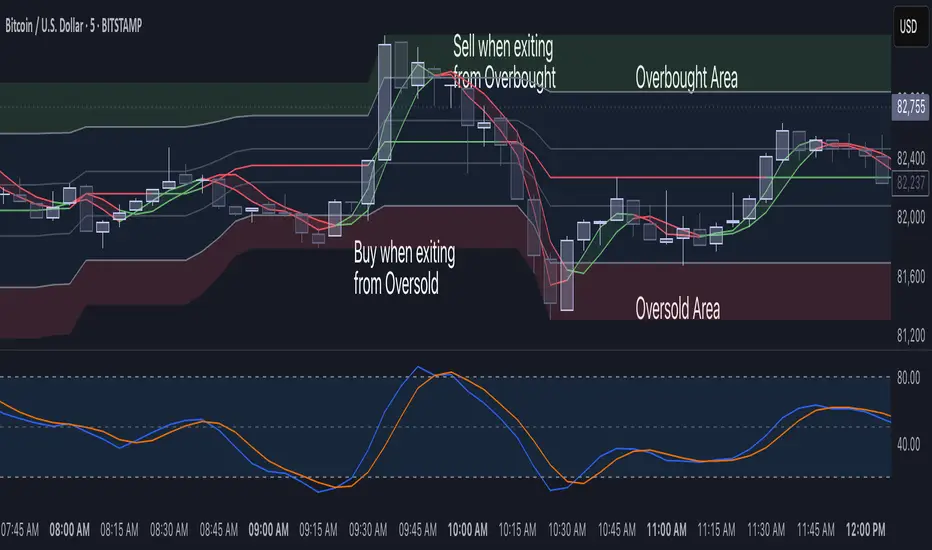
Displays fast (%K) and slow (%D) Stochastic lines with visual signals for overbought and oversold conditions. Alerts when the fast line crosses the slow line in OB/OS zones using customizable symbols. Ideal for spotting short-term reversals and timing entries/exits. Features adjustable periods, OB/OS levels, and symbol sizes for clear chart visualization.

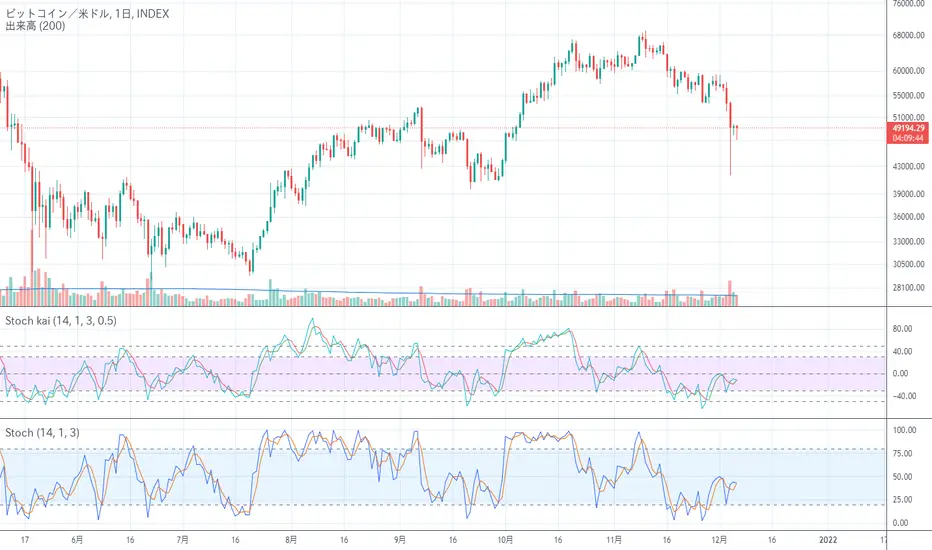
Stochastic kai ストキャス改Stochastic oscillator is a good indicator in the range market, but in the trend market, the value is saturated and sticks to the upper or lower side, so it is difficult to handle, so I tried to improve it.
I tried to make it difficult to saturate by adding trends. (Although there are limits ...)
I think the usage is the same as Stochastic Oscillator
レンジ相場ではストキャスティクスは良いインジケーターなのですが、トレンド相場では値が飽和して上の方か下の方に貼りついて扱いにくいので改良してみました。
トレンドを加味し飽和しにくくしてみました。(限界はありますが・・・)
使い方はストキャスティクスと同じで良いと思います
Stochastic MomentumStochastic Momentum adds shorter and longer term Stochastic movements on the same chart to indicate relative momentum for short and slightly longer term outlooks.
Can be used like a regular Stochastic indicator for overbought / oversold levels, divergence and additionally also the crossing of the shorter (blue) and longer (orange) levels.
It is a leading indicator and often signals early moves of momentum, which may or may not translate into the same price movements.

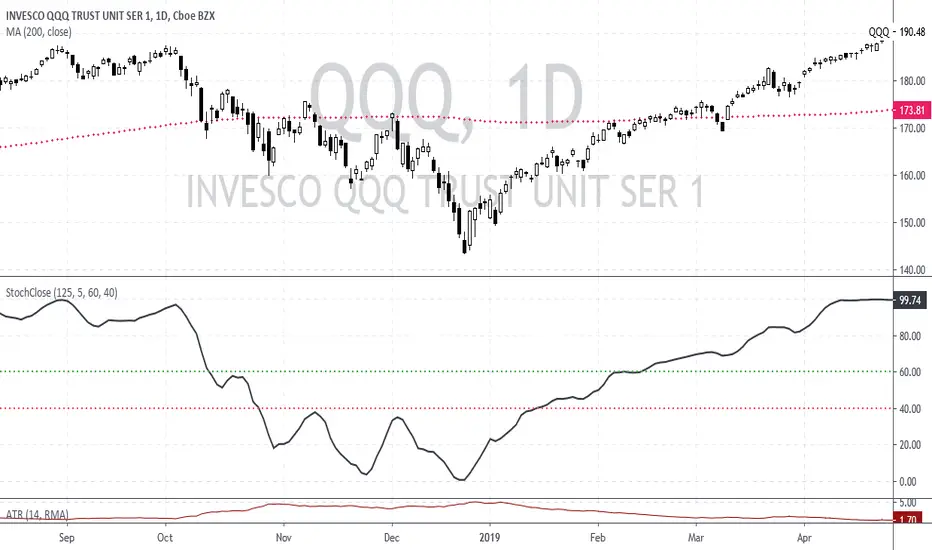
Stochastic based on Closing Prices - Identify and Rank TrendsStochClose is a trend indicator that can be used on its own to measure trend strength, in a scan to rank a group of securities according to trend strength or as part of a trend following strategy. Moreover, it acts as a volatility-adjusted trend indicator that puts securities on an equal footing.
StochClose measures the location of the current close relative to the close-only high-low range over a given period of time. In contrast to the traditional Stochastic Oscillator, this indicator only uses closing prices. Traditional Stochastic uses intraday highs and lows to calculate the range. The focus on closing prices reduces signal noise caused by intraday highs and lows, and filters out errant or irrationally exuberant price spikes.
Here are some examples when the high or low was out of proportion and suspect. Perhaps most famously, there were errant spike lows in dozens of ETFs in August 2015 (XLK, IJR, ITB). There were other spikes in VMBS (October 2014), IJR (October 2008) and KRE (May 2011). Elsewhere, there were suspicious spikes in IEI (April 2020), CHD (March 2020), CCRN (March 2020) and FNB (March 2020)
The preferred setting to identify medium and long-term uptrends is 125 days with 5 days smoothing. 125 days covers around six months. Thus, StochClose(125,5) is a 5-day SMA of the 125-day Stochastic based on closing prices. Smoothing with the 5-day SMA introduces a little lag, but reduces whipsaws and signal noise.
StochClose fluctuates between 0 and 100 with 50 as the midpoint. Values above 80 indicate that the current price is near the high end of the 125-day range, while values below 20 indicate that price is near the low end of the range. For signals, a move above 60 puts the indicator firmly in the top half of the range and points to an uptrend. A move below 40 puts the indicator firmly in the bottom half of the range and points to a downtrend.
StochClose values can also be ranked to separate the leaders from the laggards. In contrast to Rate-of-Change and Percentage Above/Below a Moving Average, StochClose acts as a volatility-adjusted indicator that can identify trend strength or weakness. The Consumer Staples SPDR is unlikely to win in a Rate-of-Change contest with the Technology SPDR. However, it is just as easy for the Consumer Staples SPDR to get in the top of its range as it is for the Technology SPDR. StochClose puts securities on an equal footing.
StochClose measures trend direction and trend strength with one number. The indicator value tells us immediately if the security is trending higher or lower. Furthermore, we can compare this value against the values for other securities. Securities with higher StochClose values are stronger than those with lower values.
Stoch DMIStochastics applied to adjusted ADX to represent the trend direction. DM based sub-indicators added to hint the momentum and changes in the ADX.

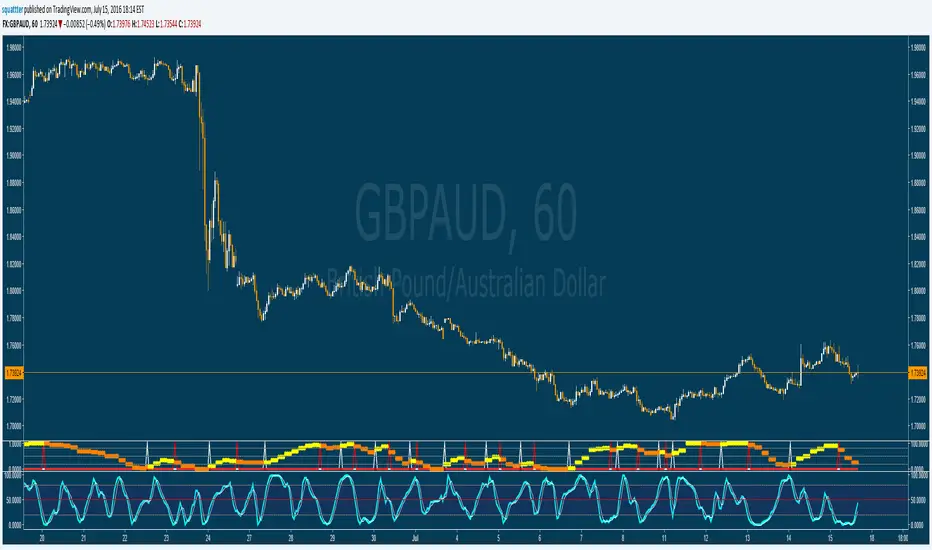
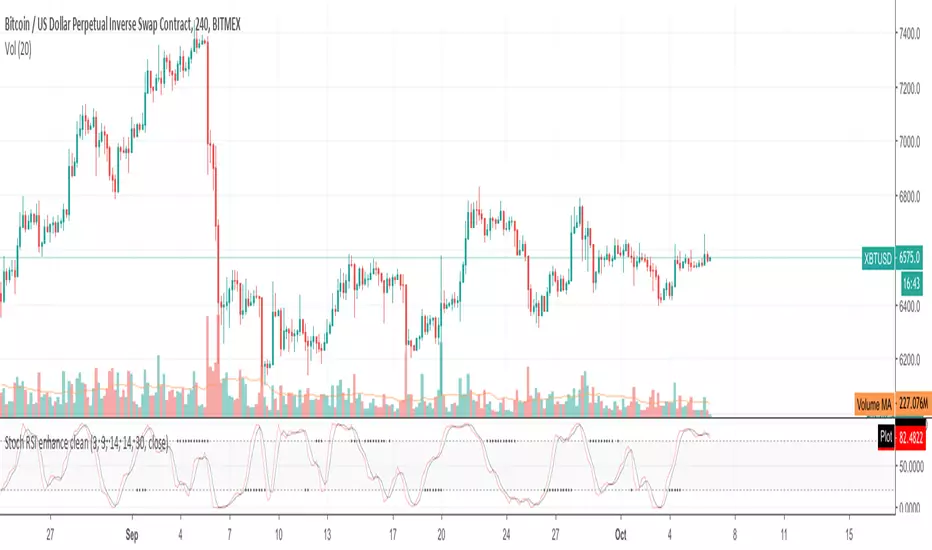
Stochastic RSI - MTF - Up/down colours - 4hr default - squattterStochastic RSI - MTF - Up/down colours - 4hr (240) default
Stochastic CCI MTF w/ UP/DOWN colours - squattterStoch CCI has a nicer divergence than Stoch RSI.
Enjoy!
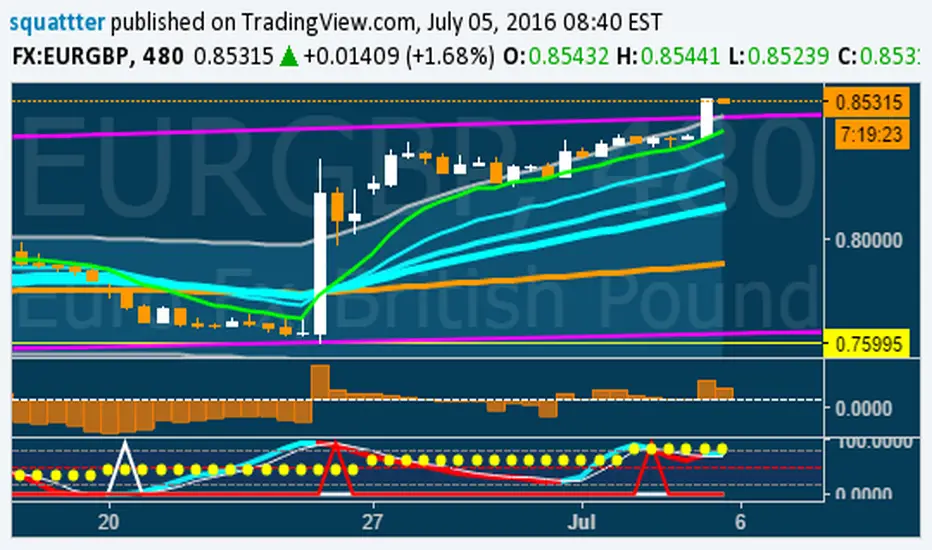
Stochastic CCI MTF w/ UP/DOWN colours - squattterStoch CCI has nicer divergences than Stoch RSI.
Enjoy.

Stochastic MACD - Slow and FastStochastic MACD - Slow and Fast
The "Stochastic MACD - Slow and Fast" indicator combines two popular technical indicators, the Stochastic Oscillator and the Moving Average Convergence Divergence ( MACD ).
The Stochastic Oscillator is a momentum indicator that measures the current closing position of an asset relative to its recent price range. This indicator helps traders identify possible turning points in an asset's trend, it is used to identify if the market is overbought or oversold.
On the other hand, the MACD is an indicator used to identify the trend and strength of the market and shows the difference between two exponential moving averages ( EMA ) of different periods. The MACD is commonly used to determine the direction of an asset's price trend.
The combination of both indicators can help traders identify market entry and exit opportunities. This indicator has two parts: a slow part and a fast part. The slow part uses input values for the lengths of the moving averages and the length of the signal for the MACD indicator. The fast part uses different input values for the lengths of the moving averages. Also, each part has its own set of line colors and histogram colors for easy visualization.
In general, the "Stochastic MACD - Slow and Fast" indicator is used to identify possible turning points in the trend of an asset. Traders can use the indicator to determine when to enter or exit a position based on the signals generated by the indicator. The stochastic MACD is a variation of the regular MACD that incorporates a stochastic oscillator to provide additional signals.
In summary, this indicator can be useful for those looking for a combination of two popular indicators to help identify trading opportunities.
In addition, parameters were defined to activate or deactivate the graphic signal.
When the Stochastic MACD Slow Line Crosses the Stochastic MACD Slow Signal Line:
Long or Buy = ↑ // The Entry is more Effective if it is made when the signal is below the Zero Trend Line .
Short or Sell = ↓ // The Entry is more Effective if it is made when the signal is above the Zero Trend Line .
When the Fast Stochastic MACD Line Crosses the Slow Stochastic MACD Line:
Long or Buy = ▲ // The Entry is more Effective if it is made when the signal is below the Zero Trend Line .
Short or Sell = ▼ // The Entry is more Effective if it is made when the signal is above the Zero Trend Line .
Taking into account the above, alerts were also defined for possible Purchases or Sales or entries in Long or Short.
COPOSITION AND USE OF THE INDICATOR
This script is an implementation of the Stochastic MACD indicator with two variations - Slow and Fast. It uses a combination of the Stochastic Oscillator and the Moving Average Convergence Divergence (MACD) indicator to identify trend reversals and momentum shifts in the price of an asset.
The Slow version of the Stochastic MACD is built using three inputs - fastLength, slowLength, and signalLength. The fastLength and slowLength are used to calculate two exponential moving averages (EMAs), while the signalLength is used to calculate a signal line as an EMA of the difference between the two EMAs. The Stochastic Oscillator is then applied to the difference between the two EMAs, and the resulting values are plotted on the chart.
The Fast version of the Stochastic MACD is built using the same inputs as the Slow version, but with different values. It uses a shorter fastLength value and a longer slowLength value to generate the two EMAs, and the resulting values are plotted on the chart.
The script also includes inputs for choosing the type of moving average to use (SMA, EMA, etc.), the source of price data (open, close, etc.), the lookback period, and the colors for the lines and histogram bars.
This script can be used in different markets such as forex, indices, and cryptocurrencies for analysis and trading. However, it is important to note that no trading strategy is guaranteed to be profitable, and traders should always conduct their own research and risk management.

Stochastic 6TF by jjuiiStochastic 6TF by J is a Multi-Timeframe (MTF) Stochastic indicator
that displays %K values from up to 6 different timeframes
in a single window. This helps traders analyze momentum
across short, medium, and long-term perspectives simultaneously.
Features:
- Supports 6 customizable timeframes (e.g., 5m, 15m, 1h, 4h, 1D, 1W)
- Option to show/hide each timeframe line
- Standard reference levels (20 / 50 / 80) with background shading
- Smoothed %K for clearer visualization
Best for:
- Cross-timeframe momentum analysis
- Spotting aligned Overbought / Oversold signals
- Confirming market trends and timing entries/exits
-------------------------------------------------------------
Stochastic 6TF by J คืออินดิเคเตอร์ Stochastic Multi Timeframe (MTF)
ที่สามารถแสดงค่า %K จากหลายกรอบเวลา (สูงสุด 6 TF)
ไว้ในหน้าต่างเดียว ช่วยให้นักเทรดมองเห็นโมเมนตัมของราคา
ทั้งระยะสั้น กลาง และยาว พร้อมกัน
คุณสมบัติ:
- เลือกกรอบเวลาได้ 6 ชุด (เช่น 5m, 15m, 1h, 4h, 1D, 1W)
- สามารถเปิด/ปิดการแสดงผลแต่ละ TF ได้
- มีเส้นแนวรับ/แนวต้านมาตรฐาน (20 / 50 / 80)
- ใช้เส้น %K ที่ถูกปรับค่าเฉลี่ยให้เรียบขึ้นเพื่ออ่านง่าย
เหมาะสำหรับ:
- การดูโมเมนตัมข้ามกรอบเวลา
- หาจังหวะ Overbought / Oversold ที่สอดคล้องกันหลาย TF
- ใช้ยืนยันแนวโน้มและหาจังหวะเข้า-ออกอย่างแม่นยำมากขึ้น
Stochastic Momentum IndexStochastic Momentum Index indicator script. This indicator was originally developed by William Blau (Stocks & Commodities V. 11:1 (11-18)).

Stochastic RSI - WT Confluence Signal Detectors (TraderDemircan)Description
What This Indicator Does:
This indicator combines two powerful momentum oscillators—WaveTrend and Stochastic RSI—to identify high-probability trading signals through confluence. Instead of relying on a single indicator that may generate false signals, this tool only triggers buy/sell alerts when both oscillators simultaneously confirm extreme market conditions and trend reversals. This confluence approach significantly reduces noise and helps traders focus on the most reliable setups.
Key Features:
Dual-Oscillator Confluence: Generates signals only when both WaveTrend crossovers and Stochastic RSI extreme levels align
Normalized Scale Display: Both oscillators are plotted on a unified -100 to +100 scale for easy visual comparison
Visual Signal Confirmation: Clear intersection points marked with colored circles, plus optional candle coloring at crossover moments
Customizable Thresholds: Adjust overbought/oversold levels for both oscillators to match your trading style and asset volatility
Clean Visual Presentation: Optional area fill showing WaveTrend momentum difference, making divergences easier to spot
How It Works:
The indicator operates on a confluence principle where multiple conditions must align:
For BUY Signals (Green):
WaveTrend 1 crosses above WaveTrend 2 (bullish crossover)
WaveTrend is in oversold territory (below -53 or -60)
Stochastic RSI K-line is below 20 (oversold)
For SELL Signals (Red):
WaveTrend 1 crosses below WaveTrend 2 (bearish crossover)
WaveTrend is in overbought territory (above 53 or 60)
Stochastic RSI K-line is above 80 (overbought)
WaveTrend Component:
Uses the hlc3 price (average of high, low, close) to calculate a channel index that identifies market momentum waves. The two WaveTrend lines (WT1 and WT2) act similarly to MACD, where crossovers indicate momentum shifts. The oscillator ranges from approximately -100 to +100, with extreme values suggesting potential reversals.
Stochastic RSI Component:
Applies stochastic calculations to RSI values rather than raw price, creating a more sensitive momentum indicator. Values above 80 indicate overbought conditions (potential selling opportunity), while values below 20 indicate oversold conditions (potential buying opportunity). The indicator includes both K-line (faster) and D-line (slower, smoothed) for additional confirmation.
Normalization Technology:
To enable direct visual comparison, the Stochastic RSI (normally 0-100 scale) is normalized to match WaveTrend's -100 to +100 scale. This allows traders to see both oscillators' movements in relation to the same reference levels, making divergences and convergences more apparent.
How to Use:
For Trend Traders:
Wait for confluence signals in the direction of the larger trend
Use buy signals in uptrends as entry points during pullbacks
Use sell signals in downtrends as entry points during bounces
For Reversal Traders:
Focus on confluence signals at major support/resistance levels
Look for divergences between price and oscillators before confluence signals
Consider stronger signals when both oscillators reach extreme levels (WT beyond ±60, Stoch beyond 20/80)
For Scalpers:
Lower the WaveTrend Channel Length (default 10) to 5-7 for more frequent signals
Tighten overbought/oversold thresholds slightly (e.g., WT: ±50, Stoch: 30/70)
Use on lower timeframes (5m, 15m) with strict stop losses
Settings Guide:
WaveTrend Parameters:
Channel Length (10): Controls sensitivity. Lower = more signals but more noise. Higher = fewer but more reliable signals
Average Length (21): Smoothing period for WT2. Higher values reduce whipsaws
Overbought Levels (60/53): Two-tier system. Breaching 60 indicates strong overbought, 53 is moderate
Oversold Levels (-60/-53): Mirror of overbought levels for downside extremes
Stochastic RSI Parameters:
K-Smooth (3): Smoothing for the K-line. Higher = smoother but delayed
D-Smooth (3): Additional smoothing for the D-line signal
RSI Period (14): Standard RSI calculation period
Stoch Period (14): Stochastic calculation lookback
Oversold (20) / Overbought (80): Classic thresholds for extreme conditions
Visual Options:
Show WT Difference Area: Displays the momentum difference between WT1 and WT2 as a blue shaded area
Show WT Intersection Points: Marks crossover points with colored circles (red for bearish, green for bullish)
Color Candles at Intersection: Changes candle colors at crossover moments (blue for bearish, yellow for bullish)
Show Stoch Over Signals: Displays when Stochastic RSI breaches extreme levels
What Makes This Original:
While WaveTrend and Stochastic RSI are established indicators, this script's originality lies in:
Confluence Logic: The specific combination requiring simultaneous confirmation from both oscillators in extreme zones, not just simple crossovers
Normalization Approach: Displaying both oscillators on the same -100 to +100 scale for direct visual comparison, which is not standard
Multi-Tier Overbought/Oversold: Using two levels (60/53) instead of one, allowing for nuanced signal strength assessment
Integrated Visual System: Combining area fills, intersection markers, and candle coloring in a coordinated display that shows momentum flow at a glance
Important Considerations:
This is a momentum-based oscillator system, which performs best in ranging or trending markets with clear swings
In strong trending markets, the oscillator may remain in extreme zones for extended periods (remain overbought during strong uptrends, oversold during strong downtrends)
Confluence signals are intentionally rare to maintain quality—expect fewer signals than with single-indicator systems
Always combine with price action analysis, support/resistance levels, and proper risk management
Not recommended for extremely low volatility or thin markets where oscillators may produce erratic readings
Best Timeframes:
Intraday: 15m, 1H (with tighter parameters)
Swing Trading: 4H, Daily (with default parameters)
Position Trading: Daily, Weekly (with extended Channel Length 15-20)
Typical Use Cases:
Identifying exhaustion points in trending markets
Timing entries during pullbacks in established trends
Spotting potential reversal zones at key price levels
Filtering out weak momentum signals during consolidation

Stoch Quad Oscillator📘 Stoch Quad Oscillator – User Guide
✅ Purpose
The Stoch Quad Oscillator is a multi-timeframe stochastic oscillator tool that helps traders detect oversold and overbought conditions, momentum shifts, and quad rotation signals using four distinct stochastic configurations. It includes visual cues, customizable parameters, and background highlights to improve decision-making during trend reversals or momentum surges.
🛠️ Inputs & Parameters
⏱ Timeframe
Timeframe for Stochastic Calculation: Defines which chart timeframe to use for stochastic calculations (default is "1" minute). This enables multi-timeframe analysis while on a lower timeframe chart.
📈 Stochastic Parameters
Four different stochastic configurations are used:
Label %K Length %D Smoothing Notes
K9 D3 9 3 Fastest, short-term view
K14 D3 14 3 Moderately short-term
K40 D4 40 4 Medium-term trend view
K60 D10 60 10 Long-term strength
Smoothing Type: Choose between SMA or EMA to control how smoothed the %D line is.
🎯 Levels
Overbought Level: Default 80
Oversold Level: Default 20
These are used to indicate overextended price conditions on any of the stochastic plots.
🔄 Quad Rotation Detection Settings
When enabled, the script detects synchronized oversold/overbought conditions with strong momentum using all 4 stochastic readings.
Enable Quad Rotation: Toggles detection on or off
Slope Calculation Bars: Number of bars used to calculate slope of %D lines
Slope Threshold: Minimum slope strength for signal (higher = stronger confirmation)
Oversold Quad Level: Total of all four stochastic values that define a quad oversold zone
Overbought Quad Level: Total of all four stochastic values that define a quad overbought zone
Oversold Quad Highlight Color: Background color when oversold quad is triggered
Overbought Quad Highlight Color: Background color when overbought quad is triggered
Slope Averaging Method: Either Simple Average or Weighted Average (puts more weight on higher timeframes)
Max Signal Bar Window: Defines how recent the signal must be to be considered valid
📊 Plots & Visual Elements
📉 Stochastic %D Lines
Each stochastic is plotted separately:
K9 D3 – Red
K14 D3 – Orange
K40 D4 – Fuchsia
K60 D10 – Silver
These help visualize short to long-term momentum simultaneously.
📏 Horizontal Reference Lines
Overbought Line (80) – Red
Oversold Line (20) – Green
These help you identify threshold breaches visually.
🌈 Background Highlighting
The indicator provides background highlights to mark potential signal zones:
✅ All Oversold or Overbought Conditions
When all four stochastics are either above overbought or below oversold:
Bright Red if all are overbought
Bright Green if all are oversold
🚨 Quad Rotation Signal Zones (if enabled)
Triggered when:
The combined sum of all four stochastic levels is extremely low/high (below/above oversoldQuadLevel or overboughtQuadLevel)
The average slope of the 4 %D lines is sharply positive (> slopeThreshold)
Highlights:
Custom Red Tint = Strong overbought quad signal
Custom Green Tint = Strong oversold quad signal
These zones can indicate momentum shifts or reversal potential when used with price action or other tools.
⚠️ Limitations & Considerations
This indicator does not provide trade signals. It visualizes conditions and potential setups.
It is best used in confluence with price action, support/resistance levels, and other indicators.
False positives may occur in ranging markets. Reduce reliance on slope thresholds during low volatility.
Quad signals rely on slope strength, which may lag slightly behind sudden reversals.
🧠 Tips for Use
Combine with volume, MACD, or PSAR to confirm direction before entry.
Watch for divergences between price and any of the stochastics.
Use on higher timeframes (e.g., 5m–30m) to filter for swing trading setups; use shorter TFs (1m–5m) for scalping signals.
Adjust oversoldQuadLevel and overboughtQuadLevel based on market conditions (e.g., in trending vs ranging markets).

Stochastic Overlay [NLR]If you've ever traded with the Stochastic oscillator, you probably love its ability to gauge momentum and overbought/oversold conditions. However, one common frustration is interpreting its movements alongside the actual price chart. The oscillator, plotted separately, can feel disconnected from price action, forcing traders to constantly glance back and forth. That’s exactly the problem I wanted to solve with this indicator.
The Solution: Stochastic Overlay
This indicator takes the familiar Stochastic oscillator and integrates it directly onto the price chart. Instead of struggling to correlate Stochastic signals with price movements, you now see the levels overlaid on the main chart, bringing momentum analysis into a more intuitive space.
What is the Stochastic Oscillator? (For the Newbies)
The Stochastic oscillator is a momentum-based indicator that measures the closing price relative to the high-low range over a specified period. It fluctuates between 0 and 100, helping traders identify potential reversals when the market is overbought (above 80) or oversold (below 20). The two key components are:
%K (fast-moving line)
%D (a smoothed moving average of %K)
Technical Details of the Overlay
The indicator adjusts the traditional Stochastic calculation by multiplying the timeframe (HTF multiplier), allowing traders to view higher-timeframe Stochastics. Set HTF Multiplier to 1 to see current timeframe Stochastics
It plots horizontal reference lines representing 0%, 20%, 40%, 50%, 60%, 80%, and 100% levels, giving a visual framework of price movement.
Color-coded fills help differentiate bullish and bearish zones—making it easy to spot potential turning points.
Why Do the %K & %D Lines Look “Crooked”?
Normally, the %K and %D lines range between 0 and 100, but in this overlay, they are scaled to fit the current price gap (the difference between the highest and lowest price in the selected period). This means their movement aligns more closely with price action, but it may appear distorted compared to a standard Stochastic oscillator.
For clarity, you can enable the visibility of %K and %D (Show %K %D option), allowing the scaled Stochastic values to be plotted within the price range.
Why Use This Overlay?
Better price interpretation: Instead of staring at a separate oscillator panel, you see momentum levels right where the price action unfolds.
Higher-timeframe integration: Adjusting the multiplier allows you to track the Stochastic behavior of larger timeframes without switching charts.
Clear visual cues: The colored fills and midpoint signals enhance readability for momentum shifts.
This tool transforms the way traders engage with Stochastic indicators, making momentum analysis more intuitive and efficient. Try it out, and see how your interpretation of price and momentum improves!
Stochastic with Outlier Labels/MTFTL;DR This indicator is an update to a simple stochastic ('Stoch_MTF' by binarytrader666) that provides a novel outlier highlighting feature
Improvements on stochastic:
1. Novel outlier highlighting that points out crosses that are the Nth consecutive cross or greater.
2. Allowing for multiple timeframes to be shown on the same chart
3. Highlighting/Labelling crosses and providing labels for alerts
A cross of the stochastics in the high or low zones establishes a trend. Successive crosses in the same region seem to indicate a continuation of that trend. The outlier functionality here provides a signal for when X number of crosses have been in the same trend, signaling further strength of that signal.
I also provided the necessary code for converting this to a strategy if you so wish at the bottom.
STOCHASTIC+Stochastic Oscillators are used to determine Overbought and Oversold Market conditions. This Stoch is set to a quicker Length then normal with an RSI that changes color depending on Momentum. When RSI is Overbought you well get a red shadow to indicate the market is setting up for a sell. When the RSI is Oversold you will get a green shadow to indicate the market is setting up for a buy

Stochastic Divergence MarkerThis script marks all the times the price movement moves contradictory to the Stochastic. This usually shows a change in momentum and thus a possible reversal.