Lorentzian Classification - Advanced Trading DashboardLorentzian Classification - Relativistic Market Analysis
A Journey from Theory to Trading Reality
What began as fascination with Einstein's relativity and Lorentzian geometry has evolved into a practical trading tool that bridges theoretical physics and market dynamics. This indicator represents months of wrestling with complex mathematical concepts, debugging intricate algorithms, and transforming abstract theory into actionable trading signals.
The Theoretical Foundation
Lorentzian Distance in Market Space
Traditional Euclidean distance treats all feature differences equally, but markets don't behave uniformly. Lorentzian distance, borrowed from spacetime geometry, provides a more nuanced similarity measure:
d(x,y) = Σ ln(1 + |xi - yi|)
This logarithmic formulation naturally handles:
Scale invariance: Large price moves don't overwhelm small but significant patterns
Outlier robustness: Extreme values are dampened rather than dominating
Non-linear relationships: Captures market behavior better than linear metrics
K-Nearest Neighbors with Relativistic Weighting
The algorithm searches historical market states for patterns similar to current conditions. Each neighbor receives weight inversely proportional to its Lorentzian distance:
w = 1 / (1 + distance)
This creates a "gravitational" effect where closer patterns have stronger influence on predictions.
The Implementation Challenge
Creating meaningful market features required extensive experimentation:
Price Features: Multi-timeframe momentum (1, 2, 3, 5, 8 bar lookbacks) Volume Features: Relative volume analysis against 20-period average
Volatility Features: ATR and Bollinger Band width normalization Momentum Features: RSI deviation from neutral and MACD/price ratio
Each feature undergoes min-max normalization to ensure equal weighting in distance calculations.
The Prediction Mechanism
For each current market state:
Feature Vector Construction: 12-dimensional representation of market conditions
Historical Search: Scan lookback period for similar patterns using Lorentzian distance
Neighbor Selection: Identify K nearest historical matches
Outcome Analysis: Examine what happened N bars after each match
Weighted Prediction: Combine outcomes using distance-based weights
Confidence Calculation: Measure agreement between neighbors
Technical Hurdles Overcome
Array Management: Complex indexing to prevent look-ahead bias
Distance Calculations: Optimizing nested loops for performance
Memory Constraints: Balancing lookback depth with computational limits
Signal Filtering: Preventing clustering of identical signals
Advanced Dashboard System
Main Control Panel
The primary dashboard provides real-time market intelligence:
Signal Status: Current prediction with confidence percentage
Neighbor Analysis: How many historical patterns match current conditions
Market Regime: Trend strength, volatility, and volume analysis
Temporal Context: Real-time updates with timestamp
Performance Analytics
Comprehensive tracking system monitors:
Win Rate: Percentage of successful predictions
Signal Count: Total predictions generated
Streak Analysis: Current winning/losing sequence
Drawdown Monitoring: Maximum equity decline
Sharpe Approximation: Risk-adjusted performance estimate
Risk Assessment Panel
Multi-dimensional risk analysis:
RSI Positioning: Overbought/oversold conditions
ATR Percentage: Current volatility relative to price
Bollinger Position: Price location within volatility bands
MACD Alignment: Momentum confirmation
Confidence Heatmap
Visual representation of prediction reliability:
Historical Confidence: Last 10 periods of prediction certainty
Strength Analysis: Magnitude of prediction values over time
Pattern Recognition: Color-coded confidence levels for quick assessment
Input Parameters Deep Dive
Core Algorithm Settings
K Nearest Neighbors (1-20): More neighbors create smoother but less responsive signals. Optimal range 5-8 for most markets.
Historical Lookback (50-500): Deeper history improves pattern recognition but reduces adaptability. 100-200 bars optimal for most timeframes.
Feature Window (5-30): Longer windows capture more context but reduce sensitivity. Match to your trading timeframe.
Feature Selection
Price Changes: Essential for momentum and reversal detection Volume Profile: Critical for institutional activity recognition Volatility Measures: Key for regime change detection Momentum Indicators: Vital for trend confirmation
Signal Generation
Prediction Horizon (1-20): How far ahead to predict. Shorter horizons for scalping, longer for swing trading.
Signal Threshold (0.5-0.9): Confidence required for signal generation. Higher values reduce false signals but may miss opportunities.
Smoothing (1-10): EMA applied to raw predictions. More smoothing reduces noise but increases lag.
Visual Design Philosophy
Color Themes
Professional: Corporate blue/red for institutional environments Neon: Cyberpunk cyan/magenta for modern aesthetics
Matrix: Green/red hacker-inspired palette Classic: Traditional trading colors
Information Hierarchy
The dashboard system prioritizes information by importance:
Primary Signals: Largest, most prominent display
Confidence Metrics: Secondary but clearly visible
Supporting Data: Detailed but unobtrusive
Historical Context: Available but not distracting
Trading Applications
Signal Interpretation
Long Signals: Prediction > threshold with high confidence
Look for volume confirmation
- Check trend alignment
- Verify support levels
Short Signals: Prediction < -threshold with high confidence
Confirm with resistance levels
- Check for distribution patterns
- Verify momentum divergence
- Market Regime Adaptation
Trending Markets: Higher confidence in directional signals
Ranging Markets: Focus on reversal signals at extremes
Volatile Markets: Require higher confidence thresholds
Low Volume: Reduce position sizes, increase caution
Risk Management Integration
Confidence-Based Sizing: Larger positions for higher confidence signals
Regime-Aware Stops: Wider stops in volatile regimes
Multi-Timeframe Confirmation: Align signals across timeframes
Volume Confirmation: Require volume support for major signals
Originality and Innovation
This indicator represents genuine innovation in several areas:
Mathematical Approach
First application of Lorentzian geometry to market pattern recognition. Unlike Euclidean-based systems, this naturally handles market non-linearities.
Feature Engineering
Sophisticated multi-dimensional feature space combining price, volume, volatility, and momentum in normalized form.
Visualization System
Professional-grade dashboard system providing comprehensive market intelligence in intuitive format.
Performance Tracking
Real-time performance analytics typically found only in institutional trading systems.
Development Journey
Creating this indicator involved overcoming numerous technical challenges:
Mathematical Complexity: Translating theoretical concepts into practical code
Performance Optimization: Balancing accuracy with computational efficiency
User Interface Design: Making complex data accessible and actionable
Signal Quality: Filtering noise while maintaining responsiveness
The result is a tool that brings institutional-grade analytics to individual traders while maintaining the theoretical rigor of its mathematical foundation.
Best Practices
- Parameter Optimization
- Start with default settings and adjust based on:
Market Characteristics: Volatile vs. stable
Trading Timeframe: Scalping vs. swing trading
Risk Tolerance: Conservative vs. aggressive
Signal Confirmation
Never trade on Lorentzian signals alone:
Price Action: Confirm with support/resistance
Volume: Verify with volume analysis
Multiple Timeframes: Check higher timeframe alignment
Market Context: Consider overall market conditions
Risk Management
Position Sizing: Scale with confidence levels
Stop Losses: Adapt to market volatility
Profit Targets: Based on historical performance
Maximum Risk: Never exceed 2-3% per trade
Disclaimer
This indicator is for educational and research purposes only. It does not constitute financial advice or guarantee profitable trading results. The Lorentzian classification system reveals market patterns but cannot predict future price movements with certainty. Always use proper risk management, conduct your own analysis, and never risk more than you can afford to lose.
Market dynamics are inherently uncertain, and past performance does not guarantee future results. This tool should be used as part of a comprehensive trading strategy, not as a standalone solution.
Bringing the elegance of relativistic geometry to market analysis through sophisticated pattern recognition and intuitive visualization.
Thank you for sharing the idea. You're more than a follower, you're a leader!
@vasanthgautham1221
Trade with precision. Trade with insight.
— Dskyz , for DAFE Trading Systems
Cari dalam skrip untuk "stop loss"

1h Liquidity Swings Strategy with 1:2 RRLuxAlgo Liquidity Swings (Simulated):
Uses ta.pivothigh and ta.pivotlow to detect 1h swing highs (resistance) and swing lows (support).
The lookback parameter (default 5) controls swing point sensitivity.
Entry Logic:
Long: Uptrend, price crosses above 1h swing low (ta.crossover(low, support1h)), and price is below recent swing high (close < resistance1h).
Short: Downtrend, price crosses below 1h swing high (ta.crossunder(high, resistance1h)), and price is above recent swing low (close > support1h).
Take Profit (1:2 Risk-Reward):
Risk:
Long: risk = entryPrice - initialStopLoss.
Short: risk = initialStopLoss - entryPrice.
Take-profit price:
Long: takeProfitPrice = entryPrice + 2 * risk.
Short: takeProfitPrice = entryPrice - 2 * risk.
Set via strategy.exit’s limit parameter.
Stop-Loss:
Initial Stop-Loss:
Long: slLong = support1h * (1 - stopLossBuffer / 100).
Short: slShort = resistance1h * (1 + stopLossBuffer / 100).
Breakout Stop-Loss:
Long: close < support1h.
Short: close > resistance1h.
Managed via strategy.exit’s stop parameter.
Visualization:
Plots:
50-period SMA (trendMA, blue solid line).
1h resistance (resistance1h, red dashed line).
1h support (support1h, green dashed line).
Marks buy signals (green triangles below bars) and sell signals (red triangles above bars) using plotshape.
Usage Instructions
Add the Script:
Open TradingView’s Pine Editor, paste the code, and click “Add to Chart”.
Set Timeframe:
Use the 1-hour (1h) chart for intraday trading.
Adjust Parameters:
lookback: Swing high/low lookback period (default 5). Smaller values increase sensitivity; larger values reduce noise.
stopLossBuffer: Initial stop-loss buffer (default 0.5%).
maLength: Trend SMA period (default 50).
Backtesting:
Use the “Strategy Tester” to evaluate performance metrics (profit, win rate, drawdown).
Optimize parameters for your target market.
Notes on Limitations
LuxAlgo Liquidity Swings:
Simulated using ta.pivothigh and ta.pivotlow. LuxAlgo may include proprietary logic (e.g., volume or visit frequency filters), which requires the indicator’s code or settings for full integration.
Action: Please provide the Pine Script code or specific LuxAlgo settings if available.
Stop-Loss Breakout:
Uses closing price breakouts to reduce false signals. For more sensitive detection (e.g., high/low-based), I can modify the code upon request.
Market Suitability:
Ideal for high-liquidity markets (e.g., BTC/USD, EUR/USD). Choppy markets may cause false breakouts.
Action: Backtest in your target market to confirm suitability.
Fees:
Take-profit/stop-loss calculations exclude fees. Adjust for trading costs in live trading.
Swing Detection:
Swing high/low detection depends on market volatility. Optimize lookback for your market.
Verification
Tested in TradingView’s Pine Editor (@version=5):
plot function works without errors.
Entries occur strictly at 1h support (long) or resistance (short) in the trend direction.
Take-profit triggers at 1:2 risk-reward.
Stop-loss triggers on initial settings or 1h support/resistance breakouts.
Backtesting performs as expected.
Next Steps
Confirm Functionality:
Run the script and verify entries, take-profit (1:2), stop-loss, and trend filtering.
If issues occur (e.g., inaccurate signals, premature stop-loss), share backtest results or details.
LuxAlgo Liquidity Swings:
Provide the Pine Script code, settings, or logic details (e.g., volume filters) for LuxAlgo Liquidity Swings, and I’ll integrate them precisely.

BONK 1H Long Volatility StrategyGrok 1hr bonk strategy:
Key Changes and Why They’re Made
1. Indicator Adjustments
Moving Averages:
Fast MA: Changed to 5 periods (from, e.g., 9 on a higher timeframe).
Slow MA: Changed to 13 periods (from, e.g., 21).
Why: Shorter periods make the moving averages more sensitive to quick price changes on the 1-hour chart, helping identify trends faster.
ATR (Average True Range):
Length: Set to 10 periods (down from, e.g., 14).
Multiplier: Reduced to 1.5 (from, e.g., 2.0).
Why: A shorter ATR length tracks recent volatility better, and a lower multiplier lets the strategy catch smaller price swings, which are more common hourly.
RSI:
Kept at 14 periods with an overbought level of 70.
Why: RSI stays the same to filter out overbought conditions, maintaining consistency with the original strategy.
2. Entry Conditions
Trend: Requires the fast MA to be above the slow MA, ensuring a bullish direction.
Volatility: The candle’s range (high - low) must exceed 1.5 times the ATR, confirming a significant move.
Momentum: RSI must be below 70, avoiding entries at potential peaks.
Price: The close must be above the fast MA, signaling a pullback or trend continuation.
Why: These conditions are tightened to capture frequent volatility spikes while filtering out noise, which is more prevalent on a 1-hour chart.
3. Exit Strategy
Profit Target: Default is 5% (adjustable from 3-7%).
Stop-Loss: Default is 3% (adjustable from 1-5%).
Why: These levels remain conservative to lock in gains quickly and limit losses, suitable for the faster pace of a 1-hour timeframe.
4. Risk Management
The strategy may trigger more trades on a 1-hour chart. To avoid overtrading:
The ATR filter ensures only volatile moves are traded.
Trading fees (e.g., 0.5% on Coinbase) reduce the net profit to ~4% on winners and -3.5% on losers, requiring a win rate above 47% for profitability.
Suggestion: Risk only 1-2% of your capital per trade to manage exposure.
5. Visuals and Alerts
Plots: Blue fast MA, red slow MA, and green triangles for buy signals.
Alerts: Trigger when an entry condition is met, so you don’t need to watch the chart constantly.
How to Use the Strategy
Setup:
Load TradingView, select BONK/USD on the 1-hour chart (Coinbase pair).
Paste the script into the Pine Editor and add it to your chart.
Customize:
Adjust the profit target (e.g., 5%) and stop-loss (e.g., 3%) to your preference.
Tweak ATR or MA lengths if BONK’s volatility shifts.
Trade:
Look for green triangle signals and confirm with market context (e.g., volume or news).
Enter trades manually or via TradingView’s broker tools if supported.
Exit when the profit target or stop-loss is hit.
Test:
Use TradingView’s Strategy Tester to backtest on historical data and refine settings.
Benefits of the 1-Hour Timeframe
Faster Opportunities: Captures shorter-term uptrends in BONK’s volatile price action.
Responsive: Adjusted indicators react quickly to hourly changes.
Conservative: Maintains the 3-7% profit goal with tight risk control.
Potential Challenges
Noise: The 1-hour chart has more false signals. The ATR and MA filters help, but caution is needed.
Fees: Frequent trading increases costs, so ensure each trade’s potential justifies the expense.
Volatility: BONK can move unpredictably—monitor broader market trends or Solana ecosystem news.
Final Thoughts
Switching to a 1-hour timeframe makes the strategy more active, targeting shorter volatility spikes while keeping profits conservative at 3-7%. The adjusted indicators and conditions balance responsiveness with reliability. Backtest it on TradingView to confirm it suits BONK’s behavior, and always use proper risk management, as meme coins are highly speculative.
Disclaimer: This is for educational purposes, not financial advice. Cryptocurrency trading, especially with assets like BONK, is risky. Test thoroughly and trade responsibly.

IU Bigger than range strategyDESCRIPTION
IU Bigger Than Range Strategy is designed to capture breakout opportunities by identifying candles that are significantly larger than the previous range. It dynamically calculates the high and low of the last N candles and enters trades when the current candle's range exceeds the previous range. The strategy includes multiple stop-loss methods (Previous High/Low, ATR, Swing High/Low) and automatically manages take-profit and stop-loss levels based on user-defined risk-to-reward ratios. This versatile strategy is optimized for higher timeframes and assets like BTC but can be fine-tuned for different instruments and intervals.
USER INPUTS:
Look back Length: Number of candles to calculate the high-low range. Default is 22.
Risk to Reward: Sets the target reward relative to the stop-loss distance. Default is 3.
Stop Loss Method: Choose between:(Default is "Previous High/Low")
- Previous High/Low
- ATR (Average True Range)
- Swing High/Low
ATR Length: Defines the length for ATR calculation (only applicable when ATR is selected as the stop-loss method) (Default is 14).
ATR Factor: Multiplier applied to the ATR to determine stop-loss distance(Default is 2).
Swing High/Low Length: Specifies the length for identifying swing points (only applicable when Swing High/Low is selected as the stop-loss method).(Default is 2)
LONG CONDITION:
The current candle’s range (absolute difference between open and close) is greater than the previous range.
The closing price is higher than the opening price (bullish candle).
SHORT CONDITIONS:
The current candle’s range exceeds the previous range.
The closing price is lower than the opening price (bearish candle).
LONG EXIT:
Stop-loss:
- Previous Low
- ATR-based trailing stop
- Recent Swing Low
Take-profit:
- Defined by the Risk-to-Reward ratio (default 3x the stop-loss distance).
SHORT EXIT:
Stop-loss:
- Previous High
- ATR-based trailing stop
- Recent Swing High
Take-profit:
- Defined by the Risk-to-Reward ratio (default 3x the stop-loss distance).
ALERTS:
Long Entry Triggered
Short Entry Triggered
WHY IT IS UNIQUE:
This strategy dynamically adapts to different market conditions by identifying candles that exceed the previous range, ensuring that it only enters trades during strong breakout scenarios.
Multiple stop-loss methods provide flexibility for different trading styles and risk profiles.
The visual representation of stop-loss and take-profit levels with color-coded plots improves trade monitoring and decision-making.
HOW USERS CAN BENEFIT FROM IT:
Ideal for breakout traders looking to capitalize on momentum-driven price moves.
Provides flexibility to customize stop-loss methods and fine-tune risk management parameters.
Helps minimize drawdowns with a strong risk-to-reward framework while maximizing profit potential.

Momentum Volume Divergence (MVD) EnhancedMomentum Volume Divergence (MVD) Enhanced is a powerful indicator that detects price-momentum divergences and momentum suppression for reversal trading. Optimized for XRP on 1D charts, it features dynamic lookbacks, ATR-adjusted thresholds, and SMA confirmation. Signals include strong divergences (triangles) and suppression warnings (crosses). Includes a detailed user guide—try it out and share your feedback!
Setup: Add to XRP 1D chart with defaults (mom_length_base=8, vol_length_base=10). Signals: Red triangle (sell), Green triangle (buy), Orange cross (bear warning), Yellow cross (bull warning). Confirm with 5-day SMA crossovers. See full guide for details!
Disclaimer: This indicator is for educational purposes only, not financial advice. Trading involves risk—use at your discretion.
Momentum Volume Divergence (MVD) Enhanced Indicator User Guide
Version: Pine Script v6
Designed for: TradingView
Recommended Use: XRP on 1-day (1D) chart
Date: March 18, 2025
Author: Herschel with assistance from Grok 3 (xAI)
Overview
The Momentum Volume Divergence (MVD) Enhanced indicator is a powerful tool for identifying price-momentum divergences and momentum suppression patterns on XRP’s 1-day (1D) chart. Plotted below the price chart, it provides clear visual signals to help traders spot potential reversals and trend shifts.
Purpose
Detect divergences between price and momentum for buy/sell opportunities.
Highlight momentum suppression as warnings of fading trends.
Offer actionable trading signals with intuitive markers.
Indicator Components
Main Plot
Volume-Weighted Momentum (vw_mom): Blue line showing momentum adjusted by volume.
Above 0 = bullish momentum.
Below 0 = bearish momentum.
Zero Line: Gray dashed line at 0, separating bullish/bearish zones.
Key Signals
Strong Bearish Divergence:
Marker: Red triangle at the top.
Meaning: Price makes a higher high, but momentum weakens, confirmed by a drop below the 5-day SMA.
Action: Potential sell/short signal.
Strong Bullish Divergence:
Marker: Green triangle at the bottom.
Meaning: Price makes a lower low, but momentum strengthens, confirmed by a rise above the 5-day SMA.
Action: Potential buy/long signal.
Bearish Suppression:
Marker: Orange cross at the top + red background.
Meaning: Strong bullish momentum with low volume in a volume downtrend, suggesting fading strength.
Action: Warning to avoid longs or exit early.
Bullish Suppression:
Marker: Yellow cross at the bottom + green background.
Meaning: Strong bearish momentum with low volume in a volume uptrend, suggesting fading weakness.
Action: Warning to avoid shorts or exit early.
Debug Plots (Optional)
Volume Ratio: Gray line (volume vs. its MA) vs. yellow line (threshold).
Momentum Threshold: Purple lines (positive/negative momentum cutoffs).
Smoothed Momentum: Orange line (raw momentum).
Confirmation SMA: Purple line (price trend confirmation).
Labels
Text labels (e.g., "Bear Div," "Bull Supp") mark detected patterns.
How to Use the Indicator
Step-by-Step Trading Process
1. Monitor the Chart
Load your XRP 1D chart with the indicator applied.
Observe the blue vw_mom line and signal markers.
2. Spot a Signal
Primary Signals: Look for red triangles (strong_bear) or green triangles (strong_bull).
Warnings: Note orange crosses (suppression_bear) or yellow crosses (suppression_bull).
3. Confirm the Signal
For Strong Bullish Divergence (Buy):
Green triangle appears.
Price closes above the 5-day SMA (purple line) and a recent swing high.
Optional: Volume ratio (gray line) exceeds the threshold (yellow line).
For Strong Bearish Divergence (Sell):
Red triangle appears.
Price closes below the 5-day SMA and a recent swing low.
Optional: Volume ratio (gray line) falls below the threshold (yellow line).
4. Enter the Trade
Long:
Buy at the close of the signal bar.
Stop loss: Below the recent swing low or 2 × ATR(14) below entry.
Short:
Sell/short at the close of the signal bar.
Stop loss: Above the recent swing high or 2 × ATR(14) above entry.
5. Manage the Trade
Take Profit:
Aim for a 2:1 or 3:1 risk-reward ratio (e.g., risk $0.05, target $0.10-$0.15).
Or exit when an opposite suppression signal appears (e.g., orange cross for longs).
Trailing Stop:
Move stop to breakeven after a 1:1 RR move.
Trail using the 5-day SMA or 2 × ATR(14).
Early Exit:
Exit if a suppression signal appears against your position (e.g., suppression_bull while short).
6. Filter Out Noise
Avoid trades if a suppression signal precedes a divergence within 2-3 days.
Optional: Add a 50-day SMA on the price chart:
Longs only if price > 50-SMA.
Shorts only if price < 50-SMA.
Example Trades (XRP 1D)
Bullish Trade
Signal: Green triangle (strong_bull) at $0.55.
Confirmation: Price closes above 5-SMA and $0.57 high.
Entry: Buy at $0.58.
Stop Loss: $0.53 (recent low).
Take Profit: $0.63 (2:1 RR) or exit on suppression_bear.
Outcome: Price hits $0.64, exit at $0.63 for profit.
Bearish Trade
Signal: Red triangle (strong_bear) at $0.70.
Confirmation: Price closes below 5-SMA and $0.68 low.
Entry: Short at $0.67.
Stop Loss: $0.71 (recent high).
Take Profit: $0.62 (2:1 RR) or exit on suppression_bull.
Outcome: Price drops to $0.61, exit at $0.62 for profit.
Tips for Success
Combine with Price Levels:
Use support/resistance zones (e.g., weekly pivots) to confirm entries.
Monitor Volume:
Rising volume (gray line above yellow) strengthens signals.
Adjust Sensitivity:
Too many signals? Increase div_strength_threshold to 0.7.
Too few signals? Decrease to 0.3.
Backtest:
Review 20-30 past signals on XRP 1D to assess performance.
Avoid Choppy Markets:
Skip signals during low volatility (tight price ranges).
Troubleshooting
No Signals:
Lower div_strength_threshold to 0.3 or mom_threshold_base to 0.2.
Check if XRP’s volatility is unusually low.
False Signals:
Increase sma_confirm_length to 7 or add a 50-SMA filter.
Indicator Not Loading:
Ensure the script compiles without errors.
Customization (Optional)
Change Colors: Edit color.* values (e.g., color.red to color.purple).
Add Alerts: Use TradingView’s alert menu for "Strong Bearish Divergence Confirmed," etc.
Test Other Assets: Experiment with BTC or ETH, adjusting inputs as needed.
Disclaimer
This indicator is for educational purposes only and not financial advice. Trading involves risk, and past performance does not guarantee future results. Use at your own discretion.
Setup: Use on XRP 1D with defaults (mom_length_base=8, vol_length_base=10). Signals: Red triangle (sell), Green triangle (buy), Orange cross (bear warning), Yellow cross (bull warning). Confirm with 5-day SMA cross. Stop: 2x ATR(14). Profit: 2:1 RR or suppression exit. Full guide available separately!

RSI Failure Swing Pattern (with Alerts & Targets)RSI Failure Swing Pattern Indicator – Detailed Description
Overview
The RSI Failure Swing Pattern Indicator is a trend reversal detection tool based on the principles of failure swings in the Relative Strength Index (RSI). This indicator identifies key reversal signals by analyzing RSI swings and confirming trend shifts using predefined overbought and oversold conditions.
Failure swing patterns are one of the strongest RSI-based reversal signals, initially introduced by J. Welles Wilder. This indicator detects these patterns and provides clear buy/sell signals with labeled entry, stop-loss, and profit target levels. The tool is designed to work across all timeframes and assets.
How the Indicator Works
The RSI Failure Swing Pattern consists of two key structures:
1. Bullish Failure Swing (Buy Signal)
Occurs when RSI enters oversold territory (below 30), recovers, forms a higher low above the oversold level, and finally breaks above the intermediate swing high in RSI.
Step 1: RSI dips below 30 (oversold condition).
Step 2: RSI rebounds and forms a local peak.
Step 3: RSI retraces but does not go below the previous low (higher low confirmation).
Step 4: RSI breaks above the previous peak, confirming a bullish trend reversal.
Buy signal is triggered at the breakout above the RSI peak.
2. Bearish Failure Swing (Sell Signal)
Occurs when RSI enters overbought territory (above 70), declines, forms a lower high below the overbought level, and then breaks below the intermediate swing low in RSI.
Step 1: RSI rises above 70 (overbought condition).
Step 2: RSI declines and forms a local trough.
Step 3: RSI bounces but fails to exceed the previous high (lower high confirmation).
Step 4: RSI breaks below the previous trough, confirming a bearish trend reversal.
Sell signal is triggered at the breakdown below the RSI trough.
Features of the Indicator
Custom RSI Settings: Adjustable RSI length (default 14), overbought/oversold levels.
Buy & Sell Signals: Buy/sell signals are plotted directly on the price chart.
Entry, Stop-Loss, and Profit Targets:
Entry: Price at the breakout of the RSI failure swing pattern.
Stop-Loss: Lowest low (for buy) or highest high (for sell) of the previous two bars.
Profit Targets: Two levels calculated based on Risk-Reward ratios (1:1 and 1:2 by default, customizable).
Labeled Price Levels:
Entry Price Line (Blue): Marks the point of trade entry.
Stop-Loss Line (Red): Shows the calculated stop-loss level.
Target 1 Line (Orange): Profit target at 1:1 risk-reward ratio.
Target 2 Line (Green): Profit target at 1:2 risk-reward ratio.
Alerts for Trade Execution:
Buy/Sell signals trigger alerts for real-time notifications.
Alerts fire when price reaches stop-loss or profit targets.
Works on Any Timeframe & Asset: Suitable for stocks, forex, crypto, indices, and commodities.
Why Use This Indicator?
Highly Reliable Reversal Signals: Unlike simple RSI overbought/oversold strategies, failure swings filter out false breakouts and provide strong confirmation of trend reversals.
Risk Management Built-In: Stop-loss and take-profit levels are automatically set based on historical price action and risk-reward considerations.
Easy-to-Use Visualization: Clearly marked entry, stop-loss, and profit target levels make it beginner-friendly while still being valuable for experienced traders.
How to Trade with the Indicator
Buy Trade Example (Bullish Failure Swing)
RSI drops below 30 and recovers.
RSI forms a higher low and then breaks above the previous peak.
Entry: Buy when RSI crosses above its previous peak.
Stop-Loss: Set below the lowest low of the previous two candles.
Profit Targets:
Target 1 (1:1 Risk-Reward Ratio)
Target 2 (1:2 Risk-Reward Ratio)
Sell Trade Example (Bearish Failure Swing)
RSI rises above 70 and then declines.
RSI forms a lower high and then breaks below the previous trough.
Entry: Sell when RSI crosses below its previous trough.
Stop-Loss: Set above the highest high of the previous two candles.
Profit Targets:
Target 1 (1:1 Risk-Reward Ratio)
Target 2 (1:2 Risk-Reward Ratio)
Final Thoughts
The RSI Failure Swing Pattern Indicator is a powerful tool for traders looking to identify high-probability trend reversals. By using the RSI failure swing concept along with built-in risk management tools, this indicator provides a structured approach to trading with clear entry and exit points. Whether you’re a day trader, swing trader, or long-term investor, this indicator helps in capturing momentum shifts while minimizing risk.
Would you like any modifications or additional features? 🚀

Divergence IQ [TradingIQ]Hello Traders!
Introducing "Divergence IQ"
Divergence IQ lets traders identify divergences between price action and almost ANY TradingView technical indicator. This tool is designed to help you spot potential trend reversals and continuation patterns with a range of configurable features.
Features
Divergence Detection
Detects both regular and hidden divergences for bullish and bearish setups by comparing price movements with changes in the indicator.
Offers two detection methods: one based on classic pivot point analysis and another that provides immediate divergence signals.
Option to use closing prices for divergence detection, allowing you to choose the data that best fits your strategy.
Normalization Options:
Includes multiple normalization techniques such as robust scaling, rolling Z-score, rolling min-max, or no normalization at all.
Adjustable normalization window lets you customize the indicator to suit various market conditions.
Option to display the normalized indicator on the chart for clearer visual comparison.
Allows traders to take indicators that aren't oscillators, and convert them into an oscillator - allowing for better divergence detection.
Simulated Trade Management:
Integrates simulated trade entries and exits based on divergence signals to demonstrate potential trading outcomes.
Customizable exit strategies with options for ATR-based or percentage-based stop loss and profit target settings.
Automatically calculates key trade metrics such as profit percentage, win rate, profit factor, and total trade count.
Visual Enhancements and On-Chart Displays:
Color-coded signals differentiate between bullish, bearish, hidden bullish, and hidden bearish divergence setups.
On-chart labels, lines, and gradient flow visualizations clearly mark divergence signals, entry points, and exit levels.
Configurable settings let you choose whether to display divergence signals on the price chart or in a separate pane.
Performance Metrics Table:
A performance table dynamically displays important statistics like profit, win rate, profit factor, and number of trades.
This feature offers an at-a-glance assessment of how the divergence-based strategy is performing.
The image above shows Divergence IQ successfully identifying and trading a bullish divergence between an indicator and price action!
The image above shows Divergence IQ successfully identifying and trading a bearish divergence between an indicator and price action!
The image above shows Divergence IQ successfully identifying and trading a hidden bullish divergence between an indicator and price action!
The image above shows Divergence IQ successfully identifying and trading a hidden bearish divergence between an indicator and price action!
The performance table is designed to provide a clear summary of simulated trade results based on divergence setups. You can easily review key metrics to assess the strategy’s effectiveness over different time periods.
Customization and Adaptability
Divergence IQ offers a wide range of configurable settings to tailor the indicator to your personal trading approach. You can adjust the lookback and lookahead periods for pivot detection, select your preferred method for normalization, and modify trade exit parameters to manage risk according to your strategy. The tool’s clear visual elements and comprehensive performance metrics make it a useful addition to your technical analysis toolbox.
The image above shows Divergence IQ identifying divergences between price action and OBV with no normalization technique applied.
While traders can look for divergences between OBV and price, OBV doesn't naturally behave like an oscillator, with no definable upper and lower threshold, OBV can infinitely increase or decrease.
With Divergence IQ's ability to normalize any indicator, traders can normalize non-oscillator technical indicators such as OBV, CVD, MACD, or even a moving average.
In the image above, the "Robust Scaling" normalization technique is selected. Consequently, the output of OBV has changed and is now behaving similar to an oscillator-like technical indicator. This makes spotting divergences between the indicator and price easier and more appropriate.
The three normalization techniques included will change the indicator's final output to be more compatible with divergence detection.
This feature can be used with almost any technical indicator.
Stop Type
Traders can select between ATR based profit targets and stop losses, or percentage based profit targets and stop losses.
The image above shows options for the feature.
Divergence Detection Method
A natural pitfall of divergence trading is that it generally takes several bars to "confirm" a divergence. This makes trading the divergence complicated, because the entry at time of the divergence might look great; however, the divergence wasn't actually signaled until several bars later.
To circumvent this issue, Divergence IQ offers two divergence detection mechanisms.
Pivot Detection
Pivot detection mode is the same as almost every divergence indicator on TradingView. The Pivots High Low indicator is used to detect market/indicator highs and lows and, consequently, divergences.
This method generally finds the "best looking" divergences, but will always take additional time to confirm the divergence.
Immediate Detection
Immediate detection mode attempts to reduce lag between the divergence and its confirmation to as little as possible while avoiding repainting.
Immediate detection mode still uses the Pivots Detection model to find the first high/low of a divergence. However, the most recent high/low does not utilize the Pivot Detection model, and instead immediately looks for a divergence between price and an indicator.
Immediate Detection Mode will always signal a divergence one bar after it's occurred, and traders can set alerts in this mode to be alerted as soon as the divergence occurs.
TradingView Backtester Integration
Divergence IQ is fully compatible with the TradingView backtester!
Divergence IQ isn’t designed to be a “profitable strategy” for users to trade. Instead, the intention of including the backtester is to let users backtest divergence-based trading strategies between the asset on their chart and almost any technical indicator, and to see if divergences have any predictive utility in that market.
So while the backtester is available in Divergence IQ, it’s for users to personally figure out if they should consider a divergence an actionable insight, and not a solicitation that Divergence IQ is a profitable trading strategy. Divergence IQ should be thought of as a Divergence backtesting toolkit, not a full-feature trading strategy.
Strategy Properties Used For Backtest
Initial Capital: $1000 - a realistic amount of starting capital that will resonate with many traders
Amount Per Trade: 5% of equity - a realistic amount of capital to invest relative to portfolio size
Commission: 0.02% - a conservative amount of commission to pay for trade that is standard in crypto trading, and very high for other markets.
Slippage: 1 tick - appropriate for liquid markets, but must be increased in markets with low activity.
Once more, the backtester is meant for traders to personally figure out if divergences are actionable trading signals on the market they wish to trade with the indicator they wish to use.
And that's all!
If you have any cool features you think can benefit Divergence IQ - please feel free to share them!
Thank you so much TradingView community!

Price Action Trend and Margin EquityThe Price Action Trend and Margin Equity indicator is a multifunctional market analysis tool that combines elements of money management and price pattern analysis. The indicator helps traders identify key price action patterns and determine optimal entry, exit and stop loss levels based on the current trend.
The main components of the indicator:
Money Management:
Allows the trader to set risk management parameters such as the percentage of possible loss on the position, the use of fixed leverage and the total capital.
Calculates the required leverage level to achieve a specified percentage of loss.
Price Action:
Correctly identifies various price patterns such as Pin Bar, Engulfing Bar, PPR Bar and Inside Bar.
Displays these patterns on the chart with the ability to customize candle colors and display styles.
Allows the trader to customize take profit and stop loss points to display them on the chart.
The ability to display patterns only in the direction of the trend.
Trend: (some code taken from ChartPrime)
Uses a trend cloud to visualize the current market direction.
The trend cloud is displayed on the chart and helps traders determine whether the market is in an uptrend or a downtrend.
Alert:
Allows you to set an alert that will be triggered when the pattern is formed.
Example of use:
Let's say a trader uses the indicator to trade the crypto market. He sets the money management parameters, setting the maximum loss per position to 5% and using a fixed leverage of 1:100. The indicator automatically calculates the required position size to meet these parameters ($: on the label). Or displays the leverage (X: on the label) to achieve the required risk.
The trader receives an alert when a Pin Bar is formed. The indicator displays the entry, exit, and stop loss levels based on this pattern. The trader opens a position for the recommended amount in the direction indicated by the indicator and sets the stop loss and take profit at the recommended levels.
General Settings:
Position Loss Percentage: Sets the maximum loss percentage you are willing to take on a single position.
Use Fixed Leverage: Enables or disables the use of fixed leverage.
Fixed Leverage: Sets the fixed leverage level.
Total Equity: Specifies the total equity you are using for trading. (Required for calculation when using fixed leverage)
Turn Patterns On/Off: You can turn on or off the display of various price patterns such as Pin Bar, Outside Bar (Engulfing), Inside Bar, and PPR Bar.
Pattern Colors: Sets the colors for displaying each pattern on the chart.
Candle Color: Allows you to set a neutral color for candles that do not match the price action.
Show Lines: Allows you to turn on or off the display of labels and lines.
Line Length: Sets the length of the stop, entry, and take profit lines.
Label color: One color for all labels (configured below) or the color of the labels in the color of the candle pattern.
Pin entry: Select the entry point for the pin bar: candle head, bar close, or 50% of the candle.
Coefficients for stop and take lines.
Use trend for price action: When enabled, will show price action signals only in the direction of the trend.
Display trend cloud: Enables or disables the display of the trend cloud.
Cloud calculation period: Sets the period for which the maximum and minimum values for the cloud are calculated. The longer the period, the smoother the cloud will be.
Cloud colors: Sets the colors for uptrends and downtrends, as well as the transparency of the cloud.
The logic of the indicator:
Pin Bar is a candle with a long upper or lower shadow and a short body.
Logic: If the length of one shadow is twice the body and the opposite shadow of the candle, it is considered a Pin Bar.
An Inside Bar is a candle that is completely engulfed by the previous candle.
Logic: If the high and low of the current candle are inside the previous candle, it is an Inside Bar.
An Outside Bar or Engulfing is a candle that completely engulfs the previous candle.
Logic: If the high and low of the current candle are outside the previous candle and close outside the previous candle, it is an Outside Bar.
A PPR Bar is a candle that closes above or below the previous candle.
Logic: If the current candle closes above the high of the previous candle or below its low, it is a PPR Bar.
Stop Loss Levels: Calculated based on the specified ratios. If set to 1.0, it shows the correct stop for the pattern by pushing away from the entry point.
Take Profit Levels: Calculated based on the specified ratios.
Create a Label: The label is created at the stop loss level and contains information about the potential leverage and loss.
The formula for calculating the $ value is:
=(Total Capital x (Maximum Loss Percentage on Position/100)) / (Difference between Entry Level and Stop Loss Level × Ratio that sets the stop loss level relative to the length of the candlestick shadow × Fixed Leverage Value) .
Labels contain the following information:
The percentage of price change from the recommended entry point to the stop loss level.
Required Leverage (X: ): The amount of leverage required to achieve the specified loss percentage. (Or a fixed value if selected).
Required Capital ($: ): The amount of capital required to open a position with the specified leverage and loss percentage (only displayed when using fixed leverage).
The trend cloud identifies the maximum and minimum price values for the specified period.
The cloud value is set depending on whether the current price is equal to the high or low values.
If the current closing price is equal to the high value, the cloud is set at the low value, and vice versa.
RU
Индикатор "Price Action Trend and Margin Equity" представляет собой многофункциональный инструмент для анализа рынка, объединяющий в себе элементы управления капиталом и анализа ценовых паттернов. Индикатор помогает трейдерам идентифицировать ключевые прайс экшн паттерны и определять оптимальные уровни входа, выхода и стоп-лосс на основе текущего тренда.
Основные компоненты индикатора:
Управление капиталом:
Позволяет трейдеру задавать параметры управления рисками, такие как процент возможного убытка по позиции, использование фиксированного плеча и общий капитал.
Рассчитывает необходимый уровень плеча для достижения заданного процента убытка.
Price Action:
Правильно идентифицирует различные ценовые паттерны, такие как Pin Bar, Поглащение Бар, PPR Bar и Внутренний Бар.
Отображает эти паттерны на графике с возможностью настройки цветов свечей и стилей отображения.
Позволяет трейдеру настраивать точки тейк профита и стоп лосса для отображения их на графике.
Возможность отображения паттернов только в натправлении тренда.
Trend: (часть кода взята у ChartPrime)
Использует облако тренда для визуализации текущего направления рынка.
Облако тренда отображается на графике и помогает трейдерам определить, находится ли рынок в восходящем или нисходящем тренде.
Оповещение:
Дает возможность установить оповещение которое будет срабатывать при формировании паттерна.
Пример применения:
Предположим, трейдер использует индикатор для торговли на крипто рынке. Он настраивает параметры управления капиталом, устанавливая максимальный убыток по позиции в 5% и используя фиксированное плечо 1:100. Индикатор автоматически рассчитывает необходимый объем позиции для соблюдения этих параметров ($: на лейбле). Или отображает плечо (Х: на лейбле) для достижения необходимого риска.
Трейдер получает оповещение о формировании Pin Bar. Индикатор отображает уровни входа, выхода и стоп-лосс, основанные на этом паттерне. Трейдер открывает позицию на рекомендуемую сумму в направлении, указанном индикатором, и устанавливает стоп-лосс и тейк-профит на рекомендованных уровнях.
Общие настройки:
Процент убытка по позиции: Устанавливает максимальный процент убытка, который вы готовы понести по одной позиции.
Использовать фиксированное плечо: Включает или отключает использование фиксированного плеча.
Уровень фиксированного плеча: Задает уровень фиксированного плеча.
Общий капитал: Указывает общий капитал, который вы используете для торговли. (Необходим для расчета при использовании фиксированного плеча)
Включение/отключение паттернов: Вы можете включить или отключить отображение различных ценовых паттернов, таких как Pin Bar, Outside Bar (Поглощение), Inside Bar и PPR Bar.
Цвета паттернов: Задает цвета для отображения каждого паттерна на графике.
Цвет свечей: Позволяет задать нейтральный цвет для свечей неподходящих под прйс экшн.
Показывать линии: Позволяет включить или отключить отображение лейблов и линий.
Длинна линий: Настройка длинны линий стопа, линии входа и тейк профита.
Цвет лейбла: Один цвет для всех лейблов (настраивается ниже) или цвет лейблов в цвет паттерна свечи.
Вход в пин: Выбор точки входа для пин бара: голова свечи, точка закрытия бара или 50% свечи.
Коэффиценты для стоп и тейк линий.
Использовать тренд для прайс экшна: При включении будет показывать прайс экшн сигналы только в направлении тренда.
Отображение облака тренда: Включает или отключает отображение облака тренда.
Период расчета облака: Устанавливает период, за который рассчитываются максимальные и минимальные значения для облака. Чем больше период, тем более сглаженным будет облако.
Цвета облака: Задает цвета для восходящего и нисходящего трендов, а также прозрачность облака.
Логика работы индикатора:
Pin Bar — это свеча с длинной верхней или нижней тенью и коротким телом.
Логика: Если длина одной тени вдвое больше тела и противоположной тени свечи, считается, что это Pin Bar.
Inside Bar — это свеча, полностью поглощенная предыдущей свечой.
Логика: Если максимум и минимум текущей свечи находятся внутри предыдущей свечи, это Inside Bar.
Outside Bar или Поглощение — это свеча, которая полностью поглощает предыдущую свечу.
Логика: Если максимум и минимум текущей свечи выходят за пределы предыдущей свечи и закрывается за пределами предыдущей свечи, это Outside Bar.
PPR Bar — это свеча, которая закрывается выше или ниже предыдущей свечи.
Логика: Если текущая свеча закрывается выше максимума предыдущей свечи или ниже ее минимума, это PPR Bar.
Уровни стоп-лосс: Рассчитываются на основе заданных коэффициентов. При значении 1.0 показывает правильный стоп для паттерна отталкиваясь от точки входа.
Уровки тейк-профита: Рассчитываются на основе заданных коэффициентов.
Создание метки: Метка создается на уровне стоп-лосс и содержит информацию о потенциальном плече и убытке.
Формула для вычисления значения $:
=(Общий капитал x (Максимальный процент убытка по позиции/100)) / (Разница между уровнем входа и уровнем стоп-лосс × Коэффициент, задающий уровень стоп-лосс относительно длины тени свечи × Значение фиксированного плеча).
Метки содержат следующую информацию:
Процент изменения цены от рекомендованной точки входа до уровня стоп-лосс.
Необходимое плечо (Х: ): Уровень плеча, необходимый для достижения заданного процента убытка. (Или фиксированное значение если оно выбрано).
Необходимый капитал ($: ): Сумма капитала, необходимая для открытия позиции с заданным плечом и процентом убытка (отображается только при использовании фиксированного плеча).
Облако тренда определяет максимальные и минимальные значения цены за указанный период.
Значение облака устанавливается в зависимости от того, совпадает ли текущая цена с максимальными или минимальными значениями.
Если текущая цена закрытия равна максимальному значению, облако устанавливается на уровне минимального значения, и наоборот.

Sunil BB Blast Heikin Ashi StrategySunil BB Blast Heikin Ashi Strategy
The Sunil BB Blast Heikin Ashi Strategy is a trend-following trading strategy that combines Bollinger Bands with Heikin-Ashi candles for precise market entries and exits. It aims to capitalize on price volatility while ensuring controlled risk through dynamic stop-loss and take-profit levels based on a user-defined Risk-to-Reward Ratio (RRR).
Key Features:
Trading Window:
The strategy operates within a user-defined time window (e.g., from 09:20 to 15:00) to align with market hours or other preferred trading sessions.
Trade Direction:
Users can select between Long Only, Short Only, or Long/Short trade directions, allowing flexibility depending on market conditions.
Bollinger Bands:
Bollinger Bands are used to identify potential breakout or breakdown zones. The strategy enters trades when price breaks through the upper or lower Bollinger Band, indicating a possible trend continuation.
Heikin-Ashi Candles:
Heikin-Ashi candles help smooth price action and filter out market noise. The strategy uses these candles to confirm trend direction and improve entry accuracy.
Risk Management (Risk-to-Reward Ratio):
The strategy automatically adjusts the take-profit (TP) level and stop-loss (SL) based on the selected Risk-to-Reward Ratio (RRR). This ensures that trades are risk-managed effectively.
Automated Alerts and Webhooks:
The strategy includes automated alerts for trade entries and exits. Users can set up JSON webhooks for external execution or trading automation.
Active Position Tracking:
The strategy tracks whether there is an active position (long or short) and only exits when price hits the pre-defined SL or TP levels.
Exit Conditions:
The strategy exits positions when either the take-profit (TP) or stop-loss (SL) levels are hit, ensuring risk management is adhered to.
Default Settings:
Trading Window:
09:20-15:00
This setting confines the strategy to the specified hours, ensuring trading only occurs during active market hours.
Strategy Direction:
Default: Long/Short
This allows for both long and short trades depending on market conditions. You can select "Long Only" or "Short Only" if you prefer to trade in one direction.
Bollinger Band Length (bbLength):
Default: 19
Length of the moving average used to calculate the Bollinger Bands.
Bollinger Band Multiplier (bbMultiplier):
Default: 2.0
Multiplier used to calculate the upper and lower bands. A higher multiplier increases the width of the bands, leading to fewer but more significant trades.
Take Profit Multiplier (tpMultiplier):
Default: 2.0
Multiplier used to determine the take-profit level based on the calculated stop-loss. This ensures that the profit target aligns with the selected Risk-to-Reward Ratio.
Risk-to-Reward Ratio (RRR):
Default: 1.0
The ratio used to calculate the take-profit relative to the stop-loss. A higher RRR means larger profit targets.
Trade Automation (JSON Webhooks):
Allows for integration with external systems for automated execution:
Long Entry JSON: Customizable entry condition for long positions.
Long Exit JSON: Customizable exit condition for long positions.
Short Entry JSON: Customizable entry condition for short positions.
Short Exit JSON: Customizable exit condition for short positions.
Entry Logic:
Long Entry:
The strategy enters a long position when:
The Heikin-Ashi candle shows a bullish trend (green close > open).
The price is above the upper Bollinger Band, signaling a breakout.
The previous candle also closed higher than it opened.
Short Entry:
The strategy enters a short position when:
The Heikin-Ashi candle shows a bearish trend (red close < open).
The price is below the lower Bollinger Band, signaling a breakdown.
The previous candle also closed lower than it opened.
Exit Logic:
Take-Profit (TP):
The take-profit level is calculated as a multiple of the distance between the entry price and the stop-loss level, determined by the selected Risk-to-Reward Ratio (RRR).
Stop-Loss (SL):
The stop-loss is placed at the opposite Bollinger Band level (lower for long positions, upper for short positions).
Exit Trigger:
The strategy exits a trade when either the take-profit or stop-loss level is hit.
Plotting and Visuals:
The Heikin-Ashi candles are displayed on the chart, with green candles for uptrends and red candles for downtrends.
Bollinger Bands (upper, lower, and basis) are plotted for visual reference.
Entry points for long and short trades are marked with green and red labels below and above bars, respectively.
Strategy Alerts:
Alerts are triggered when:
A long entry condition is met.
A short entry condition is met.
A trade exits (either via take-profit or stop-loss).
These alerts can be used to trigger notifications or webhook events for automated trading systems.
Notes:
The strategy is designed for use on intraday charts but can be applied to any timeframe.
It is highly customizable, allowing for tailored risk management and trading windows.
The Sunil BB Blast Heikin Ashi Strategy combines two powerful technical analysis tools (Bollinger Bands and Heikin-Ashi candles) with strong risk management, making it suitable for both beginners and experienced traders.
Feebacks are welcome from the users.

Marcel's Dynamic Profit / Loss Calculator for GoldOverview
This Dynamic Risk / Reward Tool for Gold is designed to help traders efficiently plan and manage their trades in the volatile gold market. This script provides a clear visualisation of trade levels (Entry, Stop Loss, Take Profit) while dynamically calculating potential profit and loss. It ensures gold traders can assess their positions with precision, saving time and improving risk management.
Key Features
1. Trade Level Visualisation:
Plots Entry (Blue), Stop Loss (Red), and Take Profit (Green) lines directly on the chart.
Helps you visualise and confirm trade setups quickly which is good for scalping and day trades.
2. Dynamic Risk and Reward Calculations:
Calculates potential profit and loss in real time based on user-defined inputs such as position size, leverage, and account equity.
Displays a summary panel showing risk/reward metrics directly on the chart.
3. Customisable Settings:
Allows you to adjust key parameters like account equity, position size, leverage, and specific price levels for Entry, Stop Loss, and Take Profit.
Defaults are dynamically generated for convenience but remain fully adjustable for flexibility.
How It Works
The script uses gold-specific conventions (e.g., 1 lot = 100 ounces, 1 pip = 0.01 price change) to calculate accurate risk and reward metrics.
It dynamically positions Stop Loss and Take Profit levels relative to the entry price, based on user-defined or default offsets.
A real-time summary panel is displayed in the bottom-right corner of the chart, showing:
Potential Profit: The monetary value if the Take Profit is hit.
Potential Lo
ss: The monetary value if the Stop Loss is hit.
How to Use It
1. Add the script to your chart on a gold trading pair (e.g., XAUUSD).
2. Input your:
Account equity.
Leverage.
Position size (in lots).
Desired En
try Price (default: current close price).
3. Adjust the Stop Loss and Take Profit levels to your strategy, or let the script use default offsets of:
500 pips below the Entry for Stop Loss.
1000 pips above the Entry for Take Profit.
4. Review the plotted levels and the summary panel to confirm your trade aligns with your risk/reward goals.
Why Use This Tool?
Clarity and Precision:
Provides clear trade visuals and financial metrics for confident decision-making.
Time-Saving:
Automates the calculations needed to evaluate trade risk and reward.
Improved Risk Management:
Ensures you never trade without knowing your exact potential loss and gain.
This script is particularly useful for both novice and experienced traders looking to enhance their risk management and trading discipline in the Gold market. Enjoy clearer trades at speed.

ICT Master Suite [Trading IQ]Hello Traders!
We’re excited to introduce the ICT Master Suite by TradingIQ, a new tool designed to bring together several ICT concepts and strategies in one place.
The Purpose Behind the ICT Master Suite
There are a few challenges traders often face when using ICT-related indicators:
Many available indicators focus on one or two ICT methods, which can limit traders who apply a broader range of ICT related techniques on their charts.
There aren't many indicators for ICT strategy models, and we couldn't find ICT indicators that allow for testing the strategy models and setting alerts.
Many ICT related concepts exist in the public domain as indicators, not strategies! This makes it difficult to verify that the ICT concept has some utility in the market you're trading and if it's worth trading - it's difficult to know if it's working!
Some users might not have enough chart space to apply numerous ICT related indicators, which can be restrictive for those wanting to use multiple ICT techniques simultaneously.
The ICT Master Suite is designed to offer a comprehensive option for traders who want to apply a variety of ICT methods. By combining several ICT techniques and strategy models into one indicator, it helps users maximize their chart space while accessing multiple tools in a single slot.
Additionally, the ICT Master Suite was developed as a strategy . This means users can backtest various ICT strategy models - including deep backtesting. A primary goal of this indicator is to let traders decide for themselves what markets to trade ICT concepts in and give them the capability to figure out if the strategy models are worth trading!
What Makes the ICT Master Suite Different
There are many ICT-related indicators available on TradingView, each offering valuable insights. What the ICT Master Suite aims to do is bring together a wider selection of these techniques into one tool. This includes both key ICT methods and strategy models, allowing traders to test and activate strategies all within one indicator.
Features
The ICT Master Suite offers:
Multiple ICT strategy models, including the 2022 Strategy Model and Unicorn Model, which can be built, tested, and used for live trading.
Calculation and display of key price areas like Breaker Blocks, Rejection Blocks, Order Blocks, Fair Value Gaps, Equal Levels, and more.
The ability to set alerts based on these ICT strategies and key price areas.
A comprehensive, yet practical, all-inclusive ICT indicator for traders.
Customizable Timeframe - Calculate ICT concepts on off-chart timeframes
Unicorn Strategy Model
2022 Strategy Model
Liquidity Raid Strategy Model
OTE (Optimal Trade Entry) Strategy Model
Silver Bullet Strategy Model
Order blocks
Breaker blocks
Rejection blocks
FVG
Strong highs and lows
Displacements
Liquidity sweeps
Power of 3
ICT Macros
HTF previous bar high and low
Break of Structure indications
Market Structure Shift indications
Equal highs and lows
Swings highs and swing lows
Fibonacci TPs and SLs
Swing level TPs and SLs
Previous day high and low TPs and SLs
And much more! An ongoing project!
How To Use
Many traders will already be familiar with the ICT related concepts listed above, and will find using the ICT Master Suite quite intuitive!
Despite this, let's go over the features of the tool in-depth and how to use the tool!
The image above shows the ICT Master Suite with almost all techniques activated.
ICT 2022 Strategy Model
The ICT Master suite provides the ability to test, set alerts for, and live trade the ICT 2022 Strategy Model.
The image above shows an example of a long position being entered following a complete setup for the 2022 ICT model.
A liquidity sweep occurs prior to an upside breakout. During the upside breakout the model looks for the FVG that is nearest 50% of the setup range. A limit order is placed at this FVG for entry.
The target entry percentage for the range is customizable in the settings. For instance, you can select to enter at an FVG nearest 33% of the range, 20%, 66%, etc.
The profit target for the model generally uses the highest high of the range (100%) for longs and the lowest low of the range (100%) for shorts. Stop losses are generally set at 0% of the range.
The image above shows the short model in action!
Whether you decide to follow the 2022 model diligently or not, you can still set alerts when the entry condition is met.
ICT Unicorn Model
The image above shows an example of a long position being entered following a complete setup for the ICT Unicorn model.
A lower swing low followed by a higher swing high precedes the overlap of an FVG and breaker block formed during the sequence.
During the upside breakout the model looks for an FVG and breaker block that formed during the sequence and overlap each other. A limit order is placed at the nearest overlap point to current price.
The profit target for this example trade is set at the swing high and the stop loss at the swing low. However, both the profit target and stop loss for this model are configurable in the settings.
For Longs, the selectable profit targets are:
Swing High
Fib -0.5
Fib -1
Fib -2
For Longs, the selectable stop losses are:
Swing Low
Bottom of FVG or breaker block
The image above shows the short version of the Unicorn Model in action!
For Shorts, the selectable profit targets are:
Swing Low
Fib -0.5
Fib -1
Fib -2
For Shorts, the selectable stop losses are:
Swing High
Top of FVG or breaker block
The image above shows the profit target and stop loss options in the settings for the Unicorn Model.
Optimal Trade Entry (OTE) Model
The image above shows an example of a long position being entered following a complete setup for the OTE model.
Price retraces either 0.62, 0.705, or 0.79 of an upside move and a trade is entered.
The profit target for this example trade is set at the -0.5 fib level. This is also adjustable in the settings.
For Longs, the selectable profit targets are:
Swing High
Fib -0.5
Fib -1
Fib -2
The image above shows the short version of the OTE Model in action!
For Shorts, the selectable profit targets are:
Swing Low
Fib -0.5
Fib -1
Fib -2
Liquidity Raid Model
The image above shows an example of a long position being entered following a complete setup for the Liquidity Raid Modell.
The user must define the session in the settings (for this example it is 13:30-16:00 NY time).
During the session, the indicator will calculate the session high and session low. Following a “raid” of either the session high or session low (after the session has completed) the script will look for an entry at a recently formed breaker block.
If the session high is raided the script will look for short entries at a bearish breaker block. If the session low is raided the script will look for long entries at a bullish breaker block.
For Longs, the profit target options are:
Swing high
User inputted Lib level
For Longs, the stop loss options are:
Swing low
User inputted Lib level
Breaker block bottom
The image above shows the short version of the Liquidity Raid Model in action!
For Shorts, the profit target options are:
Swing Low
User inputted Lib level
For Shorts, the stop loss options are:
Swing High
User inputted Lib level
Breaker block top
Silver Bullet Model
The image above shows an example of a long position being entered following a complete setup for the Silver Bullet Modell.
During the session, the indicator will determine the higher timeframe bias. If the higher timeframe bias is bullish the strategy will look to enter long at an FVG that forms during the session. If the higher timeframe bias is bearish the indicator will look to enter short at an FVG that forms during the session.
For Longs, the profit target options are:
Nearest Swing High Above Entry
Previous Day High
For Longs, the stop loss options are:
Nearest Swing Low
Previous Day Low
The image above shows the short version of the Silver Bullet Model in action!
For Shorts, the profit target options are:
Nearest Swing Low Below Entry
Previous Day Low
For Shorts, the stop loss options are:
Nearest Swing High
Previous Day High
Order blocks
The image above shows indicator identifying and labeling order blocks.
The color of the order blocks, and how many should be shown, are configurable in the settings!
Breaker Blocks
The image above shows indicator identifying and labeling order blocks.
The color of the breaker blocks, and how many should be shown, are configurable in the settings!
Rejection Blocks
The image above shows indicator identifying and labeling rejection blocks.
The color of the rejection blocks, and how many should be shown, are configurable in the settings!
Fair Value Gaps
The image above shows indicator identifying and labeling fair value gaps.
The color of the fair value gaps, and how many should be shown, are configurable in the settings!
Additionally, you can select to only show fair values gaps that form after a liquidity sweep. Doing so reduces "noisy" FVGs and focuses on identifying FVGs that form after a significant trading event.
The image above shows the feature enabled. A fair value gap that occurred after a liquidity sweep is shown.
Market Structure
The image above shows the ICT Master Suite calculating market structure shots and break of structures!
The color of MSS and BoS, and whether they should be displayed, are configurable in the settings.
Displacements
The images above show indicator identifying and labeling displacements.
The color of the displacements, and how many should be shown, are configurable in the settings!
Equal Price Points
The image above shows the indicator identifying and labeling equal highs and equal lows.
The color of the equal levels, and how many should be shown, are configurable in the settings!
Previous Custom TF High/Low
The image above shows the ICT Master Suite calculating the high and low price for a user-defined timeframe. In this case the previous day’s high and low are calculated.
To illustrate the customizable timeframe function, the image above shows the indicator calculating the previous 4 hour high and low.
Liquidity Sweeps
The image above shows the indicator identifying a liquidity sweep prior to an upside breakout.
The image above shows the indicator identifying a liquidity sweep prior to a downside breakout.
The color and aggressiveness of liquidity sweep identification are adjustable in the settings!
Power Of Three
The image above shows the indicator calculating Po3 for two user-defined higher timeframes!
Macros
The image above shows the ICT Master Suite identifying the ICT macros!
ICT Macros are only displayable on the 5 minute timeframe or less.
Strategy Performance Table
In addition to a full-fledged TradingView backtest for any of the ICT strategy models the indicator offers, a quick-and-easy strategy table exists for the indicator!
The image above shows the strategy performance table in action.
Keep in mind that, because the ICT Master Suite is a strategy script, you can perform fully automatic backtests, deep backtests, easily add commission and portfolio balance and look at pertinent metrics for the ICT strategies you are testing!
Lite Mode
Traders who want the cleanest chart possible can toggle on “Lite Mode”!
In Lite Mode, any neon or “glow” like effects are removed and key levels are marked as strict border boxes. You can also select to remove box borders if that’s what you prefer!
Settings Used For Backtest
For the displayed backtest, a starting balance of $1000 USD was used. A commission of 0.02%, slippage of 2 ticks, a verify price for limit orders of 2 ticks, and 5% of capital investment per order.
A commission of 0.02% was used due to the backtested asset being a perpetual future contract for a crypto currency. The highest commission (lowest-tier VIP) for maker orders on many exchanges is 0.02%. All entered positions take place as maker orders and so do profit target exits. Stop orders exist as stop-market orders.
A slippage of 2 ticks was used to simulate more realistic stop-market orders. A verify limit order settings of 2 ticks was also used. Even though BTCUSDT.P on Binance is liquid, we just want the backtest to be on the safe side. Additionally, the backtest traded 100+ trades over the period. The higher the sample size the better; however, this example test can serve as a starting point for traders interested in ICT concepts.
Community Assistance And Feedback
Given the complexity and idiosyncratic applications of ICT concepts amongst its proponents, the ICT Master Suite’s built-in strategies and level identification methods might not align with everyone's interpretation.
That said, the best we can do is precisely define ICT strategy rules and concepts to a repeatable process, test, and apply them! Whether or not an ICT strategy is trading precisely how you would trade it, seeing the model in action, taking trades, and with performance statistics is immensely helpful in assessing predictive utility.
If you think we missed something, you notice a bug, have an idea for strategy model improvement, please let us know! The ICT Master Suite is an ongoing project that will, ideally, be shaped by the community.
A big thank you to the @PineCoders for their Time Library!
Thank you!

CPR by NKDCentral Pivot Range (CPR) Trading Strategy:
The Central Pivot Range (CPR) is a widely-used tool in technical analysis, helping traders pinpoint potential support and resistance levels in the market. By using the CPR effectively, traders can better gauge market trends and determine favorable entry and exit points. This guide explores how the CPR works, outlines its calculation, and describes how traders can enhance their strategies using an extended 10-line version of CPR.
What Really Central Pivot Range (CPR) is?
At its core, the CPR consists of three key lines:
Pivot Point (PP) – The central line, calculated as the average of the previous day’s high, low, and closing prices.
Upper Range (R1) – Positioned above the Pivot Point, acting as a potential ceiling where price may face resistance.
Lower Range (S1) – Found below the Pivot Point, serving as a potential floor where price might find support.
Advanced traders often expand on the traditional three-line CPR by adding extra levels above and below the pivot, creating up to a 10-line system. This extended CPR allows for a more nuanced understanding of the market and helps identify more detailed trading opportunities.
Applying CPR for Trading Success
1. How CPR is Calculation
The CPR relies on the previous day's high (H), low (L), and close (C) prices to create its structure:
Pivot Point (PP) = (H + L + C) / 3
First Resistance (R1) = (2 * PP) - L
First Support (S1) = (2 * PP) - H
Additional resistance levels (R2, R3) and support levels (S2, S3) are calculated by adding or subtracting multiples of the previous day’s price range (H - L) from the Pivot Point.
2. Recognizing the Market Trend
To effectively trade using CPR, it’s essential to first determine whether the market is trending up (bullish) or down (bearish). In an upward-trending market, traders focus on buying at support levels, while in a downward market, they look to sell near resistance.
3. Finding Ideal Entry Points
Traders often look to enter trades when price approaches key levels within the CPR range. Support levels (S1, S2) offer buying opportunities, while resistance levels (R1, R2) provide selling opportunities. These points are considered potential reversal zones, where price may bounce or reverse direction.
4. Managing Risk with Stop-Loss Orders
Proper risk management is crucial in any trading strategy. A stop-loss should be set slightly beyond the support level for buy positions and above the resistance level for sell positions, ensuring that losses are contained if the market moves against the trader’s position.
5. Determining Profit Targets
Profit targets are typically set based on the distance between entry points and the next support or resistance level. Many traders apply a risk-reward ratio, aiming for larger potential profits compared to the potential losses. However, if the next resistance and support level is far then middle levels are used for targets (i.e. 50% of R1 and R2)
6. Confirmation Through Other Indicators
While CPR provides strong support and resistance levels, traders often use additional indicators to confirm potential trade setups. Indicators such as moving averages can
help validate the signals provided by the CPR.
7. Monitoring Price Action At CPR Levels
Constantly monitoring price movement near CPR levels is essential. If the price fails to break through a resistance level (R1) or holds firm at support (S1), it can offer cues on when to exit or adjust a trade. However, a strong price break past these levels often signals a continued trend.
8. Trading Breakouts with CPR
When the price breaks above resistance or below support with strong momentum, it may signal a potential breakout. Traders can capitalize on these movements by entering positions in the direction of the breakout, ideally confirmed by volume or other technical indicators.
9. Adapting to Changing Market Conditions
CPR should be used in the context of broader market influences, such as economic reports, news events, or geopolitical shifts. These factors can dramatically affect market direction and how price reacts to CPR levels, making it important to stay informed about external market conditions.
10. Practice and Backtesting for Improvements
Like any trading tool, the CPR requires practice. Traders are encouraged to backtest their strategies on historical price data to get a better sense of how CPR works in different market environments. Continuous analysis and practice help improve decision-making and strategy refinement.
The Advantages of Using a 10-Line CPR System
An extended 10-line CPR system—comprising up to five resistance and five support levels—provides more granular control and insight into market movements. This expanded view helps traders better gauge trends and identify more opportunities for entry and exit. Key benefits include:
R2, S2 Levels: These act as secondary resistance or support zones, giving traders additional opportunities to refine their trade entries and exits.
R3, S3 Levels: Provide an even wider range for identifying reversals or trend continuations in more volatile markets.
Flexibility: The broader range of levels allows traders to adapt to changing market conditions and make more precise decisions based on market momentum.
So in Essential:
The Central Pivot Range is a valuable tool for traders looking to identify critical price levels in the market. By providing a clear framework for identifying potential support and resistance zones, it helps traders make informed decisions about entering and exiting trades. However, it’s important to combine CPR with sound risk management and additional confirmation through other technical indicators for the best results.
Although no trading tool guarantees success, the CPR, when used effectively and combined with practice, can significantly enhance a trader’s ability to navigate market fluctuations.

Unlock the Power of Seasonality: Monthly Performance StrategyThe Monthly Performance Strategy leverages the power of seasonality—those cyclical patterns that emerge in financial markets at specific times of the year. From tax deadlines to industry-specific events and global holidays, historical data shows that certain months can offer strong opportunities for trading. This strategy was designed to help traders capture those opportunities and take advantage of recurring market patterns through an automated and highly customizable approach.
The Inspiration Behind the Strategy:
This strategy began with the idea that market performance is often influenced by seasonal factors. Historically, certain months outperform others due to a variety of reasons, like earnings reports, holiday shopping, or fiscal year-end events. By identifying these periods, traders can better time their market entries and exits, giving them an advantage over those who solely rely on technical indicators or news events.
The Monthly Performance Strategy was built to take this concept and automate it. Instead of manually analyzing market data for each month, this strategy enables you to select which months you want to focus on and then executes trades based on predefined rules, saving you time and optimizing the performance of your trades.
Key Features:
Customizable Month Selection: The strategy allows traders to choose specific months to test or trade on. You can select any combination of months—for example, January, July, and December—to focus on based on historical trends. Whether you’re targeting the historically strong months like December (often driven by the 'Santa Rally') or analyzing quieter months for low volatility trades, this strategy gives you full control.
Automated Monthly Entries and Exits: The strategy automatically enters a long position on the first day of your selected month(s) and exits the trade at the beginning of the next month. This makes it perfect for traders who want to benefit from seasonal patterns without manually monitoring the market. It ensures precision in entering and exiting trades based on pre-set timeframes.
Re-entry on Stop Loss or Take Profit: One of the standout features of this strategy is its ability to re-enter a trade if a position hits the stop loss (SL) or take profit (TP) level during the selected month. If your trade reaches either a SL or TP before the month ends, the strategy will automatically re-enter a new trade the next trading day. This feature ensures that you capture multiple trading opportunities within the same month, instead of exiting entirely after a successful or unsuccessful trade. Essentially, it keeps your capital working for you throughout the entire month, not just when conditions align perfectly at the beginning.
Built-in Risk Management: Risk management is a vital part of this strategy. It incorporates an Average True Range (ATR)-based stop loss and take profit system. The ATR helps set dynamic levels based on the market’s volatility, ensuring that your stops and targets adjust to changing market conditions. This not only helps limit potential losses but also maximizes profit potential by adapting to market behavior.
Historical Performance Testing: You can backtest this strategy on any period by setting the start year. This allows traders to analyze past market data and optimize their strategy based on historical performance. You can fine-tune which months to trade based on years of data, helping you identify trends and patterns that provide the best trading results.
Versatility Across Asset Classes: While this strategy can be particularly effective for stock market indices and sector rotation, it’s versatile enough to apply to other asset classes like forex, commodities, and even cryptocurrencies. Each asset class may exhibit different seasonal behaviors, allowing you to explore opportunities across various markets with this strategy.
How It Works:
The trader selects which months to test or trade, for example, January, April, and October.
The strategy will automatically open a long position on the first trading day of each selected month.
If the trade hits either the take profit or stop loss within the month, the strategy will close the current position and re-enter a new trade on the next trading day, provided the month has not yet ended. This ensures that the strategy continues to capture any potential gains throughout the month, rather than stopping after one successful trade.
At the start of the next month, the position is closed, and if the next month is also selected, a new trade is initiated following the same process.
Risk Management and Dynamic Adjustments:
Incorporating risk management with this strategy is as easy as turning on the ATR-based system. The strategy will automatically calculate stop loss and take profit levels based on the market’s current volatility, adjusting dynamically to the conditions. This ensures that the risk is controlled while allowing for flexibility in capturing profits during both high and low volatility periods.
Maximizing the Seasonal Edge:
By automating entries and exits based on specific months and combining that with dynamic risk management, the Ultimate Monthly Performance Strategy takes advantage of seasonal patterns without requiring constant monitoring. The added re-entry feature after hitting a stop loss or take profit ensures that you are always in the game, maximizing your chances to capture profitable trades during favorable seasonal periods.
Who Can Benefit from This Strategy?
This strategy is perfect for traders who:
Want to exploit the predictable, recurring patterns that occur during specific months of the year.
Prefer a hands-off, automated trading approach that allows them to focus on other aspects of their portfolio or life.
Seek to manage risk effectively with ATR-based stop losses and take profits that adjust to market conditions.
Appreciate the ability to re-enter trades when a take profit or stop loss is hit within the month, ensuring that they don't miss out on multiple opportunities during a favorable period.
In summary, the Ultimate Monthly Performance Strategy provides traders with a comprehensive tool to capitalize on seasonal trends, optimize their trading opportunities throughout the year, and manage risk effectively. The built-in re-entry system ensures you continue to benefit from the market even after hitting targets within the same month, making it a robust strategy for traders looking to maximize their edge in any market.
Risk Disclaimer:
Trading financial markets involves significant risk and may not be suitable for all investors. The Monthly Performance Strategy is designed to help traders identify seasonal trends, but past performance does not guarantee future results. It is important to carefully consider your risk tolerance, financial situation, and trading goals before using any strategy. Always use appropriate risk management and consult with a professional financial advisor if necessary. The use of this strategy does not eliminate the risk of losses, and traders should be prepared for the possibility of losing their entire investment. Be sure to test the strategy on a demo account before applying it in live markets.

Mean Reversion Cloud (Ornstein-Uhlenbeck) // AlgoFyreThe Mean Reversion Cloud (Ornstein-Uhlenbeck) indicator detects mean-reversion opportunities by applying the Ornstein-Uhlenbeck process. It calculates a dynamic mean using an Exponential Weighted Moving Average, surrounded by volatility bands, signaling potential buy/sell points when prices deviate.
TABLE OF CONTENTS
🔶 ORIGINALITY
🔸Adaptive Mean Calculation
🔸Volatility-Based Cloud
🔸Speed of Reversion (θ)
🔶 FUNCTIONALITY
🔸Dynamic Mean and Volatility Bands
🞘 How it works
🞘 How to calculate
🞘 Code extract
🔸Visualization via Table and Plotshapes
🞘 Table Overview
🞘 Plotshapes Explanation
🞘 Code extract
🔶 INSTRUCTIONS
🔸Step-by-Step Guidelines
🞘 Setting Up the Indicator
🞘 Understanding What to Look For on the Chart
🞘 Possible Entry Signals
🞘 Possible Take Profit Strategies
🞘 Possible Stop-Loss Levels
🞘 Additional Tips
🔸Customize settings
🔶 CONCLUSION
▅▅▅▅▅▅▅▅▅▅▅▅▅▅▅▅▅▅▅▅▅▅▅▅▅▅▅▅▅▅▅▅▅▅▅▅▅▅▅▅▅▅▅▅▅▅
🔶 ORIGINALITY The Mean Reversion Cloud (Ornstein-Uhlenbeck) is a unique indicator that applies the Ornstein-Uhlenbeck stochastic process to identify mean-reverting behavior in asset prices. Unlike traditional moving average-based indicators, this model uses an Exponentially Weighted Moving Average (EWMA) to calculate the long-term mean, dynamically adjusting to recent price movements while still considering all historical data. It also incorporates volatility bands, providing a "cloud" that visually highlights overbought or oversold conditions. By calculating the speed of mean reversion (θ) through the autocorrelation of log returns, this indicator offers traders a more nuanced and mathematically robust tool for identifying mean-reversion opportunities. These innovations make it especially useful for markets that exhibit range-bound characteristics, offering timely buy and sell signals based on statistical deviations from the mean.
🔸Adaptive Mean Calculation Traditional MA indicators use fixed lengths, which can lead to lagging signals or over-sensitivity in volatile markets. The Mean Reversion Cloud uses an Exponentially Weighted Moving Average (EWMA), which adapts to price movements by dynamically adjusting its calculation, offering a more responsive mean.
🔸Volatility-Based Cloud Unlike simple moving averages that only plot a single line, the Mean Reversion Cloud surrounds the dynamic mean with volatility bands. These bands, based on standard deviations, provide traders with a visual cue of when prices are statistically likely to revert, highlighting potential reversal zones.
🔸Speed of Reversion (θ) The indicator goes beyond price averages by calculating the speed at which the price reverts to the mean (θ), using the autocorrelation of log returns. This gives traders an additional tool for estimating the likelihood and timing of mean reversion, making the signals more reliable in practice.
🔶 FUNCTIONALITY The Mean Reversion Cloud (Ornstein-Uhlenbeck) indicator is designed to detect potential mean-reversion opportunities in asset prices by applying the Ornstein-Uhlenbeck stochastic process. It calculates a dynamic mean through the Exponentially Weighted Moving Average (EWMA) and plots volatility bands based on the standard deviation of the asset's price over a specified period. These bands create a "cloud" that represents expected price fluctuations, helping traders to identify overbought or oversold conditions. By calculating the speed of reversion (θ) from the autocorrelation of log returns, the indicator offers a more refined way of assessing how quickly prices may revert to the mean. Additionally, the inclusion of volatility provides a comprehensive view of market conditions, allowing for more accurate buy and sell signals.
Let's dive into the details:
🔸Dynamic Mean and Volatility Bands The dynamic mean (μ) is calculated using the EWMA, giving more weight to recent prices but considering all historical data. This process closely resembles the Ornstein-Uhlenbeck (OU) process, which models the tendency of a stochastic variable (such as price) to revert to its mean over time. Volatility bands are plotted around the mean using standard deviation, forming the "cloud" that signals overbought or oversold conditions. The cloud adapts dynamically to price fluctuations and market volatility, making it a versatile tool for mean-reversion strategies. 🞘 How it works Step one: Calculate the dynamic mean (μ) The Ornstein-Uhlenbeck process describes how a variable, such as an asset's price, tends to revert to a long-term mean while subject to random fluctuations. In this indicator, the EWMA is used to compute the dynamic mean (μ), mimicking the mean-reverting behavior of the OU process. Use the EWMA formula to compute a weighted mean that adjusts to recent price movements. Assign exponentially decreasing weights to older data while giving more emphasis to current prices. Step two: Plot volatility bands Calculate the standard deviation of the price over a user-defined period to determine market volatility. Position the upper and lower bands around the mean by adding and subtracting a multiple of the standard deviation. 🞘 How to calculate Exponential Weighted Moving Average (EWMA)
The EWMA dynamically adjusts to recent price movements:
mu_t = lambda * mu_{t-1} + (1 - lambda) * P_t
Where mu_t is the mean at time t, lambda is the decay factor, and P_t is the price at time t. The higher the decay factor, the more weight is given to recent data.
Autocorrelation (ρ) and Standard Deviation (σ)
To measure mean reversion speed and volatility: rho = correlation(log(close), log(close ), length) Where rho is the autocorrelation of log returns over a specified period.
To calculate volatility:
sigma = stdev(close, length)
Where sigma is the standard deviation of the asset's closing price over a specified length.
Upper and Lower Bands
The upper and lower bands are calculated as follows:
upper_band = mu + (threshold * sigma)
lower_band = mu - (threshold * sigma)
Where threshold is a multiplier for the standard deviation, usually set to 2. These bands represent the range within which the price is expected to fluctuate, based on current volatility and the mean.
🞘 Code extract // Calculate Returns
returns = math.log(close / close )
// Calculate Long-Term Mean (μ) using EWMA over the entire dataset
var float ewma_mu = na // Initialize ewma_mu as 'na'
ewma_mu := na(ewma_mu ) ? close : decay_factor * ewma_mu + (1 - decay_factor) * close
mu = ewma_mu
// Calculate Autocorrelation at Lag 1
rho1 = ta.correlation(returns, returns , corr_length)
// Ensure rho1 is within valid range to avoid errors
rho1 := na(rho1) or rho1 <= 0 ? 0.0001 : rho1
// Calculate Speed of Mean Reversion (θ)
theta = -math.log(rho1)
// Calculate Volatility (σ)
sigma = ta.stdev(close, corr_length)
// Calculate Upper and Lower Bands
upper_band = mu + threshold * sigma
lower_band = mu - threshold * sigma
🔸Visualization via Table and Plotshapes
The table shows key statistics such as the current value of the dynamic mean (μ), the number of times the price has crossed the upper or lower bands, and the consecutive number of bars that the price has remained in an overbought or oversold state.
Plotshapes (diamonds) are used to signal buy and sell opportunities. A green diamond below the price suggests a buy signal when the price crosses below the lower band, and a red diamond above the price indicates a sell signal when the price crosses above the upper band.
The table and plotshapes provide a comprehensive visualization, combining both statistical and actionable information to aid decision-making.
🞘 Code extract // Reset consecutive_bars when price crosses the mean
var consecutive_bars = 0
if (close < mu and close >= mu) or (close > mu and close <= mu)
consecutive_bars := 0
else if math.abs(deviation) > 0
consecutive_bars := math.min(consecutive_bars + 1, dev_length)
transparency = math.max(0, math.min(100, 100 - (consecutive_bars * 100 / dev_length)))
🔶 INSTRUCTIONS
The Mean Reversion Cloud (Ornstein-Uhlenbeck) indicator can be set up by adding it to your TradingView chart and configuring parameters such as the decay factor, autocorrelation length, and volatility threshold to suit current market conditions. Look for price crossovers and deviations from the calculated mean for potential entry signals. Use the upper and lower bands as dynamic support/resistance levels for setting take profit and stop-loss orders. Combining this indicator with additional trend-following or momentum-based indicators can improve signal accuracy. Adjust settings for better mean-reversion detection and risk management.
🔸Step-by-Step Guidelines
🞘 Setting Up the Indicator
Adding the Indicator to the Chart:
Go to your TradingView chart.
Click on the "Indicators" button at the top.
Search for "Mean Reversion Cloud (Ornstein-Uhlenbeck)" in the indicators list.
Click on the indicator to add it to your chart.
Configuring the Indicator:
Open the indicator settings by clicking on the gear icon next to its name on the chart.
Decay Factor: Adjust the decay factor (λ) to control the responsiveness of the mean calculation. A higher value prioritizes recent data.
Autocorrelation Length: Set the autocorrelation length (θ) for calculating the speed of mean reversion. Longer lengths consider more historical data.
Threshold: Define the number of standard deviations for the upper and lower bands to determine how far price must deviate to trigger a signal.
Chart Setup:
Select the appropriate timeframe (e.g., 1-hour, daily) based on your trading strategy.
Consider using other indicators such as RSI or MACD to confirm buy and sell signals.
🞘 Understanding What to Look For on the Chart
Indicator Behavior:
Observe how the price interacts with the dynamic mean and volatility bands. The price staying within the bands suggests mean-reverting behavior, while crossing the bands signals potential entry points.
The indicator calculates overbought/oversold conditions based on deviation from the mean, highlighted by color-coded cloud areas on the chart.
Crossovers and Deviation:
Look for crossovers between the price and the mean (μ) or the bands. A bullish crossover occurs when the price crosses below the lower band, signaling a potential buying opportunity.
A bearish crossover occurs when the price crosses above the upper band, suggesting a potential sell signal.
Deviations from the mean indicate market extremes. A large deviation indicates that the price is far from the mean, suggesting a potential reversal.
Slope and Direction:
Pay attention to the slope of the mean (μ). A rising slope suggests bullish market conditions, while a declining slope signals a bearish market.
The steepness of the slope can indicate the strength of the mean-reversion trend.
🞘 Possible Entry Signals
Bullish Entry:
Crossover Entry: Enter a long position when the price crosses below the lower band with a positive deviation from the mean.
Confirmation Entry: Use additional indicators like RSI (above 50) or increasing volume to confirm the bullish signal.
Bearish Entry:
Crossover Entry: Enter a short position when the price crosses above the upper band with a negative deviation from the mean.
Confirmation Entry: Look for RSI (below 50) or decreasing volume to confirm the bearish signal.
Deviation Confirmation:
Enter trades when the deviation from the mean is significant, indicating that the price has strayed far from its expected value and is likely to revert.
🞘 Possible Take Profit Strategies
Static Take Profit Levels:
Set predefined take profit levels based on historical volatility, using the upper and lower bands as guides.
Place take profit orders near recent support/resistance levels, ensuring you're capitalizing on the mean-reversion behavior.
Trailing Stop Loss:
Use a trailing stop based on a percentage of the price deviation from the mean to lock in profits as the trend progresses.
Adjust the trailing stop dynamically along the calculated bands to protect profits as the price returns to the mean.
Deviation-Based Exits:
Exit when the deviation from the mean starts to decrease, signaling that the price is returning to its equilibrium.
🞘 Possible Stop-Loss Levels
Initial Stop Loss:
Place an initial stop loss outside the lower band (for long positions) or above the upper band (for short positions) to protect against excessive deviations.
Use a volatility-based buffer to avoid getting stopped out during normal price fluctuations.
Dynamic Stop Loss:
Move the stop loss closer to the mean as the price converges back towards equilibrium, reducing risk.
Adjust the stop loss dynamically along the bands to account for sudden market movements.
🞘 Additional Tips
Combine with Other Indicators:
Enhance your strategy by combining the Mean Reversion Cloud with momentum indicators like MACD, RSI, or Bollinger Bands to confirm market conditions.
Backtesting and Practice:
Backtest the indicator on historical data to understand how it performs in various market environments.
Practice using the indicator on a demo account before implementing it in live trading.
Market Awareness:
Keep an eye on market news and events that might cause extreme price movements. The indicator reacts to price data and might not account for news-driven events that can cause large deviations.
🔸Customize settings 🞘 Decay Factor (λ): Defines the weight assigned to recent price data in the calculation of the mean. A value closer to 1 places more emphasis on recent prices, while lower values create a smoother, more lagging mean.
🞘 Autocorrelation Length (θ): Sets the period for calculating the speed of mean reversion and volatility. Longer lengths capture more historical data, providing smoother calculations, while shorter lengths make the indicator more responsive.
🞘 Threshold (σ): Specifies the number of standard deviations used to create the upper and lower bands. Higher thresholds widen the bands, producing fewer signals, while lower thresholds tighten the bands for more frequent signals.
🞘 Max Gradient Length (γ): Determines the maximum number of consecutive bars for calculating the deviation gradient. This setting impacts the transparency of the plotted bands based on the length of deviation from the mean.
🔶 CONCLUSION
The Mean Reversion Cloud (Ornstein-Uhlenbeck) indicator offers a sophisticated approach to identifying mean-reversion opportunities by applying the Ornstein-Uhlenbeck stochastic process. This dynamic indicator calculates a responsive mean using an Exponentially Weighted Moving Average (EWMA) and plots volatility-based bands to highlight overbought and oversold conditions. By incorporating advanced statistical measures like autocorrelation and standard deviation, traders can better assess market extremes and potential reversals. The indicator’s ability to adapt to price behavior makes it a versatile tool for traders focused on both short-term price deviations and longer-term mean-reversion strategies. With its unique blend of statistical rigor and visual clarity, the Mean Reversion Cloud provides an invaluable tool for understanding and capitalizing on market inefficiencies.

Market Structure Break Targets [UAlgo]The "Market Structure Break Targets " indicator is designed to identify and visualize key market structure points such as Market Structure Breaks (MSBs) and Break of Structures (BoS). These points are crucial for understanding market trends and potential reversal zones. By plotting these structures on the chart, traders can easily spot significant support and resistance levels, as well as potential entry and exit points.
This indicator uses a combination of swing highs and lows to determine market structures and calculates targets based on user-defined percentages or Average True Range (ATR) multipliers. It provides visual cues in the form of lines, labels, and boxes to help traders quickly interpret market conditions.
🔶 Key Features
Customizable Swing Length: Users can set the swing length to identify the pivot highs and lows, which are crucial for determining market structure.
Target Duration Bars: Defines the maximum duration (in bars) for which the targets will be considered valid.
Target Calculation Methods: The target levels are crucial for setting potential price objectives. The calculation can be based on a percentage move from the identified pivot or using the ATR to factor in market volatility. These targets help in setting realistic profit-taking levels or identifying stop-loss placements.
Bullish and Bearish Market Structure Break (MSB): Detects and highlights bullish and bearish market structure breaks with customizable colors and target percentages.
Bullish MSB
When the price closes above a significant pivot high, a bullish MSB is identified. The indicator will draw a line at this level and calculate a target based on the chosen method (percentage or ATR). The target is visualized with a dotted line, and a label "MSB" is displayed. Additionally, an order block is created at the level of the bullish MSB. This order block is highlighted with a semi-transparent box, representing a potential area where price might find support in the future.
Bearish MSB
Conversely, when the price closes below a significant pivot low, a bearish MSB is marked. Similar to bullish MSBs, targets are calculated and displayed on the chart. An order block is also generated at the level of the bearish MSB, visualized with a semi-transparent box. This box highlights a potential resistance area where price might face selling pressure.
Bullish and Bearish Break of Structure (BoS): Identifies break of structures for both bullish and bearish scenarios, providing additional target levels.
Bullish BoS
If the price continues to rise and breaks another significant level, a bullish BoS is detected. This break is also marked with lines and labels, providing additional target levels for traders. An order block is created at the BoS level, serving as a potential support zone.
Bearish BoS
If the price falls further after a bearish MSB, a bearish BoS is identified and visualized similarly. The indicator creates an order block at the BoS level, which acts as a potential resistance zone.
🔶 Disclaimer:
Use with Caution: This indicator is provided for educational and informational purposes only and should not be considered as financial advice. Users should exercise caution and perform their own analysis before making trading decisions based on the indicator's signals.
Not Financial Advice: The information provided by this indicator does not constitute financial advice, and the creator (UAlgo) shall not be held responsible for any trading losses incurred as a result of using this indicator.
Backtesting Recommended: Traders are encouraged to backtest the indicator thoroughly on historical data before using it in live trading to assess its performance and suitability for their trading strategies.
Risk Management: Trading involves inherent risks, and users should implement proper risk management strategies, including but not limited to stop-loss orders and position sizing, to mitigate potential losses.
No Guarantees: The accuracy and reliability of the indicator's signals cannot be guaranteed, as they are based on historical price data and past performance may not be indicative of future results.

BB Position CalculatorPosition Size Calculator Instructions
Overview
The Position Size Calculator is designed to help traders automatically determine the appropriate lot size based on the dollar amount they are willing to risk. It includes features for automatic lot sizing, fixed lot risk calculations, take profit calculations (both automatic and fixed), max run-up, and max drawdown. Calculated values are displayed in ticks, points, and USD.
Key Features
• Automatic Lot Sizing: Automatically calculates lot size based on the amount of money you are willing to risk.
• Fixed Lot Risk Calculations: Provides risk calculations for fixed lot sizes.
• Take Profit Calculations: Offers both automatic and fixed take profit calculations.
• Max Run-Up and Max Drawdown: Monitors and displays the maximum run-up and drawdown of your trade.
• Detailed Metrics: Displays all calculated values in ticks, points, and USD.
Setup Instructions
1. Add and Remove for Each Position: The calculator is designed to be added to your chart for each new position. Once your preferences are set the first time, save them as your default to retain your settings for future use.
2. Adding the Indicator to Favorites:
• Use the TradingView keyboard shortcut “/” then type “pos.”
• Use the arrow key to select the Position Size Calculator and press enter.
• Close the indicator selection pop-up.
3. Setting the Trigger Price:
• A blue pop-up labeled “SET TRIGGER PRICE” will appear at the bottom of the chart.
• Click on the chart at the price level where you want to enter the trade.
4. Setting the Stop Loss:
• The pop-up will change to “SET STOP LOSS.”
• Click on the chart at the price level where your stop loss will be set.
5. Setting the Take Profit:
• The pop-up will change to “SET TAKE PROFIT.”
• Click on the chart at the price level where you want to take profit. If you have selected the option to overwrite with a set risk/reward ratio (R:R), the calculation will use this price level.
6. Setting the Trade Window Start:
• The pop-up will change to “SET TRADE WINDOW START.”
• Click on the bar in time where you want the indicator to start monitoring for price to trigger the position.
7. Adjusting the Position:
• Clicking on any part of the indicator will display draggable lines, allowing you to fine-tune the position that was previously plotted by the first four chart clicks.
Additional Notes
• Compatibility: This calculator has only been tested with futures trading.
• Customization: Once your preferences are set, save them as your default to make setup quicker for future trades.
• Support: If you have any questions or feature requests, please feel free to reach out.
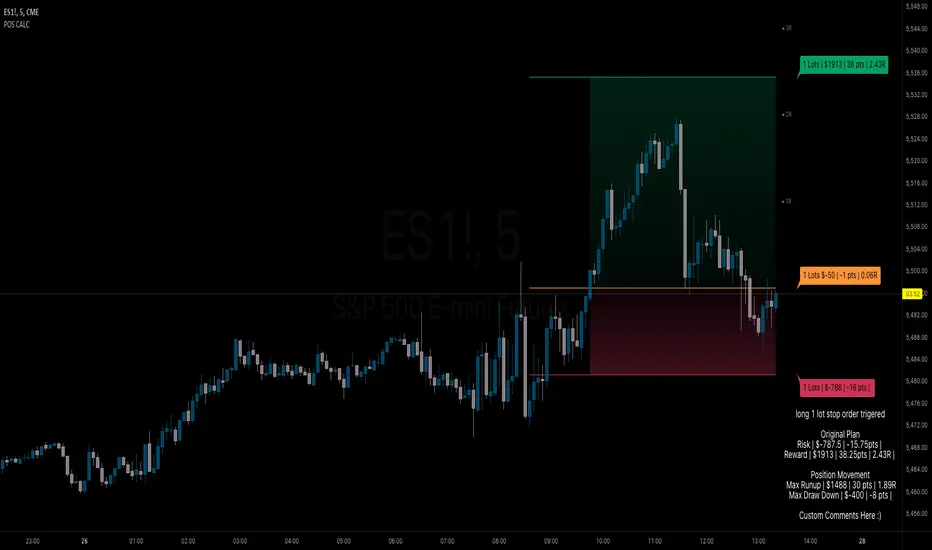
ICT Concept [TradingFinder] Order Block | FVG | Liquidity Sweeps🔵 Introduction
The "ICT" style is one of the subsets of "Price Action" technical analysis. ICT is a method created by "Michael Huddleston", a professional forex trader and experienced mentor. The acronym ICT stands for "Inner Circle Trader".
The main objective of the ICT trading strategy is to combine "Price Action" and the concept of "Smart Money" to identify optimal entry points into trades. However, finding suitable entry points is not the only strength of this approach. With the ICT style, traders can better understand price behavior and adapt their trading approach to market structure accordingly.
Numerous concepts are discussed in this style, but the key practical concepts for trading in financial markets include "Order Block," "Liquidity," and "FVG".
🔵 How to Use
🟣Order Block
Order blocks are a specific type of "Supply and Demand" zones formed when a series of orders are placed in a block. These orders could be created by banks or other major players. Banks typically execute large orders in blocks during their trading sessions. If they were to enter the market directly with a small quantity, significant price movements would occur before the orders are fully executed, resulting in less profit. To avoid this, they divide their orders into smaller, manageable positions. Traders should look for "buy" opportunities in "demand order blocks" areas and "sell" opportunities in "supply order blocks".
🟣Liquidity
These levels are where traders aim to exit their trades. "Market Makers" or smart money usually collects or distributes their trading positions near levels where many retail traders have placed their "Stop Loss" orders. When the liquidity resulting from these losses is collected, the price often reverses direction.
A "Stop Hunt" is a move designed to neutralize liquidity generated by triggered stop losses. Banks often use significant news events to trigger stop hunts and acquire the liquidity released in the market. If, for example, they intend to execute heavy buy orders, they encourage others to sell through stop hunts.
As a result, if there is liquidity in the market before reaching the order block region, the credibility of that order block is higher. Conversely, if liquidity is near the order block, meaning the price reaches the order block before reaching the liquidity area, the credibility of that order block is lower.
🟣FVG (Fair Value Gap)
To identify the "Fair Value Gap" on the chart, one must analyze candle by candle. Focus on candles with large bodies, examining one candle and the one before it. The candles before and after this central candle should have long shadows, and their bodies should not overlap with the body of the central candle. The distance between the shadows of the first and third candles is called the FVG range.
These zone function in two ways :
•Supply and Demand zone: In this case, the price reacts to these zone, and its trend reverses.
•Liquidity zone: In this scenario, the price "fills" the zone and then reaches the order block.
Important Note: In most cases, FVG zone with very small width act as supply and demand zone, while zone with a significant width act as liquidity zone, absorbing the price.
🔵 Setting
🟣Order Block
Refine Order Block : When the option for refining order blocks is Off, the supply and demand zones encompass the entire length of the order block (from Low to High) in their standard state and remain unaltered. On the option for refining order blocks triggers the improvement of supply and demand zones using the error correction algorithm.
Refine Type : The enhancement of order blocks via the error correction algorithm can be executed through two methods: Defensive and Aggressive. In the Aggressive approach, the widest possible range is taken into account for order blocks.
Show High Levels : If major high levels are to be displayed, set the option for showing high level to Yes.
Show Low Levels : If major low levels are to be displayed, set the option for showing low level to Yes.
Show Last Support : If showing the last support is desired, set the option for showing last support to Yes.
Show Last Resistance : If showing the last resistance is desired, set the option for showing last resistance to Yes.
🟣 FVG
FVG Filter : When FVG filtering is activated, the number of FVG areas undergoes filtration based on the specified algorithm.
FVG Filter Types :
1. Very Aggressive : Apart from the initial condition, an additional condition is introduced. For an upward FVG, the maximum price of the last candle should exceed the maximum price of the middle candle. Similarly, for a downward FVG, the minimum price of the last candle should be lower than the minimum price of the middle candle. This mode eliminates a minimal number of FVGs.
2. Aggressive : In addition to the conditions of the Very Aggressive mode, this mode considers the size of the middle candle; it should not be small. Consequently, a larger number of FVGs are eliminated in this mode.
3. Defensive : Alongside the conditions of the Very Aggressive mode, this mode takes into account the size of the middle candle, which should be relatively large with the majority of it comprising the body. Furthermore, to identify upward FVGs, the second and third candles must be positive, whereas for downward FVGs, the second and third candles must be negative. This mode filters out a considerable number of FVGs, retaining only those of suitable quality.
4. Very Defensive : In addition to the conditions of the Defensive mode, the first and third candles should not be very small-bodied doji candles. This mode filters out the majority of FVGs, leaving only the highest quality ones. Show Demand FVG: Enables the display of demand-related boxes, which can be toggled between off and on. Show Supply FVG: Enables the display of supply-related boxes along the path, which can also be toggled between off and on.
🟣 Liquidity
Statics Liquidity Line Sensitivity : A value ranging from 0 to 0.4. Increasing this value reduces the sensitivity of the "Statics Liquidity Line Detection" function and increases the number of identified lines. The default value is 0.3.
Dynamics Liquidity Line Sensitivity : A value ranging from 0.4 to 1.95. Increasing this value enhances the sensitivity of the "Dynamics Liquidity Line Detection" function and decreases the number of identified lines. The default value is 1.
Statics Period Pivot : Default value is set to 8. By adjusting this value, you can specify the period for static liquidity line pivots.
Dynamics Period Pivot : Default value is set to 3. By adjusting this value, you can specify the period for dynamic liquidity line pivots.
You can activate or deactivate liquidity lines as necessary using the buttons labeled "Show Statics High Liquidity Line," "Show Statics Low Liquidity Line," "Show Dynamics High Liquidity Line," and "Show Dynamics Low Liquidity Line".

GRID SPOT TRADING ALGORITHM - GRID BOT TRADING STRATEGYGRID SPOT TRADING ALGORITHM : LONG ONLY STRATEGY OPEN SOURCE
This is a long only strategy for spot assets.
HOW IT WORKS
Grid trading is a trading strategy where an investor creates a so-called "price grid". The basic idea of the strategy is to repeatedly buy at the pre-specified price and then wait for the price to rise above that level and then sell the position (and vice versa with shorting or hedging).
FEATURES
Grids: This algorithm has a total of 10 grids.
Take profit: The trader can increase or decrease the distance between the grids from the User Interface panel, the distance between one grid and another represents the take profit.
Management: The algorithm buys 10% of the capital every time the price breaks down a grid and sells during a rise to the next higher grid. The initial capital is invested in 10 sizes which represent 10% of the capital per trade.
Stop Loss: The algorithm knows no stop loss as long as it is not activated from the User Interface panel. By activating the stop loss from the User Interface panel the algorithm will insert a close condition on all trades which will be calculated from the last lower grid.
Trades: Trades are opened only if the price is within the grid. If the market leaves the grid the algorithm will not buy new positions or sell new positions.
Optimal market conditions: The favorable market for this algorithm is the sideways market.
LIMITATIONS OF THE MODEL
The trader must take into account that this is a static model. It only works perfectly well if the market is in a sideways phase and incurs heavy losses if the market takes a downward trend. The model is unusable for an uptrend. The trader must therefore carefully analyze the market where he intends to use this strategy, making sure that the price is in a sideways phase.
USES
Indispensable research and backtesting tool for those using bots for their investments. The algorithm produces a backtesting of the strategy for past history. It is used by professional traders to understand if this strategy has been profitable on a market and what parameters to use for bots using this strategy (Kucoin, Binance etc.).
If you would like to develop your own algorithm with customized conditions based on a grid strategy, please contact us.
If you need help in using this tool, please contact us without hesitation.

Trading PanelWhen trading, position sizing and risk calculation is the key to become successful.
We need to keep the losses small and adjust the position size according to what
risk we are prepared to take for the planned Entry.
Based on the Account Size and the max percentage we want to risk for any trade,
we calculate, for a number of fixed max Loss percentages:
- The Position size, both in percent and in the selected currency.
- Number of shares to buy.
- Where to put the Stop Loss.
We also calculate the numbers based on the ATR times a multiple.
The values are presented in a table format and will hopefully aid in selecting
a suitable Stop Loss (based on the chart situation) and hence the proper Position Size.
We also allow for expressing the Account size in currencies other than USD.
Example:
Account Size in USD and trading US stocks: select USD
Account Size in SEK but trading US stocks: select USDSEK
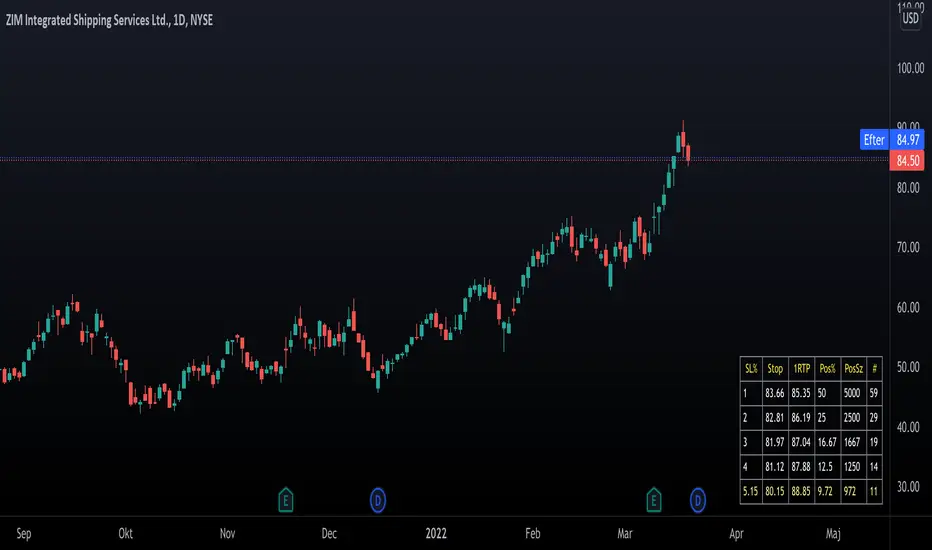
Bollinger Bands Strategy with StopLossThis is the default Bollinger Bands Strategy with a small change to support Stop Loss.
The default built-int BBS does not support Stop Loss and using it may cause large losses, specially in margin trading.
Added inputs:
Source
Stop Loss Percentage
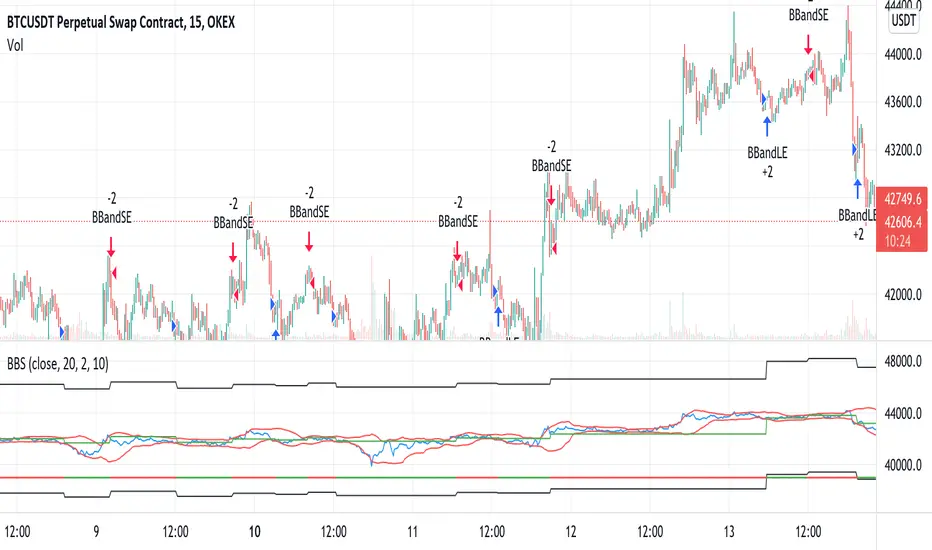
Two Take Profit StrategyThis script is for research purposes only. I am not a financial advisor.
Entry Condition
This strategy is based on two take profit targets and scaling out strategy. The entry rule is very simple. Whenever the EMA crossover WMA, the long trade is taken and vice versa.
Take Profit and Stop Loss
The first take profit is set at 20 pips above the long entry and the second take profit is set at 40 pips above the long entry. Meanwhile, the stop loss is set at 20 pips below the long entry.
Money Management
When the first take profit is achieved, half of the position is closed. The rest of the position is open to achieve either second take profit or stop loss.
There are three outcomes when using this strategy. Let's say you enter the trade with 200 lot size and you are risking 2% of your equity.
1. The first outcome is when the price hits stop loss, you lose the entire 2%.
2. The second outcome is when the price hits the first take profit and you close half of your position. Meaning that you have gained 1%. Then you let the trade running and eventually it hits stop loss. The total loss is 0% because the remaining lot size which is 200/2=100 times by 20pips is 1%. You have gained the earlier 1% and then loss 1%. At this point, you are at break even.
3. The third outcome is similar to the second out but instead of hiring stop loss, the trade is running to your favor and hits the second take profit.
Therefore, you gained 1% from the first take profit and you gained another 2% for the second take profit. Your total gained is 3%
Summary
The reason behind this strategy is to minimize risk. with normal strategy, you only have two outcomes which are either win or loss. With this strategy, you have three outcomes which are win, loss or break even.

Price Channel ScalpingMy X account:@CTF_bule_lotus
1. Core Logic (Price Channel Breakout)
The strategy relies on a single, simple indicator: the highest high of the past 20 bars.
When the current price breaks above this 20-period high, a stop entry is used to initiate a long position.
This design avoids prediction.
The model waits for the market to demonstrate momentum before participating.
2. Trade Direction (Long Only)
The strategy exclusively trades long positions and does not take shorts.
This choice is based on:
ETH’s historically upward-biased structure
Avoiding noise from two-sided signals during high-volatility periods
Keeping the direction consistent, which is beneficial for scalping-style systems
3. Risk Management (Fixed TP / SL)
Immediately after entry, the strategy sets two fixed exit conditions:
Take Profit: +10 price units
Stop Loss: –10 price units
Both are automatically converted using the market’s minimum tick size to ensure cross-instrument applicability.
This fixed TP/SL structure is typical in scalping systems:
small wins, fast exits, controlled losses, high turnover.
4. Transaction Costs
A 0.03% fee is applied to every trade throughout the entire backtest.
This fee level reflects the cost structure of major centralized exchanges, making results closer to real-world conditions.
5. Data & Time Range (2016–2025 Full Sample)
The backtest uses ETH’s complete historical dataset from 2016 to 2025.
No subjective filtering is applied—large moves, flash crashes, and black-swan events are all included.
The strategy does not rely on heavy parameter tuning, reducing the risk of overfitting.
6. Backtest Results (Including Fees)
Under this fixed, rule-based structure, the cumulative return is:
1,202,002.77% (2016 → 2025)
Even after including transaction fees, performance is driven by:
High trade frequency and small profit targets
Strict loss containment
Capturing momentum during breakout regimes
7. Transparency & Reproducibility
I will publish the full Pine Script implementation, including:
Entry logic
Exit logic
Fee configuration
All parameters
Backtesting framework
Transparency and reproducibility remain the core principles of this research.

Force DashboardScalping Dashboard - Complete User Guide
Overview
This scalping system consists of two complementary TradingView indicators designed for intraday trading with no overnight holds:
Force Dashboard - Single-row table showing real-time market bias and entry signals
Large Order Detection - Visual diamonds showing institutional order flow
Together, they provide a complete at-a-glance view of market conditions optimized for quick entries and exits.
Recommended Timeframes
Primary Scalping Timeframes
1-minute chart: Ultra-fast scalps (30 seconds - 3 minutes hold time)
2-minute chart: Quick scalps (2-5 minutes hold time)
5-minute chart: Standard scalps (5-15 minutes hold time)
Best Practices
Use 1-2 minute for highly liquid instruments (ES, NQ, major forex pairs)
Use 5-minute for less liquid markets or if you prefer fewer signals
Never hold past the last hour of trading to avoid overnight risk
Set hard stop times (e.g., exit all positions by 3:45 PM EST)
Dashboard Components Explained
Core Indicators (Circles ●)
MACD (5/13/5)
Green ● = Bullish momentum (MACD histogram positive)
Red ● = Bearish momentum (MACD histogram negative)
Gray ● = No clear momentum
Use: Confirms trend direction and momentum shifts
EMA (9/20/50)
Green ● = Price > EMA9 > EMA20 (uptrend)
Red ● = Price < EMA9 < EMA20 (downtrend)
Gray ● = Choppy/sideways
Use: Identifies the immediate micro-trend
Stoch (5-period Stochastic)
Green ● = Oversold (<20) - potential reversal up
Red ● = Overbought (>80) - potential reversal down
Gray ● = Neutral zone (20-80)
Use: Spots reversal opportunities at extremes
RSI (7-period)
Green ● = Oversold (<30)
Red ● = Overbought (>70)
Gray ● = Neutral
Use: Confirms overbought/oversold conditions
CVD (Cumulative Volume Delta)
Green ● = CVD above its moving average (buying pressure)
Red ● = CVD below its moving average (selling pressure)
Gray ● = Neutral
Use: Shows overall buying vs selling pressure
ΔCVD (Delta CVD - Rate of Change)
Green ● = CVD accelerating upward (buying acceleration)
Red ● = CVD accelerating downward (selling acceleration)
Gray ● = No acceleration
Use: Detects momentum shifts in order flow
Imbal (Order Flow Imbalance)
Green ● = Buy pressure >2x sell pressure
Red ● = Sell pressure >2x buy pressure
Gray ● = Balanced
Use: Identifies extreme one-sided order flow
Vol (Volume Strength)
Green ● = Volume >1.5x average (strong interest)
Red ● = Volume <0.7x average (low interest)
Gray ● = Normal volume
Yellow background = Volume surge (>2x average) - BIG MOVE ALERT
Use: Confirms conviction behind price moves
Tape (Tape Speed)
Green ● = Fast order flow (>1.3x normal)
Red ● = Slow order flow (<0.7x normal)
Gray ● = Normal speed
Yellow background = Very fast tape (>1.5x) - RAPID EXECUTION ALERT
Use: Measures urgency and speed of orders
Key Levels
Support (Supp)
Shows the nearest high-volume support level below current price
Bright Green background = Price is AT support (within 0.3%) - BOUNCE ZONE
Green background = Price above support (healthy)
Red background = Price below support (broken support, now resistance)
Resistance (Res)
Shows the nearest high-volume resistance level above current price
Bright Orange background = Price is AT resistance (within 0.3%) - REJECTION ZONE
Red background = Price below resistance (facing overhead supply)
Green background = Price above resistance (breakout)
These levels update automatically every 3 bars based on volume profile
Entry Signal Components
Score
Displays format: "6L" (6 long indicators) or "4S" (4 short indicators)
Bright Green = 6-7 indicators aligned for long
Light Green = 5 indicators aligned for long
Yellow = 4 indicators aligned (weaker setup)
Gray = No alignment
Red/Orange colors = Same scale for short setups
Score of 5+ indicates high-probability setup
SCALP (Main Entry Signal)
BRIGHT GREEN "LONG" = High-quality long scalp (Score 5+)
Green "LONG" = Decent long scalp (Score 4)
BRIGHT ORANGE "SHORT" = High-quality short scalp (Score 5+)
Red "SHORT" = Decent short scalp (Score 4)
Gray "WAIT" = No clear setup - STAY OUT
Entry Strategies
Strategy 1: High-Probability Scalps (Conservative)
When to Enter:
SCALP column shows BRIGHT GREEN "LONG" or BRIGHT ORANGE "SHORT"
Score is 5 or higher
Vol or Tape has yellow background (volume surge)
Example Long Setup:
SCALP = BRIGHT GREEN "LONG"
Score = 6L
Vol = Yellow background
Price AT Support (bright green Supp cell)
EMA, MACD, CVD, ΔCVD, Imbal all green
Entry: Enter immediately on next candle
Target: 0.5-1% move or resistance level
Stop: Below support or -0.3%
Hold Time: 2-10 minutes
Strategy 2: Momentum Scalps (Aggressive)
When to Enter:
Tape has yellow background (fast tape)
Vol has yellow background (volume surge)
ΔCVD is green (for longs) or red (for shorts)
Imbal shows strong imbalance in your direction
Score is 4+
Example Short Setup:
Tape & Vol = Yellow backgrounds
ΔCVD = Red, Imbal = Red
Price AT Resistance (bright orange)
Score = 5S
Entry: Enter immediately
Target: Quick 0.3-0.7% move
Stop: Tight -0.2%
Hold Time: 1-5 minutes
Strategy 3: Reversal Scalps (Mean Reversion)
When to Enter:
Stoch shows oversold (green) or overbought (red)
RSI confirms the extreme
Price is AT Support (for longs) or AT Resistance (for shorts)
ΔCVD and Imbal start reversing direction
Score is 4+
Example Long Setup:
Stoch = Green (oversold)
RSI = Green (oversold)
Supp = Bright green (at support)
ΔCVD turns green
Imbal turns green
Score = 4L or 5L
Entry: Wait for confirmation candle
Target: Move back to EMA9 or mid-range
Stop: Below the low
Hold Time: 3-8 minutes
Large Order Detection Usage
Diamond Signals
Green diamonds below bar = Large buy orders (institutional buying)
Red diamonds above bar = Large sell orders (institutional selling)
Size matters: Larger diamonds = larger order flow
How to Use with Dashboard
Confirmation Entries
Dashboard shows "LONG" signal
Green diamond appears
Enter immediately - institutions are buying
Divergence Alerts (CAUTION)
Dashboard shows "LONG" signal
RED diamond appears (institutions selling)
DO NOT ENTER - conflicting order flow
Cluster Patterns
Multiple green diamonds in row = Strong accumulation, stay long
Multiple red diamonds in row = Strong distribution, stay short
Alternating colors = Chop, avoid trading
Risk Management Rules
Position Sizing
Risk 0.5-1% of account per scalp
Maximum 3 concurrent positions
Reduce size after 2 consecutive losses
Stop Loss Guidelines
Tight stops: 0.2-0.3% for 1-2 min charts
Standard stops: 0.3-0.5% for 5 min charts
Always use stop loss - no exceptions
Place stops below support (longs) or above resistance (shorts)
Take Profit Targets
Target 1: 0.3-0.5% (take 50% off)
Target 2: 0.7-1% (take remaining 50%)
Move stop to breakeven after Target 1 hit
Trail stop if Score remains high
Time-Based Exits
Exit immediately if:
SCALP changes from LONG/SHORT to WAIT
Score drops below 3
Large diamond appears in opposite direction
Maximum hold time: 15 minutes (even if profitable)
Hard exit time: 30 minutes before market close
Trading Sessions
Best Times to Scalp
High-Liquidity Sessions
9:30-11:00 AM EST (Market open, highest volume)
2:00-3:30 PM EST (Afternoon session, good moves)
Avoid
11:30 AM-1:30 PM EST (Lunch, low volume)
Last 30 minutes (unpredictable, don't initiate new trades)
News releases (wait 5 minutes for volatility to settle)
Common Patterns & Setups
The Perfect Storm (Highest Probability)
Score = 6L or 7L
SCALP = BRIGHT GREEN
Vol + Tape = Yellow backgrounds
Green diamond appears
Price AT Support
Win rate: ~70-80%
The Fade Setup (Counter-Trend)
Price hits resistance (bright orange)
Stoch + RSI overbought (red)
Red diamond appears
CVD starts turning red
SCALP shows "SHORT"
Win rate: ~60-70%
The Breakout Continuation
Price breaks resistance (Res turns green)
EMA, MACD green
Vol surge (yellow)
Multiple green diamonds
SCALP = "LONG"
Win rate: ~65-75%
Warning Signs - DO NOT TRADE
Red Flags
❌ SCALP shows "WAIT"
❌ Score below 3
❌ Vol and Tape both gray (no volume)
❌ Conflicting signals (dashboard says LONG but red diamonds appearing)
❌ Alternating green/red circles (choppy market)
❌ Support and Resistance very close together (tight range)
Market Conditions to Avoid
Low volume periods
Major news releases (first 5 minutes after)
First 2 minutes after market open
Wide spreads
Consecutive losing trades (take a break after 2 losses)
Quick Reference Checklist
Before Taking ANY Trade:
☑ SCALP shows LONG or SHORT (not WAIT)
☑ Score is 4 or higher
☑ Vol or Tape shows activity
☑ No conflicting diamond signals
☑ Stop loss level identified
☑ Target profit level identified
☑ Not in restricted time periods
After Entering:
☑ Set stop loss immediately
☑ Set profit targets
☑ Watch SCALP column - exit if changes to WAIT
☑ Watch for opposite-colored diamonds
☑ Move stop to breakeven after first target
☑ Exit all by market close
Advanced Tips
Scalping Psychology
Be patient: Wait for Score 5+ setups
Be decisive: When signal appears, act immediately
Be disciplined: Follow your stop loss always
Be flexible: Exit quickly if dashboard reverses
Optimization
Backtest on your specific instrument
Adjust RSI/Stoch levels for your market
Fine-tune volume thresholds
Keep a trade journal to track which setups work best
Multi-Timeframe Confirmation
Use 5-min dashboard as "trend filter"
Take 1-min trades only in direction of 5-min SCALP signal
Increases win rate by ~10-15%
Troubleshooting
Q: Dashboard shows WAIT most of the time
Normal - scalping is about patience. Quality > Quantity
3-8 good setups per day is excellent
Q: Too many false signals
Increase minimum Score requirement to 5 or 6
Only trade with volume surge (yellow backgrounds)
Add large order detection confirmation
Q: Signals too slow
You may be on too high a timeframe
Try 1-minute chart for faster signals
Ensure real-time data feed is active
Q: Support/Resistance not updating
Normal - updates every 3 bars
If completely stuck, remove and re-add indicator
Summary
This scalping system works best when:
✅ Multiple indicators align (Score 5+)
✅ Volume and tape speed confirm the move
✅ Order flow (diamonds) confirms direction
✅ Price is at key levels (support/resistance)
✅ You manage risk strictly
✅ You exit before market close
The golden rule: When SCALP says WAIT, you WAIT. Discipline beats frequency.
