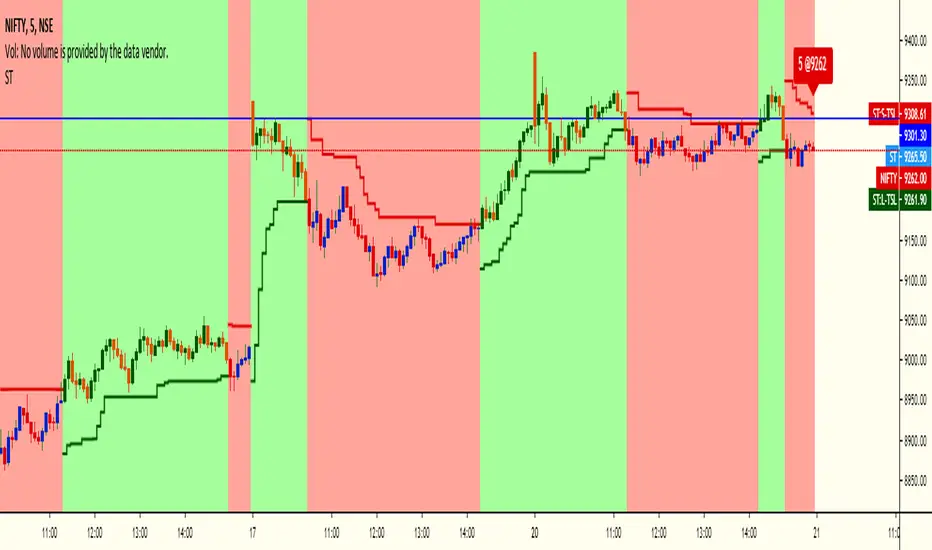
{Indyan}SupertrendHello trader friends,
A very simple but effective supertrend startegy which help u to get good RR. It is combination of 3 supertrend values with sma crossover. Enrty at pullback after sma crossover , exit only if sell signal low is broken.
I hope it will help my trader friends.
Love Indyan
Cari dalam skrip untuk "supertrend"
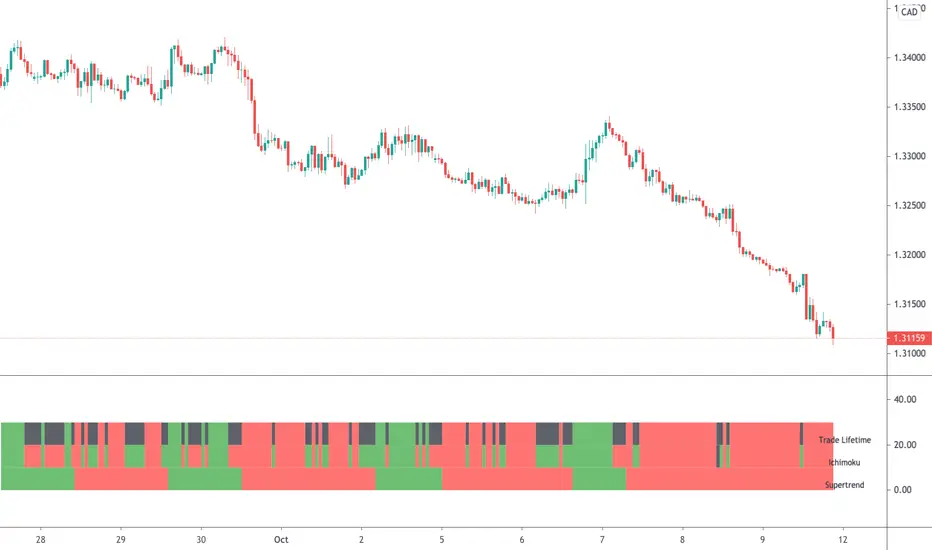
Ichimoku & Supertrend Combined StrategyOne of my mixed approach strategy indicators which include's:
- Ichimoku using much faster settings. (ECC-11)
- Supertrend
Whilst both Supertrend and Ichimoku are quite reliable, they do sometimes provide false signals. By combining both indicators, trading when both agree, it reduces the number of false alerts.
Using this indicator is simple. If the lifetime line is green then buy. If red then sell and when black don't trade. So...
Green Line - This strategy is in a buy position
Red Line - This strategy is in a sell position
Black Line - DON'T TRADE
The trader's approach is simple, when all indicators are green or red, then take the trade. As soon as one indicator changes, then re-evaluate using your normal process, such as price action, to determine whether to close the trade or continue.
There are also some alerts for opening and closing positions.
If you wish to make some changes or discuss, please don't hesitate to message me.
Variable SuperTrend - evoPlayed around with Lazy Bear's VMA and Gunazzi's SuperTrend Cloud .
It plots an uptrend if the low of a candle gets above the recent downtrend and plots a downtrend if the high of a candle gets below the recent uptrend, you have to wait for the candle to close to confirm the actual trend change.
I use it to give me a direction for longs or shorts, not as a stop/reverse indicator.
Thanks Lazy Bear and Gunazzi :)

Compact Self-Adjusting SuperTrendA custom version of Self Adjusting SuperTrend that can be used as source for your trading frameworks and indicators.

Indicator SuperTrend AllIndicator SuperTrend All:
An indicator that is an aggregate of other SuperTrend Values (Buy/Sell)
Multi Bollinger Bands V7 [SuperTrend Color]
Multi Bollinger Bands V7 is for trading volatility and trend .
You can user Multi Bollinger Bands V7 for Pyramid Trading
Supertrend Trend Change Signals + Covered Points Only (v5)[NR]Supertrend with Buy/Sell Signals + Covered Points (v5)
Description
This indicator is a custom version of the Supertrend that provides:
Buy/Sell signals whenever the trend flips (Up → Buy, Down → Sell).
Covered points label at the end of each trend, showing the total price movement captured from entry to exit.
Optional colored candles based on trend direction.
Visual markers (triangle up/down) for quick identification of flips.
Built-in alert conditions for Buy and Sell flips.
Use case:
Designed for traders who want not only entry/exit alerts but also a quick view of how many points the previous run covered. Especially useful for index futures (e.g., NIFTY, BankNIFTY) or instruments where point movement matters.
⚠ Note: This is a study/indicator, not a strategy. It does not auto-trade and should be combined with your own analysis and risk management.

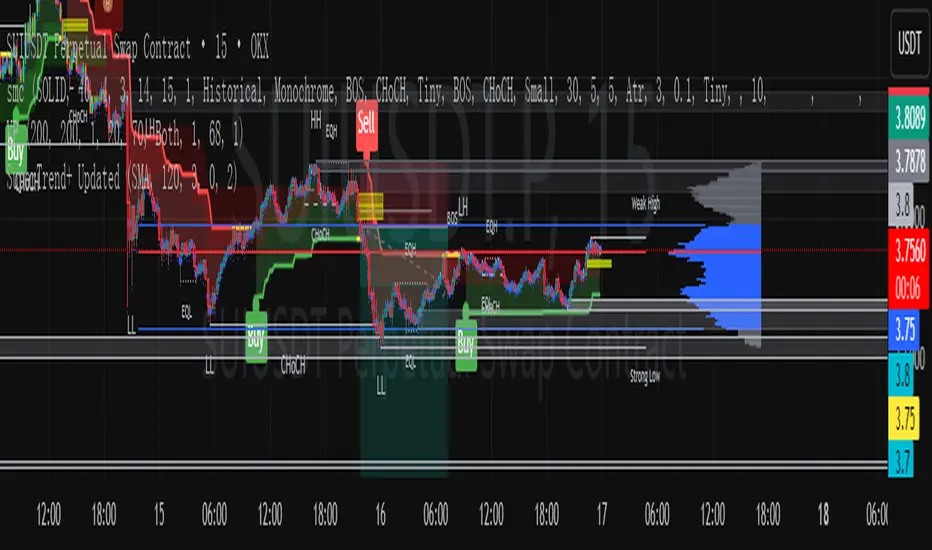
SuperTrend+ UpdatedSuperTrend+ with SL/TP is a technical analysis tool designed to identify market trends and potential trading opportunities. Based on the SuperTrend indicator, it incorporates additional features including stop loss and take profit level calculations.
The indicator visually displays uptrends and downtrends through colored lines and background highlighting, making trend direction easy to identify. It generates buy and sell signals when trend reversals are detected, with optional volume filtering to reduce false signals.
Key features include customizable ATR parameters, multiple calculation methods for stop loss and take profit levels (ATR-based or fixed percentage), and clear visual markers for entry points and target levels.
Ideal for traders looking to identify trend directions and manage risk with predefined exit levels, this indicator works across various timeframes and financial instruments.
Multi-timeframe 24 moving averages + BB+SAR+Supertrend+VWAP █ OVERVIEW
The script allows to display up to 24 moving averages ("MA"'s) across 5 timeframes plus two bands (Bollinger Bands or Supertrend or Parabolic SAR or VWAP bands) each from its own timeframe.
The main difference of this script from many similar ones is the flexibility of its settings:
- Bulk enable/disable and/or change properties of several MAs at once.
- Save 3 of your frequently used templates as presets using CSV text configurations.
█ HOW TO USE
Some use examples:
In order to "show 31, 50, 200 EMAs and 20, 100, 200 SMAs for each of 1H, 4H, D, W, M timeframes using blue for short MA, yellow for mid MA and red for long MA" use the settings as shown on a screenshot below.
In order to "Show a band of chart timeframe MA's of lengths 5, 8, 13, 21, 34, 55, 100 and 200 plus some 1H, 4H, D and W MAs. Be able to quickly switch off the band of chart tf's MAs. For chart timeframe MA's only show labels for 21, 100 and 200 EMAs". You can set TF1 and TF2 to chart's TF and set you fib MAs there and configure fixed higher timeframe MAs using TF3, TF4 and TF5 (e.g. using 1H, D and W timeframes and using 1H 800 in place of 4H 200 MA). However, quicker way may be using CSV - the syntax is very simple and intuitive, see Preset 2 as it comes in the script. You can easily switch chart tf's band of MAs by toggling on/off your chart timeframe TF's (in our example, TF1 and TF2).
The settings are either obvious or explained in tooltips.
Note 1: When using group settings and CSV presets do not forget that individual setting affected will no have any effect. So, if some setting does not work, check whether it is overridden with some group setting or a CSV preset.
Note 2: Sometimes you can notice parts of MA's hanging in the air, not lasting up to the last bar. This is not a bug as explained on this screenshot:
█ FOR DEVELOPERS
The script is a use case of my CSVParser library, which in turn uses Autotable library, both of which I hope will be quite helpful. Autotable is so powerful and comprehensive that you will hardly ever wish to use normal table functions again for complex tables.
The indicator was inspired by Pablo Limonetti's url=https://www.tradingview.com/script/nFs56VUZ/]Multi Timeframe Moving Averages and Raging @RagingRocketBull's # Multi SMA EMA WMA HMA BB (5x8 MAs Bollinger Bands) MAX MTF - RRB

Profitable Supertrend v0.1 - AlphaThis a script to try detect the best combination of supertrend parameters in a space of time. Sadly the script is slow. Evaluate all possibilities params is hard for a pinescript and my knowledge too. In some cases, when you want evaluate many time could be the script fails for timeout. Perhaps with time I could enhance. For this problem of speed the calculate of combinatios it's not complete: In factor use a increment of 0.2 in each param (0.1, 0.3, 0.5 ...) in period the increment for each value is 3. The range for factor it's from 3.0 to 12.0. The range of period it's from 10 to 43
My knowledge don't let me go more far. Perhaps with time I can enhance the script.

Divit Multi SuperTrendthese are all supertrend lines with different settings.
green lines indicate uptrend.
red line indicates down trend.
when all lines are green its very good uptrend - you can buy.
when all lines are red its very good downtrend - you can sell.
when few lines are red and few are green its not confirmed buy or sell.
in this situation you may confirm buy or sell with the help of other indicators.
its an easy to use indicator.

Williams Vix Fix paired with Supertrend HeatmapThis script shows my mod of the powerful Williams' Vix Fix indicator paired with a modified Supertrend Heatmap, originally created by Daveatt.


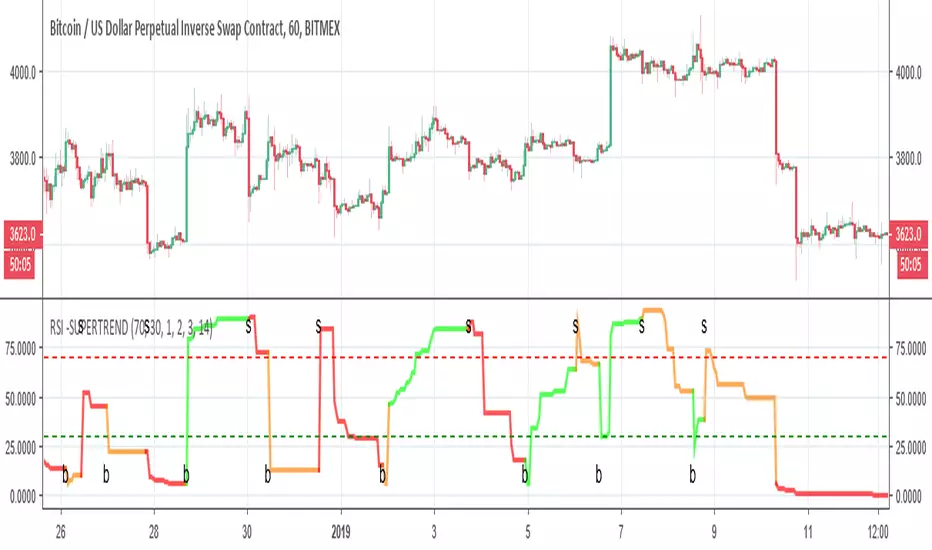
RSI -SUPERTRENDThis is hybrid of Super trend and RSI
the green and red zones are by the supertrend
so it seems the two indicator can compleemnt each other
TUX EMA Scalper+SuperTrendI sum up scripts TUX Ema Scalper by tux and Supertrend by abhi.shri2702
This script is just created for backtesting xbtusd.
Buy / Sell signal : Tux Ema Scalper mechanism ( ema 20 : up /down)
Green Arrow : Long
Pink Arrow : Short
Thank you for creators.

Supertrend + EMA50 — Signal (no labels) chpolSupertrend + EMA50, best for 15 minutes, Forex, Crypto, XAUUSD.


SuperTrendSAP1212This indicator combines Supertrend, VWAP with bands, and an optional RSI filter to generate Buy/Sell signals.
How it works
Supertrend Flip (ATR-based): Detects when trend direction changes (from bearish to bullish, or bullish to bearish).
VWAP Band Filter: Signals only trigger if the candle close is beyond the VWAP bands:
Buy = Supertrend flips up AND close > VWAP Upper Band
Sell = Supertrend flips down AND close < VWAP Lower Band
Optional RSI Filter:
Buy requires RSI < 20
Sell requires RSI > 80
Can be enabled/disabled in settings.
Features
Choice of VWAP band calculation mode: Standard Deviation or ATR.
Adjustable ATR/StDev length and multiplier for VWAP bands.
Toggle Supertrend, VWAP lines, and Buy/Sell labels.
Alerts included: add alerts on BUY or SELL conditions (use Once Per Bar Close to avoid intrabar signals).
Use
Works best on intraday or higher timeframes where VWAP is relevant.
Use the RSI filter for more selective signals.
Can be combined with your own stop-loss and risk management rules.
⚠️ Disclaimer: This script is for educational and research purposes only. It is not financial advice. Always test thoroughly and trade at your own risk.

Supertrend0913This Pine Script (`@version=6`) combines **two Supertrend indicators** and a set of **moving averages (EMA & MA)** into one overlay chart tool for TradingView.
**Key features:**
* **Supertrend \ & \ :**
* Each has independent ATR period, multiplier, and ATR calculation method.
* Plots trend lines (green/red for \ , blue/yellow for \ ).
* Generates **buy/sell signals** when trend direction changes.
* Includes **alert conditions** for buy, sell, and trend reversals.
* **Moving Averages:**
* 6 EMAs (lengths 21, 55, 100, 200, 300, 400).
* 5 SMAs (lengths 11, 23, 25, 39, 200).
* Each plotted in different colors for trend visualization.
👉 In short: it’s a **combined trading tool** that overlays two configurable Supertrend systems with alerts plus multiple EMAs/SMAs to help identify trend direction, signals, and potential entry/exit points.

Supertrend3n1it combines the 3 super trend indicator values to save space for more indicators in the chart , and it works perfectly with the stochastic RSI indicator

SuperTrend++@version = 4
@Release: TradersVenue TrendFollower
SuperTrend Study Alert
@Author: Prasuna.Barik (@TradersVenue)
It internally uses SuperTrend logic. It can be used for TrendFollowing trading and also as a TrailingSL indicator. Internally it takes the ATR value for the no of periods mentioned and uses the multiplier to derive the ATROffset. And if the stock is making higher high and trading above the Long TSL then it considers bullish else bearish . Accordingly it generates buy/sell signal.
Main difference between the standard supertrend indicator and this supertrend indicator is as follows:
1. This indicator dynamically changes the ATR period and multiplier basis the timeframe selected for optimal results against NSE/BSE stocks or indexes.
Indicator has been tested across almost all scripts and has done fairly well in backtesting for liquid stocks. Generates buy/sell alerts too.
2. If you want to use your own input parameters then you can provide it from front end and use option "Force Above Input Settings?"
3. Added background color for easy trend recognition (Green = Bullish | Red = Bearish . You may enable/disable it using the settings option "Change BGColor Basis Trend?".
4. You may use 'USE Multi-Color Bullish Candle?' setting where it changes candle color basis trend. It changes color as per below logic.
Green - Strong Above SuperTrend and Blue - Weak Below SuperTrend
Orange - Weak Bear Candle and Red - Strong Bear Candle
5. Also it displays quantity basis the 90% of initial capital (50k) dividing with highest high of previous day/week depending on intraday or positional