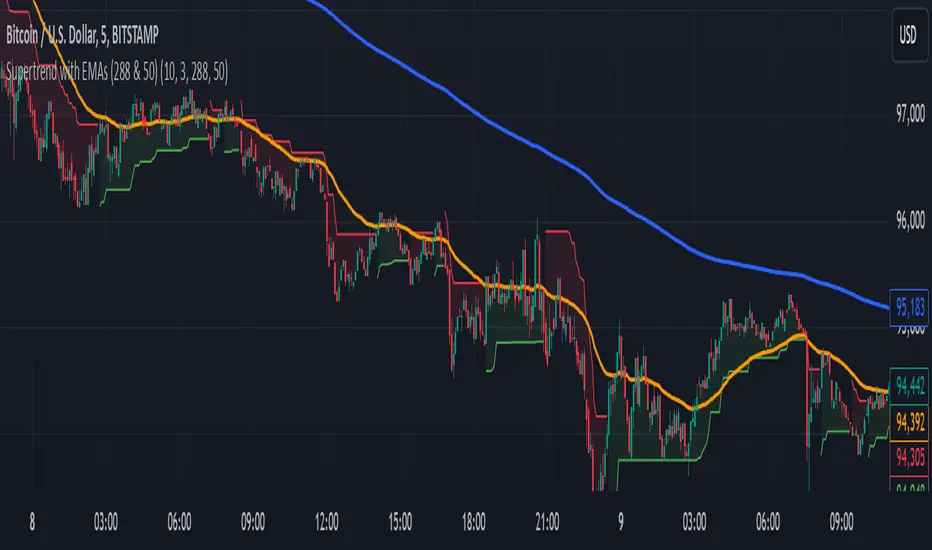
Supertrend with EMAs (288 & 50)This indicator combines the Supertrend with two key Exponential Moving Averages (EMAs) — the 50 EMA and the 288 EMA — to help traders identify trends and possible entry or exit points in the market.
Key Features:
Supertrend Indicator:
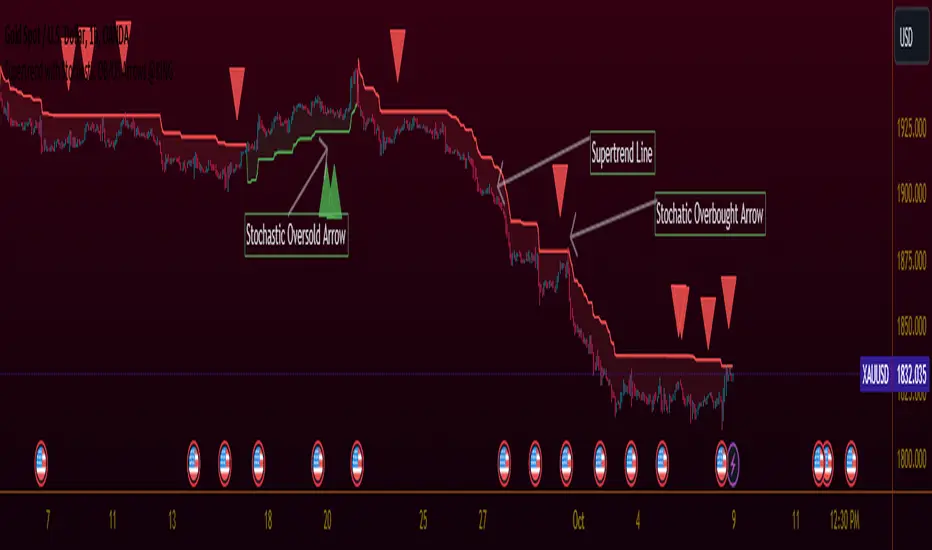
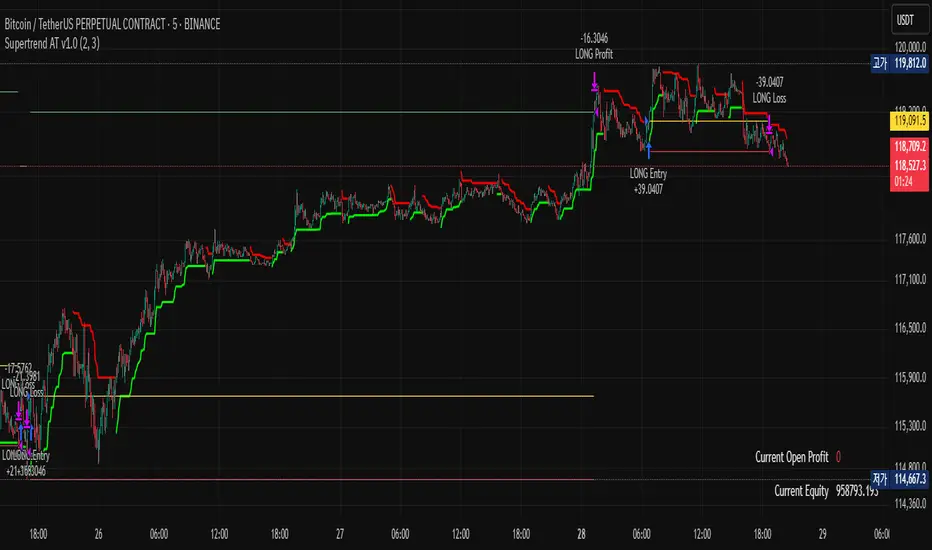
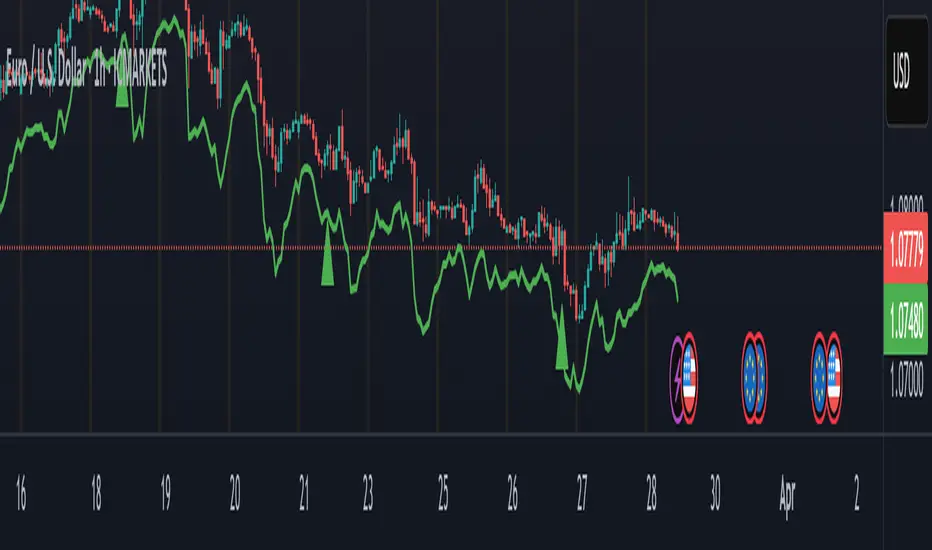
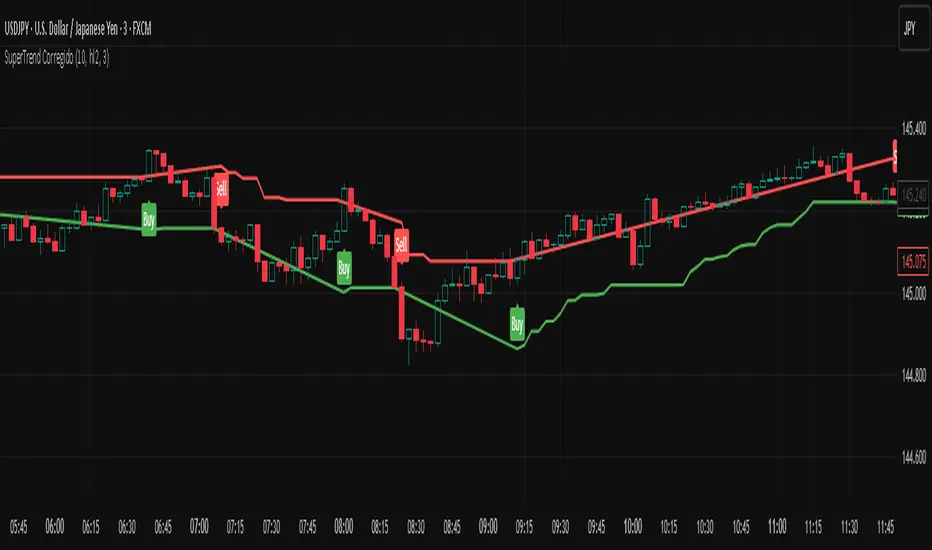
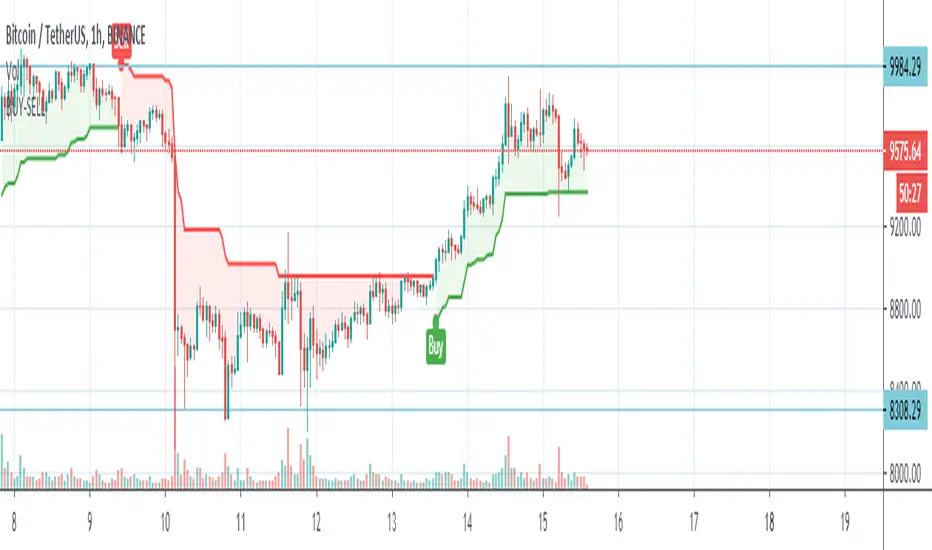
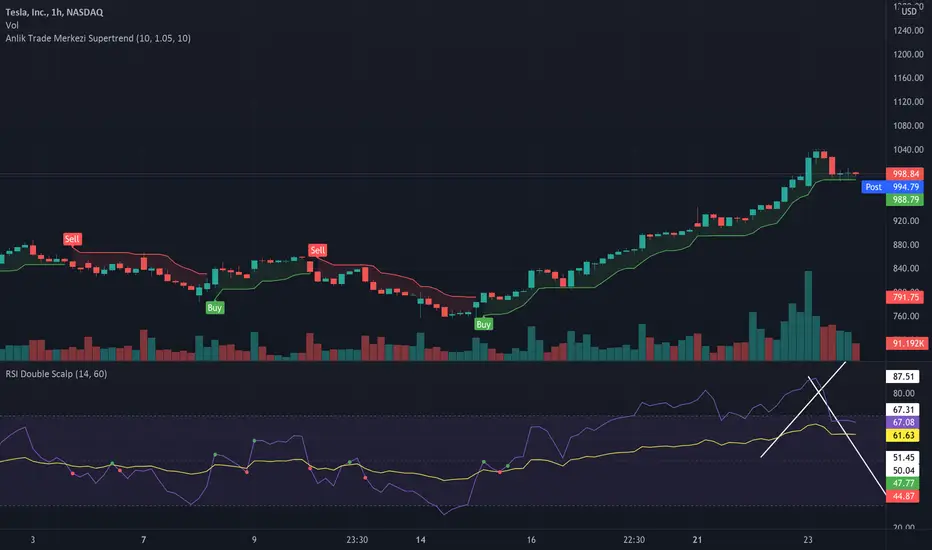
The Supertrend indicator is a widely used trend-following tool. It helps determine whether the market is in an uptrend or downtrend by adjusting based on the Average True Range (ATR).
In this indicator, green represents an uptrend, and red represents a downtrend.
288 EMA:
The 288-period Exponential Moving Average is plotted to show the long-term market trend. It reacts more quickly to recent price changes than a simple moving average, offering an effective way to gauge long-term market direction.
50 EMA:
The 50-period Exponential Moving Average is commonly used as a short-term trend indicator. It helps identify shorter-term trends and serves as a dynamic support/resistance level.
EMA Crossover Alerts:
This indicator includes alerts for when the 50 EMA crosses above the 288 EMA (bullish signal) and when it crosses below (bearish signal), helping traders catch trend reversals or confirmation of current trends.
Supertrend Alerts:
Alerts are triggered when the Supertrend indicator switches from uptrend to downtrend or downtrend to uptrend, indicating a potential shift in market direction.
Usage:
Uptrend Confirmation: When the Supertrend is green and the 50 EMA is above the 288 EMA, it signals that the market is in a strong bullish trend.
Downtrend Confirmation: When the Supertrend is red and the 50 EMA is below the 288 EMA, it indicates that the market is in a bearish trend.
Crossover Signals: The indicator provides alerts when the 50 EMA crosses above or below the 288 EMA, helping traders spot trend changes.
Best For:
Trend-following strategies
Identifying potential trend reversals and market shifts
Traders looking for a combination of short-term and long-term trend analysis
Note: This indicator is most effective when used in conjunction with other technical analysis tools and should be considered alongside other factors such as volume, support/resistance levels, and price action.
Penunjuk Pine Script®