2Mars - MA / BB / SuperTrend
The 2Mars strategy is a trading approach that aims to improve trading efficiency by incorporating several simple order opening tactics. These tactics include moving average crossovers, Bollinger Bands, and SuperTrend.
Entering a Position with the 2Mars Strategy:
Moving Average Crossover: This method considers the crossing of moving averages as a signal to enter a position.
Price Crossing Bollinger Bands: If the price crosses either the upper or lower Bollinger Band, it is seen as a signal to enter a position.
Price Crossing Moving Average: If the price crosses the moving average, it is also considered a signal to enter a position.
SuperTrend and Bars confirm:
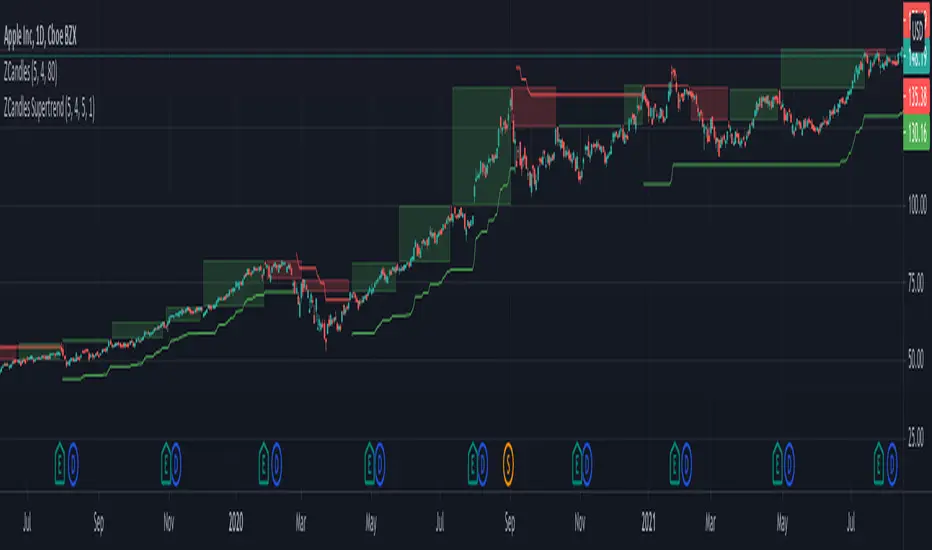
The SuperTrend indicator is used to provide additional confirmation for entering positions and setting stop loss levels. "Bars confirm" is used only for entry to positions.
Moving Average Crossover Strategy:
A moving average crossover refers to the point on a chart where there is a crossover of the signal or fast moving average, above or below the basis or slow moving average. This strategy also uses moving averages for additional orders #3.
Basis Moving Average Length: Ratio * Multiplier
Signal Moving Average Length: Multiplier
Bollinger Bands:
Bollinger Bands consist of three bands: an upper band, a lower band, and a basis moving average. However, the 2Mars strategy incorporates multiple upper and lower levels for position entry and take profit.
Basis +/- StdDev * 0.618
Basis +/- StdDev * 1.618
Basis +/- StdDev * 2.618
Additional Orders:
Additional Order #1 and #2: closing price crosses above or below the Bollinger Bands.
Additional Order #3: closing price crosses above or below the basis or signal moving average.
Take Profit:
The strategy includes three levels for taking profits, which are based on the Bollinger Bands. Additionally, a percentage of the position can be chosen to close long or short positions.
Limit Orders:
The strategy allows for entering a position using a limit order. The calculation for the limit order involves the Average True Range (ATR) for a specific period.
For long positions: Low price - ATR * Multiplier
For short positions: High price + ATR * Multiplier
Stop Loss:
To manage risk, the strategy recommends using stop loss options. The stop loss is updated with each entry order and take-profit level 3. When using the SuperTrend Confirmation, the stop loss requires confirmation of a trend change. It allows for flexible adjustment of the stop loss when the trend changes.
There are three options for setting the stop loss:
1. ATR (Average True Range):
For long positions: Low price - ATR * Long multiplier
For short positions: High price + ATR * Short multiplier
2. SuperTrend + ATR:
For long positions: SuperTrend - ATR * Long multiplier
For short positions: SuperTrend + ATR * Short multiplier
3. StdDev:
For long positions: StdDev - ATR * Long multiplier
For short positions: StdDev + ATR * Short multiplier
Flexible Stop Loss:
There is also a flexible stop loss option for the ATR and StdDev methods. It is triggered when the SuperTrend or moving average trend changes unfavorably.
For long positions: Stop-loss price + (ATR * Long multiplier) * Multiplier
For short positions: Stop-loss price - (ATR * Short multiplier) * Multiplier
How configure:
Disable SuperTrend, take profit, stop loss, additional orders and begin setting up a strategy.
Pick soucre data
Number of bars for confirm
Pick up the ratio of the base moving average and the signal moving average.
Set up a SuperTrend
Time for set up of the Bollinger Bands and the take profit
And finaly set up of stop loss and limit orders
All done!
For OKX exchange:
Strategi Pine Script®