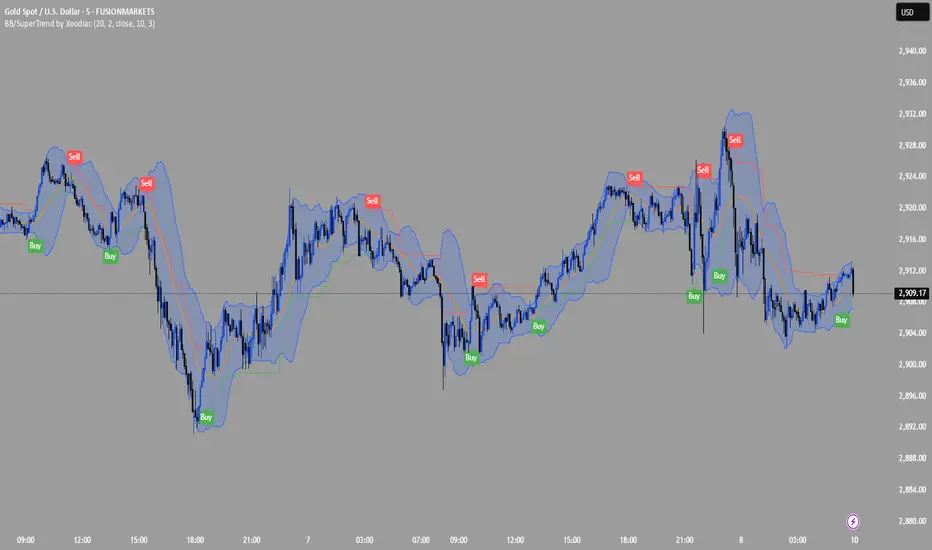
Volume MAs Supertrend | Lyro RS📊 Volume MAs Supertrend | Lyro RS is an advanced trading tool that combines volume-adjusted moving averages with a dynamic Supertrend system. This indicator provides a robust framework for identifying market trends and entry/exit points.
✨ Key Features :
📈 Volume-Weighted Moving Averages (VWMA): Integrates price and volume data to provide a more accurate moving average, allowing for better trend analysis.
🔧 Multiple MA Types: Choose from SMA, EMA, WMA, VWMA, DEMA, TEMA, RMA, HMA, ALMA to suit your preferred trading strategy.
📊 Dual-Multiplier Supertrend System: Uses ATR to dynamically calculate upper and lower bands for long and short trends, with distinct multipliers for each.
🎨 Customizable Color Schemes: Choose from Classic, Mystic, Accented, and Royal color palettes or customize your own colors for bullish and bearish trends.
🔍 Visual Enhancements: Color-coded Supertrend lines, candlesticks, and bars for quick trend identification.
⏰ Alert System: Alerts for long and short signals based on trend changes.
🔧 How It Works :
The Supertrend line is calculated using ATR over a user-defined period, with separate multipliers for long and short positions.
📈 A bullish trend is signaled when the price crosses above the upper band, and a bearish trend is signaled when the price crosses below the lower band.
🎨 The Supertrend line changes color to reflect trend direction, with candlesticks and bars matching the trend's color for visual clarity.
⚙️ Customization Options :
🛠️ Moving Average Settings: Select your preferred moving average type (SMA, EMA, VWMA, etc.) and adjust the length for smoother or more responsive trend signals.
📐 Supertrend Parameters: Define the ATR period and adjust multipliers to fine-tune sensitivity for long and short signals.
🎨 Color Configuration: Choose from predefined color palettes or create your own custom scheme for trend signals.
📈 Use Cases :
✅ Confirm market trends before entering trades.
🚪 Identify potential entry/exit points as trend directions shift.
👀 Visually analyze market conditions with color-coded candlesticks and bars.
⚠️ Disclaimer :
This indicator should not be used as a standalone tool for making trading decisions. Always combine with other forms of analysis and risk management practices.
Penunjuk Pine Script®