Crypto 15M Volume + Supertrend + RSI StrategyThis is AI generated Signal Base on Supertrend, RSI, And Volume Base indicator to create codeStrategi Pine Script®oleh adamtan5119
Triple Supertrend + EMA CrossoverCustomized 3 supertrend and EMA crossover which is helpful for identification of the trend.Penunjuk Pine Script®oleh Saurabh_Tiwari25
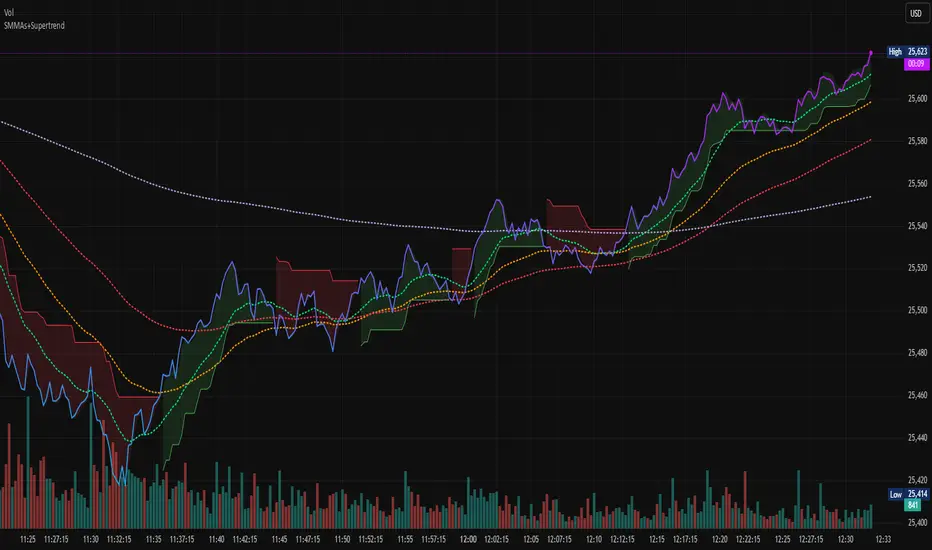
SMMAs+Supertrend v2Combines: 10 SMMA 23 SMMA 50 SMMA 200SMM SuperTrend Penunjuk Pine Script®oleh enlightenor8
SMMAs+SupertrendCombines: 10 SMMA 23 SMMA 50 SMMA 200 SMMA SuperTrendPenunjuk Pine Script®oleh enlightenor2
SMMAs+SupertrendCombines: 10 SMMA 23 SMMA 50 SMMA 200 SMMA SuperTrend Penunjuk Pine Script®oleh enlightenor4
Trendline Breaks + Supertrend [Delta BTC-P] (API)Trendline Breaks + Supertrend (API) best on 5 minStrategi Pine Script®oleh theone_Raj26
Trendline Breaks + Supertrend [Delta BTC-P]Trendline Breaks + Supertrend in same direct Best on 5 minStrategi Pine Script®oleh theone_Raj45
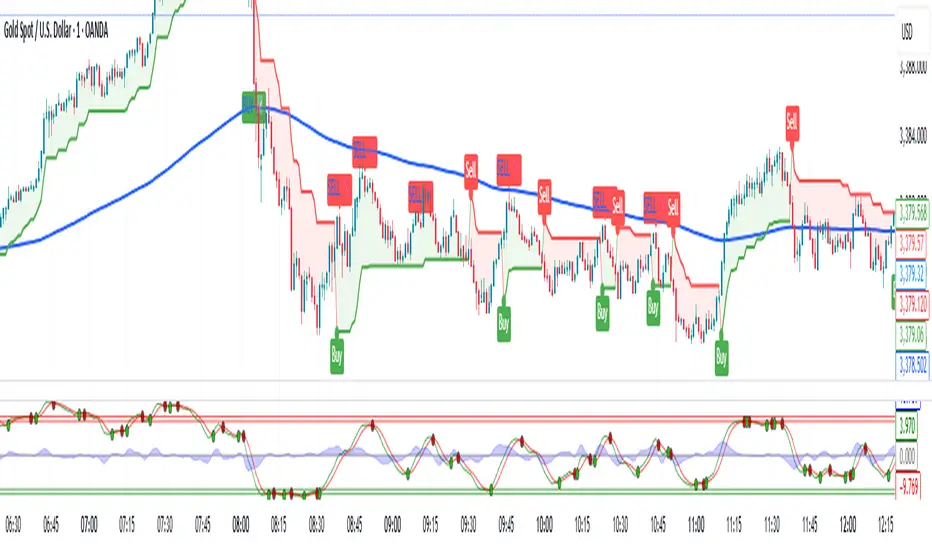
Super-AO Engine - Sentiment Ribbon - 11-29-25Super-AO Sentiment Ribbon by Signal Lynx Overview: The Super-AO Sentiment Ribbon is the visual companion to the Super-AO Strategy Suite. While the main strategy handles the complex mathematics of entries and risk management, this tool provides a simple "Traffic Light" visual at the top of your chart to gauge the overall health of the market. How It Works: This indicator takes the core components of the Super-AO strategy (The SuperTrend and the Awesome Oscillator), calculates the spread between them and the current price, and generates a normalized "Sentiment Score." Reading the Colors: 🟢 Lime / Green: Strong Upward Momentum. Ideally, you only want to take Longs here. 🟤 Olive / Yellow: Trend is weakening. Be careful with new entries, or consider taking profit. ⚪ Gray: The "Kill Zone." The market is chopping sideways. Automated strategies usually suffer here. 🟠 Orange / Red: Strong Downward Momentum. Ideally, you only want to take Shorts here. Integration: This script uses the same default inputs as our Super-AO Strategy Template and Alerts Template. Use them together to confirm your automated entries visually. About Signal Lynx: Free Scripts supporting Automation for the Night-Shift Nation 🌙 (www.signallynx.com)Penunjuk Pine Script®oleh SignalLynx1
Super-AO with Risk Management Alerts Template - 11-29-25Super-AO with Risk Management: ALERTS & AUTOMATION Edition Signal Lynx | Free Scripts supporting Automation for the Night-Shift Nation 🌙 1. Overview This is the Indicator / Alerts companion to the Super-AO Strategy. While the Strategy version is built for backtesting (verifying profitability and checking historical performance), this Indicator version is built for Live Execution. We understand the frustration of finding a great strategy, only to realize you can't easily hook it up to your trading bot. This script solves that. It contains the exact same "Super-AO" logic and "Risk Management Engine" as the strategy version, but it is optimized to send signals to automation platforms like Signal Lynx, 3Commas, or any Webhook listener. 2. Quick Action Guide (TL;DR) Purpose: Live Signal Generation & Automation. Workflow: Use the Strategy Version to find profitable settings. Copy those settings into this Indicator Version. Set a TradingView Alert using the "Any Alert() function call" condition. Best Timeframe: 4 Hours (H4) and above. Compatibility: Works with any webhook-based automation service. 3. Why Two Scripts? Pine Script operates in two distinct modes: Strategy Mode: Calculates equity, drawdowns, and simulates orders. Great for research, but sometimes complex to automate. Indicator Mode: Plots visual data on the chart. This is the preferred method for setting up robust alerts because it is lighter weight and plots specific values that automation services can read easily. The Golden Rule: Always backtest on the Strategy, but trade on the Indicator. This ensures that what you see in your history matches what you execute in real-time. 4. How to Automate This Script This script uses a "Visual Spike" method to trigger alerts. Instead of drawing equity curves, it plots numerical values at the bottom of your chart when a trade event occurs. The Signal Map: Blue Spike (2 / -2): Entry Signal (Long / Short). Yellow Spike (1 / -1): Risk Management Close (Stop Loss / Trend Reversal). Green Spikes (1, 2, 3): Take Profit Levels 1, 2, and 3. Setup Instructions: Add this indicator to your chart. Open your TradingView "Alerts" tab. Create a new Alert. Condition: Select SAO - RM Alerts Template. Trigger: Select Any Alert() function call. Message: Paste your JSON webhook message (provided by your bot service). 5. The Logic Under the Hood Just like the Strategy version, this indicator utilizes: SuperTrend + Awesome Oscillator: High-probability swing trading logic. Non-Repainting Engine: Calculates signals based on confirmed candle closes to ensure the alert you get matches the chart reality. Advanced Adaptive Trailing Stop (AATS): Internally calculates volatility to determine when to send a "Close" signal. 6. About Signal Lynx Automation for the Night-Shift Nation 🌙 We are providing this code open source to help traders bridge the gap between manual backtesting and live automation. This code has been in action since 2022. If you are looking to automate your strategies, please take a look at Signal Lynx in your search. License: Mozilla Public License 2.0 (Open Source). If you make beneficial modifications, please release them back to the community!Penunjuk Pine Script®oleh SignalLynx3
Income Engine - Daily Supertrend Covered Call SignalsWhat This Indicator Does 1. Identifies the safest time to sell a 1-week covered call The script uses the Daily Supertrend as a primary trend filter. When the trend turns bearish or weak, the indicator highlights a Sell Zone, signaling a statistically safer window to sell a covered call. Covered calls perform best when price is: Sideways Weak Trending down Not likely to surge upward The Sell Zone captures exactly this behavior. Green line=Let the stock run. Red line=safe to sell calls without assignment. Gererate income while stock falters.Penunjuk Pine Script®oleh srhightower45341113
[CASH] Crypto And Stocks Helper (MultiPack w. Alerts)ATTENTION! I'm not a good scripter. I have just learned a little basics for this project, stolen code from other public scripts and modified it, and gotten help from AI LLM's. If you want recognition from stolen code please tell me to give you the credit you deserve. The script is not completely finished yet and contains alot of errors but my friends and family wants access so I made it public. _________________________________________________________________________________ CASH has multiple indicators (a true all-in-one multipack), guides and alerts to help you make better trades/investments. It has: - Bitcoin Bull Market Support Band - Dollar Volume - 5 SMA and 5 EMA - HODL Trend (a.k.a SuperTrend) indicator - RSI, Volume and Divergence indicators w. alerts More to come as well, like Backburner and a POC line from Volume Profile. Everything is fully customizable, appearance and off/on etc. More information and explainations along with my guides you can find in settings under "Input" and "Style". Penunjuk Pine Script®oleh SenorBufoAlvariusTelah dikemas kini 17
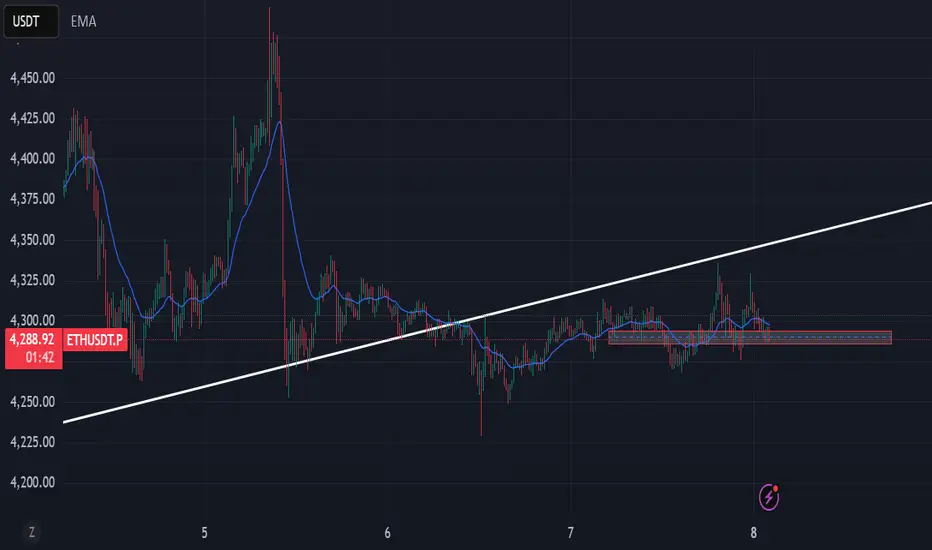
Trend Rider EMA9/21 + SuperTrend (EN)Trend Rider EMA9/21 + SuperTrend (EN) helps you watch ema 9 and 21 together for a trend.Penunjuk Pine Script®oleh jaxsoulspa27
Positional Supertrend Strategy (1D Filter + 2H Entry)Positional Supertrend Strategy (1D Filter + 2H Entry)Strategi Pine Script®oleh phantomscharts74
EMA 9/15/45 + MACD Confirm + SupertrendThis indicator uses EMA 9, 15, 45 days along with combination of MACD and SupertrendPenunjuk Pine Script®oleh everydaytradingco40
Awesome SuperTrend Zone Dynamic Alerts// created by © OmegaTools, upgrade to v6 and alert condition added //@version=6 Awesome SuperTrend Zone Alerts with dynamic alertsPenunjuk Pine Script®oleh shanu_hoosenTelah dikemas kini 28
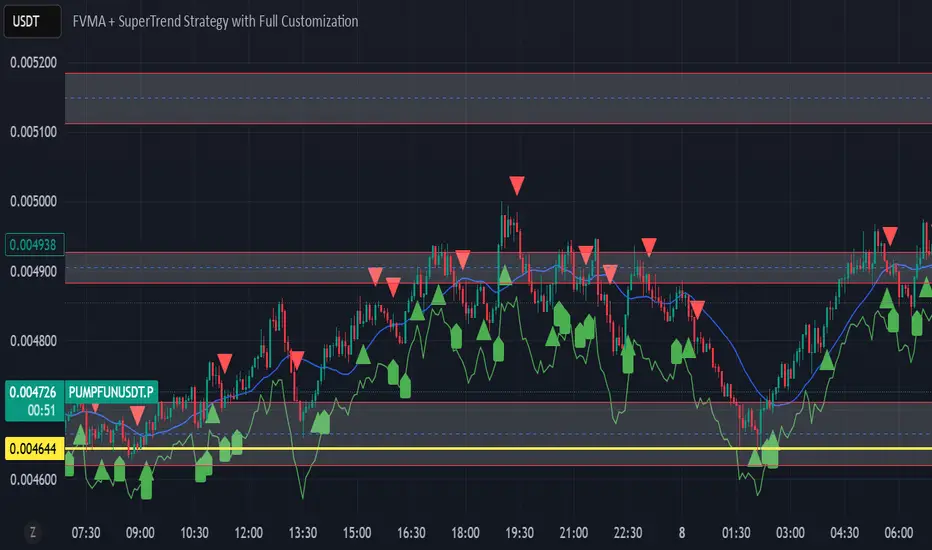
FVMA + SuperTrend + top and bottom Strategy Full CustomizationFVMA + SuperTrend + top and bottom Strategy Full CustomizationPenunjuk Pine Script®oleh MGLU30
FVMA + SuperTrend Strategythis code is using a combination of 2 indicators, whcih are FVMA and the SuperTrend . Penunjuk Pine Script®oleh MGLU2
VWAP Price ChannelVWAP Price Channel cuts the crust off of a traditional price channel (Donchian Channel) by anchoring VWAPs at the highs and lows. By doing this, the flat levels, characteristic of traditional Donchian Channels, are no more! Author's Note: This indicator is formed with no inherent use, and serves solely as a thought experiment. > Concept I would be hesitant to call this a "predictive" indicator, however the behavior of it would suggest it could be considered at least partially predictive Essentially, the Anchored VWAPs creates something from otherwise nothing. While the DC upper or lower values are staying flat, the VWAPs improvise based on price and volume to project a level that may be a better representation of where future highs or lows may settle. Visually, this looks like we have cut off the corners of the Donchian Channel. Note: Notice how we are calculating values before the corners are realized. > Implementation While this is only a concept indicator, The specific application I've gone with for this, is a sort of supertrend-ish display (A Trend Flipping Trailing Stop Loss). The script uses basic logic to create a trend direction, and then displays the Anchored VWAPs as a form of trailing stop loss. While "In Trend", the script fills in the area between the VWAP and Price in the direction of trend. When new highs or lows are made while in trend, the opposite VWAP will start to generate at the new highs or lows. These happen on every new high or low, so they are not indicating the trend shift, but could be interpreted as breakout levels for the current trend direction in order for continuation. Note: All values are drawn live, but when using higher timeframes, there is a natural calculation discrepancy when using live data vs. historical. > Technicals In this script, I'm simply detecting new highs or lows from the DC and using those as the anchor frequency on the built-in VWAP function. So each time a new high or low is made based on DC, the VWAP function re-anchors to the high or low of the candle. Past that, I have implemented some logic in order to account for a common occurrence I faced during development. Frequently, the price would outpace the anchored VWAP, so we would end up with the VWAP being further from price than the actual DC upper or lower. Due to this, what I have ended up with was a third value which, rather than switching between raw VWAP values and DC values, it adjusts the value based on the change in the VWAP value. This can be simply thought of as a "Start + Change" type of setup. By doing this, I can use the change values from the actual anchored VWAP, and under normal conditions, this will also be the true VWAP value. However, situationally, I am able to update the start value which we're applying the VWAP change to. In other words, when these situations happen, the VWAP change is added to the new (closer to price) DC value. The specific trend logic being used is nothing fancy at all, we are simply checking if a new high or low is created and setting the trend in that direction. This is in line with some traditional DC Strategies. To those who made it here, Just remember: The chart may be ugly, but it's the fastest analysis of the data you can get. Nicer displays often come at the hidden cost of latency. You have to shoot your shot to make it. Choose 2: Fast, Clean, Useful Enjoy!Penunjuk Pine Script®oleh SamRecioTelah dikemas kini 2323 2.8 K
EMAS + SuperTrend+ Key Levels SpacemanBTC IDWMEma 200 800 supertrend and key levels. Thanks to spaceman for making the code available.Penunjuk Pine Script®oleh FilRex2231
🔍 Confirmed Scalping Signals (Stoch+EMA+Supertrend)🔍 Confirmed Scalping Signals (Stoch+EMA+Supertrend)Penunjuk Pine Script®oleh shaonahamed65385
SOXL Trend Surge v3.0.2 – Profit-Only RunnerSOXL Trend Surge v3.0.2 – Profit-Only Runner This is a trend-following strategy built for leveraged ETFs like SOXL, designed to ride high-momentum waves with minimal interference. Unlike most short-term scalping scripts, this model allows trades to develop over multiple days to even several months, capitalizing on the full power of extended directional moves — all without using a stop-loss. 🔍 How It Works Entry Logic: Price is above the 200 EMA (long-term trend confirmation) Supertrend is bullish (momentum confirmation) ATR is rising (volatility expansion) Volume is above its 20-bar average (liquidity filter) Price is outside a small buffer zone from the 200 EMA (to avoid whipsaws) Trades are restricted to market hours only (9 AM to 2 PM EST) Cooldown of 15 bars after each exit to prevent overtrading Exit Strategy: Takes partial profit at +2× ATR if held for at least 2 bars Rides the remaining position with a trailing stop at 1.5× ATR No hard stop-loss — giving space for volatile pullbacks ⚙️ Strategy Settings Initial Capital: $500 Risk per Trade: 100% of equity (fully allocated per entry) Commission: 0.1% Slippage: 1 tick Recalculate after order is filled Fill orders on bar close Timeframe Optimized For: 45-minute chart These parameters simulate an aggressive, high-volatility trading model meant for forward-testing compounding potential under realistic trading costs. ✅ What Makes This Unique No stop-loss = fewer premature exits Partial profit-taking helps lock in early wins Trailing logic gives room to ride large multi-week moves Uses strict filters (volume, ATR, EMA bias) to enter only during high-probability windows Ideal for leveraged ETF swing or position traders looking to hold longer than the typical intraday or 2–3 day strategies ⚠️ Important Note This is a high-risk, high-reward strategy meant for educational and testing purposes. Without a stop-loss, trades can experience deep drawdowns that may take weeks or even months to recover. Always test thoroughly and adjust position sizing to suit your risk tolerance. Past results do not guarantee future returns. Backtest range: May 8, 2020 – May 23, 2025Strategi Pine Script®oleh MrStockaton95
Multi-Indicator Swing [TIAMATCRYPTO]v6# Strategy Description: ## Multi-Indicator Swing This strategy is designed for swing trading across various markets by combining multiple technical indicators to identify high-probability trading opportunities. The system focuses on trend strength confirmation and volume analysis to generate precise entry and exit signals. ### Core Components: - **Supertrend Indicator**: Acts as the primary trend direction filter with optimized settings (Factor: 3.0, ATR Period: 10) to balance responsiveness and reliability. - **ADX (Average Directional Index)**: Confirms the strength of the prevailing trend, filtering out sideways or choppy market conditions where the strategy avoids taking positions. - **Liquidity Delta**: A volume-based indicator that analyzes buying and selling pressure imbalances to validate trend direction and potential reversals. - **PSAR (Optional)**: Can be enabled to add additional confirmation for trend changes, turned off by default to reduce signal filtering. ### Key Features: - **Flexible Direction Trading**: Choose between long-only, short-only, or bidirectional trading to adapt to market conditions or account restrictions. - **Conservative Risk Management**: Implements fixed percentage-based stop losses (default 2%) and take profits (default 4%) for a positive risk-reward ratio. - **Realistic Backtesting Parameters**: Includes commission (0.1%) and slippage (2 points) to reflect real-world trading conditions. - **Visual Signals**: Clear buy/sell arrows with customizable sizes for easy identification on the chart. - **Information Panel**: Dynamic display showing active indicators and current risk settings. ### Best Used On: Daily timeframes for cryptocurrencies, forex, or stock indices. The strategy performs optimally on assets with clear trending behavior and sufficient volatility. ### Default Settings: Optimized for conservative position sizing (5% of equity per trade) with an initial capital of $10,000. The backtesting period (2021-2023) provides a statistically significant sample of varied market conditions. Strategi Pine Script®oleh TiamatCrypto107
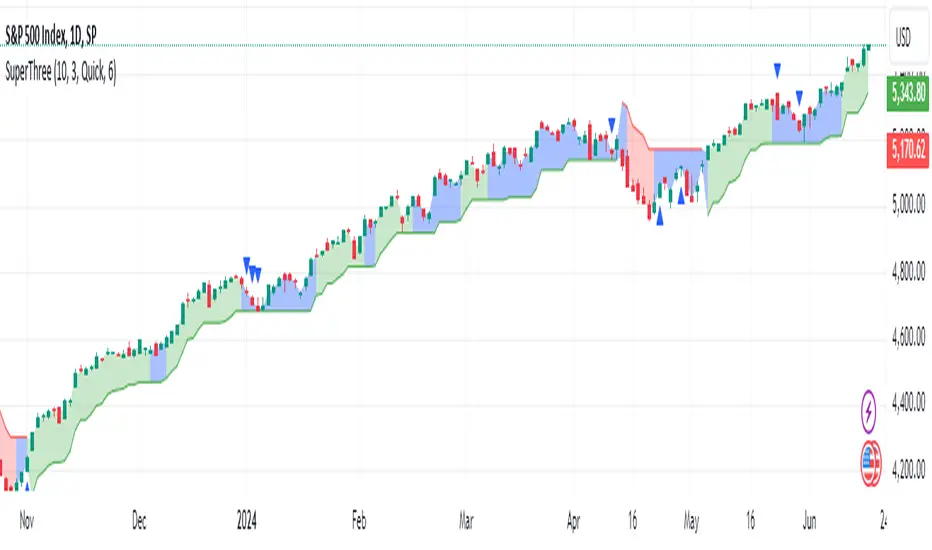
SuperThreeThe SuperThree is a comprehensive technical indicator designed to identify and visualize market trends and counter-trend momentum in trading. It uses a unique color-coding system to represent different market conditions and potential trading opportunities. Uptrend (Green Fill) : This is indicated by a green fill. An uptrend is a period where prices are increasing overall, suggesting a strong market. It’s an ideal time for traders to consider entering long positions or exiting short positions. Downtrend (Red Fill) : This is represented by a red fill. A downtrend is a period where prices are decreasing overall, indicating a bearish market. Traders might consider entering short positions or exiting long positions during this phase. Sideways Trend (Blue Fill) : This is shown by a blue fill. A sideways trend, also known as a horizontal trend, is when the price is relatively stable and not making significant upward or downward movements. It’s often a period of consolidation before the price moves up or down. Counter-Trend Momentum (Blue Arrows) : Blue arrows indicate counter-trend momentum, which can be a signal to exit trades or look for potential trend reversals. These are crucial points where the market’s momentum is shifting and may be about to move in the opposite direction. The SuperThree indicator is an enhancement of the Supertrend indicator, providing additional features and visual cues to help traders make informed decisions. However, like all indicators, it should be used in conjunction with other forms of analysis to confirm signals and avoid potential false positives. Always consider your risk tolerance and investment goals before making trading decisions. Happy trading! 😊Penunjuk Pine Script®oleh AnishManisseryTelah dikemas kini 22162