Momentum_EMABand📢 Reposting Notice
I am reposting this script because my earlier submission was hidden due to description requirements under TradingView’s House Rules. This updated version fully explains the originality, the reason for combining these indicators, and how they work together. Follow me for future updates and refinements.
🆕 Momentum EMA Band, Rule-Based System
Momentum EMA Band is not just a mashup — it is a purpose-built trading tool for intraday traders and scalpers that integrates three complementary technical concepts into a single rules-based breakout & retest framework.
Originality comes from the specific sequence and interaction of these three filters:
Supertrend → Sets directional bias.
EMA Band breakout with retest logic → Times precise entries.
ADX filter → Confirms momentum strength and avoids noise.
This system is designed to filter out weak setups and false breakouts that standalone indicators often fail to avoid.
🔧 How the Indicator Works — Combined Logic
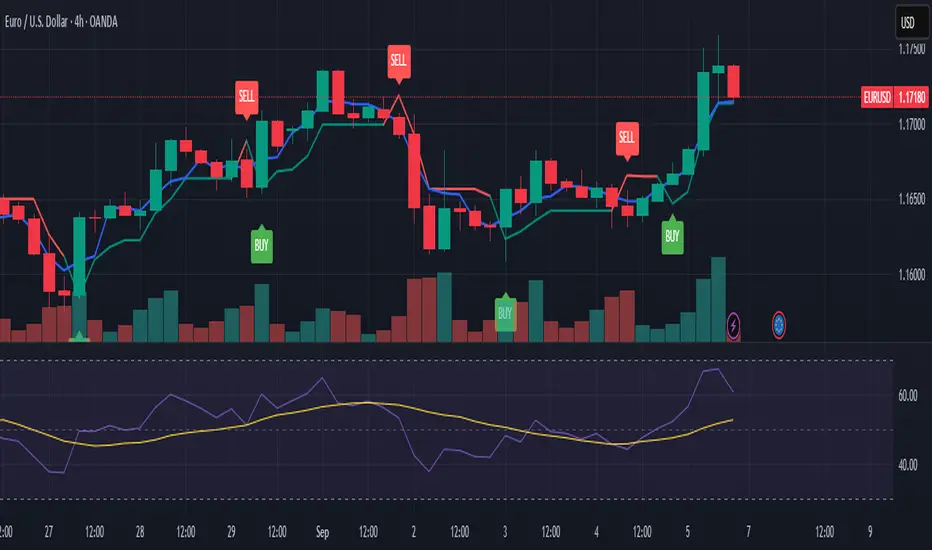
1️⃣ EMA Price Band — Dynamic Zone Visualization
Plots upper & lower EMA bands (default: 9-period EMA).
Green Band → Price above upper EMA = bullish momentum
Red Band → Price below lower EMA = bearish pressure
Yellow Band → Price within band = neutral zone
Acts as a consolidation zone and breakout trigger level.
2️⃣ Supertrend Overlay — Reliable Trend Confirmation
ATR-based Supertrend adapts to volatility:
Green Line = Uptrend bias
Red Line = Downtrend bias
Ensures trades align with the prevailing trend.
3️⃣ ADX-Based No-Trade Zone — Choppy Market Filter
Manual ADX calculation (default: length 14).
If ADX < threshold (default: 20) and price is inside EMA Band → gray background marks low-momentum zones.
🧩 Why This Mashup Works
Supertrend confirms trend direction.
EMA Band breakout & retest validates the breakout’s strength.
ADX ensures the market has enough trend momentum.
When all align, entries are higher probability and whipsaws are reduced.
📈 Example Trade Walkthrough
Scenario: 5-minute chart, ADX threshold = 20.
Supertrend turns green → trend bias is bullish.
Price consolidates inside the yellow EMA Band.
ADX rises above 20 → trend momentum confirmed.
Price closes above the green EMA Band after retesting the band as support.
Entry triggered on candle close, stop below band, target based on risk-reward.
Exit when Supertrend flips red or ADX momentum drops.
This sequence prevents premature entries, keeps trades aligned with trend, and avoids ranging markets.
🎯 Key Features
✅ Multi-layered confirmation for precision trading
✅ Built-in no-trade zone filter
✅ Fully customizable parameters
✅ Clean visuals for quick decision-making
⚠ Disclaimer: This is Version 1. Educational purposes only. Always use with risk management.
Penunjuk Pine Script®