MTC – Multi-Timeframe Trend Confirmator V2MTC – Multi-Timeframe Trend Confirmator V2
A comprehensive trend analysis indicator that systematically combines six technical indicators across three customizable timeframes, using a weighted scoring system to identify high-probability trend conditions.
ORIGINALITY AND CONCEPT
This indicator is original in its approach to multi-timeframe trend confirmation. Rather than relying on a single indicator or timeframe, it creates a composite score by evaluating six different technical conditions simultaneously across three timeframes. The scoring system weighs certain indicators more heavily based on their reliability in trend identification. The visual gauge provides an at-a-glance view of trend alignment across timeframes, making it easier to identify when multiple timeframes agree - a condition that typically produces stronger, more reliable trends.
HOW IT WORKS - DETAILED SCORING METHODOLOGY
The indicator evaluates six technical conditions on each timeframe. Each condition contributes to a composite score:
EMA 200 (Weight: 1 point)
Bullish: Price closes above EMA 200 (+1)
Bearish: Price closes below EMA 200 (-1)
Rationale: Long-term trend direction
SMA 50/200 Crossover (Weight: 1 point)
Bullish: SMA 50 above SMA 200 (+1)
Bearish: SMA 50 below SMA 200 (-1)
Rationale: Golden/Death cross confirmation
RSI 14 (Weight: 1 point)
Bullish: RSI above 55 (+1)
Bearish: RSI below 45 (-1)
Neutral: RSI between 45-55 (0)
Rationale: Momentum filter with buffer zone to avoid chop
MACD (12,26,9) (Weight: 1 point)
Bullish: MACD line above signal line (+1)
Bearish: MACD line below signal line (-1)
Rationale: Trend momentum confirmation
ADX 14 (Weight: 2 points - DOUBLE WEIGHTED)
Requires ADX above 25 to activate
Bullish: DI+ above DI- and ADX > 25 (+2)
Bearish: DI- above DI+ and ADX > 25 (-2)
Neutral: ADX below 25 (0)
Rationale: Trend strength filter - only counts when a strong trend exists. Double weighted because ADX is specifically designed to measure trend strength, making it more reliable than oscillators.
Supertrend (Factor: 3.0, ATR Period: 10) (Weight: 2 points - DOUBLE WEIGHTED)
Bullish: Direction indicator = -1 (+2)
Bearish: Direction indicator = +1 (-2)
Rationale: Dynamic support/resistance that adapts to volatility. Double weighted because Supertrend provides clear, objective trend signals with built-in stop-loss levels.
COMPOSITE SCORE CALCULATION:
Total possible score range: -10 to +10 points
Score interpretation:
Score > 2: UPTREND (majority of indicators bullish, especially weighted ones)
Score < -2: DOWNTREND (majority of indicators bearish, especially weighted ones)
Score between -2 and +2: NEUTRAL/RANGING (mixed signals or weak trend)
The threshold of +/- 2 was chosen because it requires more than just basic agreement - it typically means at least 3-4 indicators align, or that the heavily-weighted indicators (ADX, Supertrend) confirm the direction.
MULTI-TIMEFRAME LOGIC:
The indicator calculates the composite score independently for three timeframes:
Higher Timeframe (default: 4H) - Major trend direction
Mid Timeframe (default: 1H) - Intermediate trend
Lower Timeframe (default: 15min) - Entry timing
Main Trend Confirmation Rule:
The indicator only signals a confirmed trend when BOTH the higher timeframe AND mid timeframe scores agree (both > 2 for uptrend, or both < -2 for downtrend). This dual-timeframe confirmation significantly reduces false signals during choppy or ranging markets.
HOW TO USE IT
Setup:
Add indicator to chart
Customize timeframes based on your trading style:
Scalpers: 15min, 5min, 1min
Day traders: 4H, 1H, 15min (default)
Swing traders: Daily, 4H, 1H
Toggle individual indicators on/off based on your preference
Adjust Supertrend parameters if needed for your instrument's volatility
Reading the Gauge (Top Right Corner):
Each row shows one timeframe
Left column: Timeframe label
Middle column: Visual strength bars (10 bars = maximum score)
Green bars = Bullish score
Red bars = Bearish score
Yellow bars = Neutral/ranging
More filled bars = stronger trend
Right column: Numerical score
Trading Signals:
Entry Signals:
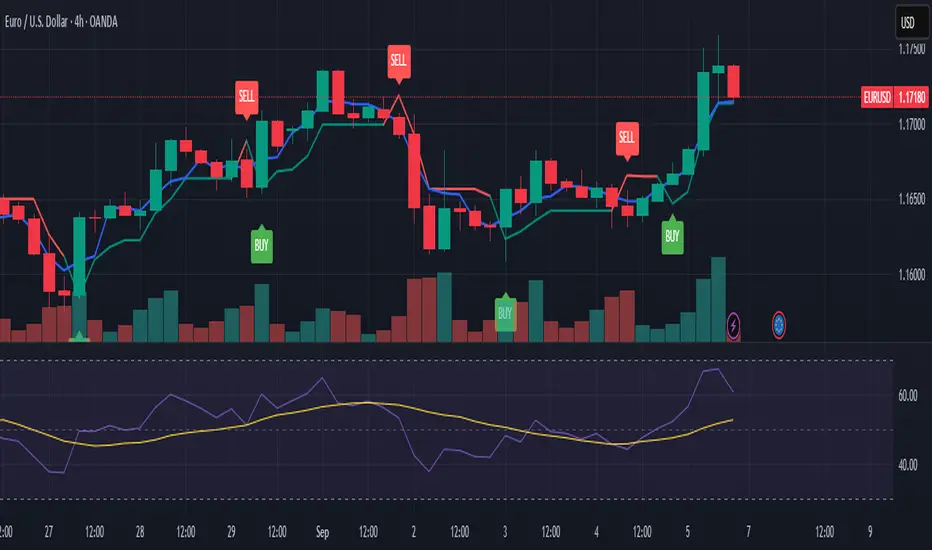
Long Entry: Wait for upward triangle arrow (appears when higher + mid TF both bullish)
Confirm gauge shows green bars on higher and mid timeframes
Lower timeframe should ideally turn green for entry timing
Chart background tints light green
Short Entry: Wait for downward triangle arrow (appears when higher + mid TF both bearish)
Confirm gauge shows red bars on higher and mid timeframes
Lower timeframe should ideally turn red for entry timing
Chart background tints light red
Position Management:
Stay in position while higher and mid timeframes remain aligned
Consider reducing position size when mid timeframe score weakens
Exit when higher timeframe trend reverses (daily label changes)
Avoiding False Signals:
Ignore signals when gauge shows mixed colors across timeframes
Avoid trading when scores are close to threshold (+/- 2 to +/- 4 range)
Best trades occur when all three timeframes align (all green or all red in gauge)
Use the numerical scores: higher absolute values (7-10) indicate stronger, more reliable trends
Practical Examples:
Example 1 - Strong Uptrend Entry:
Higher TF: +8 (strong green bars)
Mid TF: +6 (strong green bars)
Lower TF: +4 (moderate green bars)
Action: Look for long entries on lower timeframe pullbacks
Background is tinted green, upward arrow appears
Example 2 - Ranging Market (Avoid):
Higher TF: +3 (weak green)
Mid TF: -1 (weak red)
Lower TF: +2 (neutral yellow)
Action: Stay out, wait for alignment
Example 3 - Trend Reversal Warning:
Higher TF: +7 (still green)
Mid TF: -3 (turned red)
Lower TF: -5 (strong red)
Action: Consider exiting longs, prepare for potential higher TF reversal
Customization Options:
Timeframes: Adjust all three to match your trading horizon
Indicator Toggles: Disable indicators that don't suit your instrument:
Disable RSI for highly volatile crypto markets
Disable SMA crossover for range-bound instruments
Keep ADX and Supertrend enabled for trending markets
Visual Preferences:
Arrow size: 5 options from Tiny to Huge
Gauge size: Small/Medium/Large for different screen sizes
Toggle arrows on/off if you only want the gauge
Alert Setup:
Right-click chart, "Add Alert"
Condition: MTC v6 - UPTREND or DOWNTREND
Get notified when multi-timeframe confirmation occurs
Best Practices:
Use with Price Action: The indicator works best when combined with support/resistance levels, chart patterns, and volume analysis
Risk Management: Even with multi-timeframe confirmation, always use stop losses
Market Context: Works best in trending markets; less reliable in strong consolidation
Backtesting: Test the default settings on your specific instrument and timeframe before live trading
Patience: Wait for full multi-timeframe alignment rather than taking premature signals
Technical Notes:
All calculations use Pine Script's security function to fetch data from multiple timeframes
Prevents repainting by using confirmed bar data
Gauge updates in real-time on the last bar
Daily labels mark at the open of each new daily candle
Works on all instruments and timeframes
This indicator is ideal for traders who want objective, systematic trend identification without the complexity of analyzing multiple indicators manually across different timeframes.
-NATANTIA
Penunjuk Pine Script®