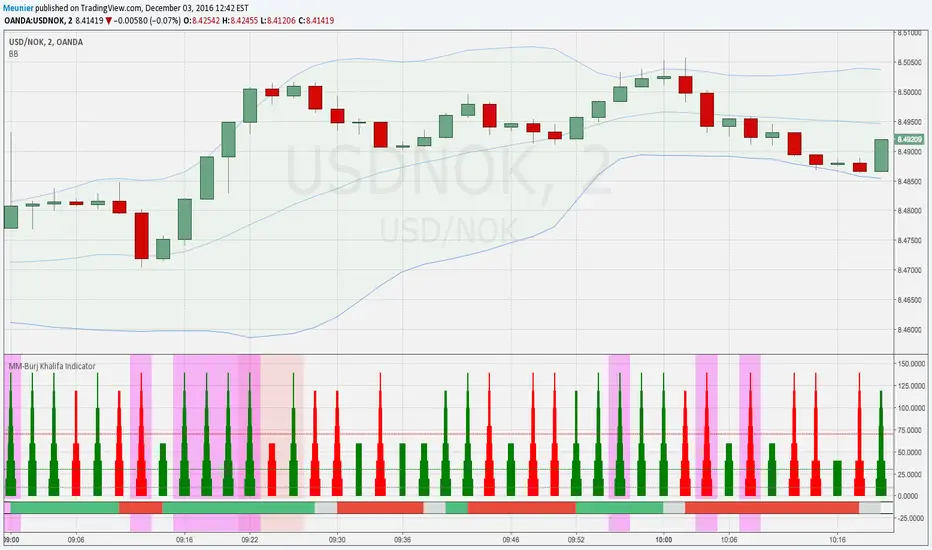
MM-Burj Khalifa Indicator
This indicator uses several signals to visualize a "perfect candle" to enter a trade.
It colors the background to identify the zones of interest (multiple configurable high or low RSI zones). Underlying is a trendbar with the current MACD direction. It's possible to tweak the indicator with a lot of options in the settings section (e.g. for which period you want a rising DM+-signal, etc.)
The indicator is using signals of:
--MACD
--RSI
--PVT
--ATR
--AD and DMI+/DMI-
When all 7 criterias are met it highlights the candle.
It also creates different colums with different height and width, so that you can see which signal is OK and which is maybe missing. When all signals are on GO you'll see a Burj-Khalifa-like figure. If not all signals are on GO you'see crippled versions.
To be clear:
it's not intended to detect trends or supertrends or reversals. It's purpose it's just to decide if this current candle is really going in the right direction. It doesn't prevent upcoming reversals in the opposite direction.
The Burj-Khalifa indicator could help to confirm the entry point of an trade which was already planned.
I'll come up with a more detailed documentation.
Cari dalam skrip untuk "supertrend"
MM-Burj Khalifa IndicatorThis indicator uses several signals to visualize a "perfect candle" to enter a trade.
It colors the background to identify the zones of interest (multiple configurable high or low RSI zones). Underlying is a trendbar with the current MACD direction.
The indicator is using signals of:
--MACD
--RSI
--PVT
--ATR
--AD and DMI+/DMI-
When all 7 criterias are met it highlights the candle.
It also creates different colums with different height and width, so that you can see which signal is OK and which is maybe missing. When all signals are on GO you'll see a Burj-Khalifa-like figure. If not all signals are on GO you'see crippled versions.
To be clear:
it's not intended to detect trends or supertrends or reversals. It's purpose it's just to decide if this current candle is really going in the right direction.
The Burj-Khalifa indicator could help to confirm the entry point of an trade which was already planned.

AOT Red Storm V25 Adaptive EditionOverview
AOT Red Storm V25 is an invite-only, institutional-style trend suite designed for intraday and swing traders.
It does not try to predict exact tops or bottoms. Instead, it focuses on:
Multi-timeframe trend alignment
Smart 8-minute internal timeframe for cleaner structure
Adaptive support/resistance zones
Volatility and volume-based risk filtering
A compact HUD to summarize market state in one glance
Core Components
This script is not a simple mashup of public indicators.
It integrates several classic building blocks into a single, coherent decision framework:
Adaptive Supertrend Core:
Supertrend is calculated on an internal 8-minute timeframe (for intraday charts up to 60m), which we found offers a better balance between noise and structure for crypto futures.
WaveTrend Tactical Radar:
WaveTrend is only used for exit timing and risk-off zones (overheat / exhaustion), not as a standalone entry trigger. It works together with the trend core and cooldown logic.
Dual-Layer Support & Resistance:
Local SR zones are drawn on the current chart for execution precision, while 30m-level zones track higher-timeframe liquidity and turning areas.
Trendlines & Structural BOS:
Automatic trendlines and BOS (Break of Structure) are derived from pivot points, to visualize trend continuation vs. potential reversals.
Volatility & Volume Risk Filter:
Abnormal range bars and daily volume completion are monitored to help traders avoid chasing dangerous moves.
AI-style HUD Panel:
The on-chart HUD summarizes trend, momentum, volatility, and volume completion into a compact dashboard so traders don’t need to open multiple indicators.
How it works in practice
The 8-minute engine drives the main trend color and entry markers.
Local & 30m SR zones provide execution context and profit-taking areas.
WaveTrend helps identify when to reduce risk or take partial profits during extended moves.
The HUD acts as a “mission control” view to keep the trader aligned with the dominant state of the market.
Intended Use
For traders who already understand risk management and position sizing.
As a decision support tool, not as an auto-trading holy grail.
Best used on BTC/ETH futures from 1m–30m charts.
What it is NOT
It is not a guaranteed-profit system.
It is not an AI that predicts the future.
It does not replace your own risk control or psychology.
Risk Notice
Trading and investing involve risk. Historical behavior of any logic or visual structure does not guarantee future results. This script is for informational and educational purposes only and does not constitute financial advice.
概览
AOT Red Storm V25 是一套面向实盘交易员的“机构级趋势可视化套件”,采用封闭源码 + 邀请制。
它不是在“预测行情”,而是帮助你:
对齐多周期趋势结构
用 8 分钟内部周期做更干净的趋势骨架
叠加本地 + 30m 双重支撑阻力
利用波动率和成交量过滤危险行情
用一个 HUD 面板把核心信息集中展示
核心模块
8m SuperTrend 趋势骨架:内部固定使用 8 分钟周期来做趋势与结构识别,减少噪音。
WaveTrend 战术雷达:只用于辅助止盈/减仓,而不是单独进场信号。
本地 + 30m 支撑阻力区:当前周期做精确执行,30m 负责定位大级别流动性区域。
自动趋势线 + BOS:用结构高低点标记 HH/LL / BOS,辅助趋势延续与反转识别。
波动 & 量能风控:用异常大K / 当日量能进度,提示极端风险。
AI 风格 HUD 面板:把趋势、动能、波动率、量能等压缩在一个信息面板中。
适用人群
有一定交易经验,重视风控与执行纪律的交易员;
用作决策辅助,而不是“闭眼跟随”的圣杯系统;
建议用于 BTC/ETH 永续 1–30m 等周期。
不是什么
不保证稳定盈利;
不预测未来;
不替代你的仓位管理与心理建设。

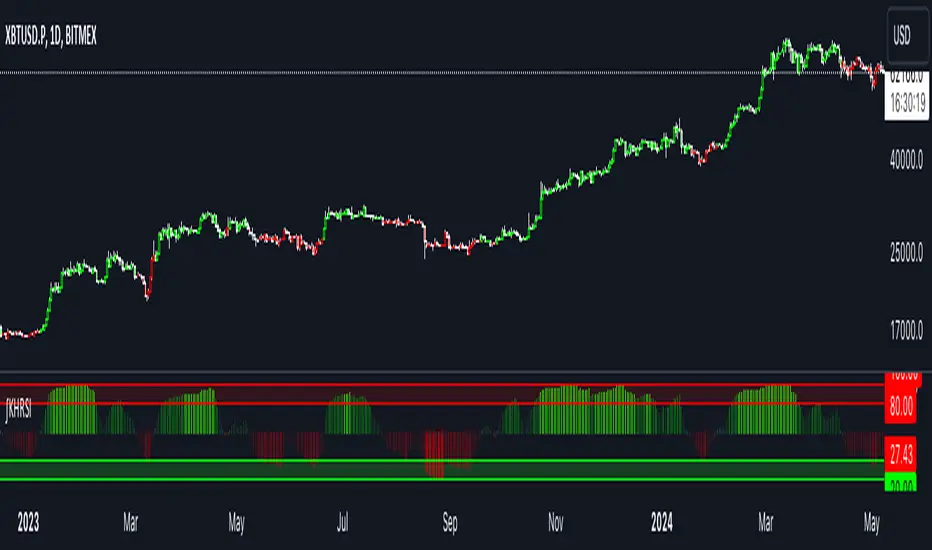
Impulse Reactor RSI-SMA Trend Indicator [ApexLegion]Impulse Reactor RSI-SMA Trend Indicator
Introduction and Theoretical Background
Design Rationale
Standard indicators frequently generate binary 'BUY' or 'SELL' signals without accounting for the broader market context. This often results in erratic "Flip-Flop" behavior, where signals are triggered indiscriminately regardless of the prevailing volatility regime.
Impulse Reactor was engineered to address this limitation by unifying two critical requirements: Quantitative Rigor and Execution Flexibility.
The Solution
Composite Analytical Framework This script is not a simple visual overlay of existing indicators. It is an algorithmic synthesis designed to function as a unified decision-making engine. The primary objective was to implement rigorous quantitative analysis (Volatility Normalization, Structural Filtering) directly within an alert-enabled framework. This architecture is designed to process signals through strict, multi-factor validation protocols before generating real-time notifications, allowing users to focus on structurally validated setups without manual monitoring.
How It Works
This is not a simple visual mashup. It utilizes a cross-validation algorithm where the Trend Structure acts as a gatekeeper for Momentum signals:
Logic over Lag: Unlike simple moving average crossovers, this script uses a 15-layer Gradient Ribbon to detect "Laminar Flow." If the ribbon is knotted (Compression), the system mathematically suppresses all signals.
Volatility Normalization: The core calculation adapts to ATR (Average True Range). This means the indicator automatically expands in volatile markets and contracts in quiet ones, maintaining accuracy without constant manual tweaking.
Adaptive Signal Thresholding: It incorporates an 'Anti-Greed' algorithm (Dynamic Thresholding) that automatically adjusts entry criteria based on trend duration. This logic aims to mitigate the risk of entering positions during periods of statistical trend exhaustion.
Why Use It?
Market State Decoding: The gradient Ribbon visualizes the underlying trend phase in real-time.
◦ Cyan/Blue Flow: Strong Bullish Trend (Laminar Flow).
◦ Magenta/Pink Flow: Strong Bearish Trend.
◦ Compressed/Knotted: When the ribbon lines are tightly squeezed or overlapping, it signals Consolidation. The system filters signals here to avoid chop.
Noise Reduction: The goal is not to catch every pivot, but to isolate high-confidence setups. The logic explicitly filters out minor fluctuations to help maintain position alignment with the broader trend.
⚖️ Chapter 1: System Architecture
Introduction: Composite Analytical Framework
System Overview
Impulse Reactor serves as a comprehensive technical analysis engine designed to synthesize three distinct market dimensions—Momentum, Volatility, and Trend Structure—into a unified decision-making framework. Unlike traditional methods that analyze these metrics in isolation, this system functions as a central processing unit that integrates disparate data streams to construct a coherent model of market behavior.
Operational Objective
The primary objective is to transition from single-dimensional signal generation to a multi-factor assessment model. By fusing data from the Impulse Core (Volatility), Gradient Oscillator (Momentum), and Structural Baseline (Trend), the system aims to filter out stochastic noise and identify high-probability trade setups grounded in quantitative confluence.
Market Microstructure Analysis: Limitations of Conventional Models
Extensive backtesting and quantitative analysis have identified three critical inefficiencies in standard oscillator-based strategies:
• Bounded Oscillator Limitations (The "Oscillation Trap"): Traditional indicators such as RSI or Stochastics are mathematically constrained between fixed values (0 to 100). In strong trending environments, these metrics often saturate in "overbought" or "oversold" zones. Consequently, traders relying on static thresholds frequently exit structurally valid positions prematurely or initiate counter-trend trades against prevailing momentum, resulting in suboptimal performance.
• Quantitative Blindness to Quality: Standard moving averages and trend indicators often fail to distinguish the qualitative nature of price movement. They treat low-volume drift and high-velocity expansion identically. This inability to account for "Volatility Quality" leads to delayed responsiveness during critical market events.
• Fractal Dissonance (Timeframe Disconnect): Financial markets exhibit fractal characteristics where trends on lower timeframes may contradict higher timeframe structures. Manual integration of multi-timeframe analysis increases cognitive load and susceptibility to human error, often resulting in conflicting biases at the point of execution.
Core Design Principles
To mitigate the aforementioned systemic inefficiencies, Impulse Reactor employs a modular architecture governed by three foundational principles:
Principle A:
Volatility Precursor Analysis Market mechanics demonstrate that volatility expansion often functions as a leading indicator for directional price movement. The system is engineered to detect "Volatility Deviation" — specifically, the divergence between short-term and long-term volatility baselines—prior to its manifestation in price action. This allows for entry timing aligned with the expansion phase of market volatility.
Principle B:
Momentum Density Visualization The system replaces singular momentum lines with a "Momentum Density" model utilizing a 15-layer Simple Moving Average (SMA) Ribbon.
• Concept: This visualization represents the aggregate strength and consistency of the trend.
• Application: A fully aligned and expanded ribbon indicates a robust trend structure ("Laminar Flow") capable of withstanding minor counter-trend noise, whereas a compressed ribbon signals consolidation or structural weakness.
Principle C:
Adaptive Confluence Protocols Signal validity is strictly governed by a multi-dimensional confluence logic. The system suppresses signal generation unless there is synchronized confirmation across all three analytical vectors:
1. Volatility: Confirmed expansion via the Impulse Core.
2. Momentum: Directional alignment via the Hybrid Oscillator.
3. Structure: Trend validation via the Baseline. This strict filtering mechanism significantly reduces false positives in non-trending (choppy) environments while maintaining sensitivity to genuine breakouts.
🔍 Chapter 2: Core Modules & Algorithmic Logic
Module A: Impulse Core (Normalized Volatility Deviation)
Operational Logic The Impulse Core functions as a volatility-normalized momentum gauge rather than a standard oscillator. It is designed to identify "Volatility Contraction" (Squeeze) and "Volatility Expansion" phases by quantifying the divergence between short-term and long-term volatility states.
Volatility Z-Score Normalization
The formula implements a custom normalization algorithm. Unlike standard oscillators that rely on absolute price changes, this logic calculates the Z-Score of the Volatility Spread.
◦ Numerator: (atr_f - atr_s) captures the raw momentum of volatility expansion.
◦ Denominator: (std_f + 1e-6) standardizes this value against historical variance.
◦ Result: This allows the indicator scales consistently across assets (e.g., Bitcoin vs. Euro) without manual recalibration.
f_impulse() =>
atr_f = ta.atr(fastLen) // Fast Volatility Baseline
atr_s = ta.atr(slowLen) // Slow Volatility Baseline
std_f = ta.stdev(atr_f, devLen) // Volatility Standard Deviation
(atr_f - atr_s) / (std_f + 1e-6) // Normalized Differential Calculation
Algorithmic Framework
• Differential Calculation: The system computes the spread between a Fast Volatility Baseline (ATR-10) and a Slow Volatility Baseline (ATR-30).
• Normalization Protocol: To standardize consistency across diverse asset classes (e.g., Forex vs. Crypto), the raw differential is divided by the standard deviation of the volatility itself over a 30-period lookback.
• Signal Generation:
◦ Contraction (Squeeze): When the Fast ATR compresses below the Slow ATR, it registers a potential volatility buildup phase.
◦ Expansion (Release): A rapid divergence of the Fast ATR above the Slow ATR signals a confirmed volatility expansion, validating the strength of the move.
Module B: Gradient Oscillator (RSI-SMA Hybrid)
Design Rationale To mitigate the "noise" and "false reversal" signals common in single-line oscillators (like standard RSI), this module utilizes a 15-Layer Gradient Ribbon to visualize momentum density and persistence.
Technical Architecture
• Ribbon Array: The system generates 15 sequential Simple Moving Averages (SMA) applied to a volatility-adjusted RSI source. The length of each layer increases incrementally.
• State Analysis:
Momentum Alignment (Laminar Flow): When all 15 layers are expanded and parallel, it indicates a robust trend where buying/selling pressure is distributed evenly across multiple timeframes. This state helps filter out premature "overbought/oversold" signals.
• Consolidation (Compression): When the distance between the fastest layer (Layer 1) and the slowest layer (Layer 15) approaches zero or the layers intersect, the system identifies a "Non-Tradable Zone," preventing entries during choppy market conditions.
// Laminar Flow Validation
f_validate_trend() =>
// Calculate spread between Ribbon layers
ribbon_spread = ta.stdev(ribbon_array, 15)
// Only allow signals if Ribbon is expanded (Laminar Flow)
is_flowing = ribbon_spread > min_expansion_threshold
// If compressed (Knotted), force signal to false
is_flowing ? signal : na
Module C: Adaptive Signal Filtering (Behavioral Bias Mitigation)
This subsystem, operating as an algorithmic "Anti-Greed" Mechanism, addresses the statistical tendency for signal degradation following prolonged trends.
Dynamic Threshold Adjustment
• Win Streak Detection: The algorithm internally tracks the outcome of closed trade cycles.
• Sensitivity Multiplier: Upon detecting consecutive successful signals in the same direction, a Penalty_Factor is applied to the entry logic.
• Operational Impact: This effectively raises the Required_Slope threshold for subsequent signals. For example, after three consecutive bullish signals, the system requires a 30% steeper trend angle to validate a fourth entry. This enforces stricter discipline during extended trends to reduce the probability of entering at the point of trend exhaustion.
Anti-Greed Logic: Dynamic Threshold Calculation
f_adjust_threshold(base_slope, win_streak) =>
// Adds a 10% penalty to the difficulty for every consecutive win
penalty_factor = 0.10
risk_scaler = 1 + (win_streak * penalty_factor)
// Returns the new, harder-to-reach threshold
base_slope * risk_scaler
Module D: Trend Baseline (Triple-Smoothed Structure)
The Trend Baseline serves as the structural filter for all signals. It employs a Triple-Smoothed Hybrid Algorithm designed to balance lag reduction with noise filtration.
Smoothing Stages
1. Volatility Banding: Utilizes a SuperTrend-based calculation to establish the upper and lower boundaries of price action.
2. Weighted Filter: Applies a Weighted Moving Average (WMA) to prioritize recent price data.
3. Exponential Smoothing: A final Exponential Moving Average (EMA) pass is applied to create a seamless baseline curve.
Functionality
This "Heavy" baseline resists minor intraday volatility spikes while remaining responsive to sustained structural shifts. A signal is only considered valid if the price action maintains structural integrity relative to this baseline
🚦 Chapter 3: Risk Management & Exit Protocols
Quantitative Risk Management (TP/SL & Trailing)
Foundational Architecture: Volatility-Adjusted Geometry Unlike strategies relying on static nominal values, Impulse Reactor establishes dynamic risk boundaries derived from quantitative volatility metrics. This design aligns trade invalidation levels mathematically with the current market regime.
• ATR-Based Dynamic Bracketing:
The protocol calculates Stop-Loss and Take-Profit levels by applying Fibonacci coefficients (Default: 0.786 for SL / 1.618 for TP) to the Average True Range (ATR).
◦ High Volatility Environments: The risk bands automatically expand to accommodate wider variance, preventing premature exits caused by standard market noise.
◦ Low Volatility Environments: The bands contract to tighten risk parameters, thereby dynamically adjusting the Risk-to-Reward (R:R) geometry.
• Close-Validation Protocol ("Soft Stop"):
Institutional algorithms frequently execute liquidity sweeps—driving prices briefly below key support levels to accumulate inventory.
◦ Mechanism: When the "Soft Stop" feature is enabled, the system filters out intraday volatility spikes. The stop-loss is conditional; execution is triggered only if the candle closes beyond the invalidation threshold.
◦ Strategic Advantage: This logic distinguishes between momentary price wicks and genuine structural breakdowns, preserving positions during transient volatility.
• Step-Function Trailing Mechanism:
To protect unrealized PnL while allowing for normal price breathing, a two-phase trailing methodology is employed:
◦ Phase 1 (Activation): The trailing function remains dormant until the price advances by a pre-defined percentage threshold.
◦ Phase 2 (Dynamic Floor): Once armed, the stop level creates a moving floor, adjusting relative to price action while maintaining a volatility-based (ATR) buffer to systematically protect unrealized PnL.
• Algorithmic Exit Protocols (Dynamic Liquidity Analysis)
◦ Rationale: Inefficiencies of Static Targets Static "Take Profit" levels often result in suboptimal exits. They compel traders to close positions based on arbitrary figures rather than evolving market structure, potentially capping upside during significant trends or retaining positions while the underlying trend structure deteriorates.
◦ Solution: Structural Integrity Assessment The system utilizes a Dynamic Liquidity Engine to continuously audit the validity of the position. Instead of targeting a specific price point, the algorithm evaluates whether the trend remains statistically robust.
Multi-Factor Exit Logic (The Tri-Vector System)
The Smart Exit protocol executes only when specific algorithmic invalidation criteria are met:
• 1. Momentum Exhaustion (Confluence Decay): The system monitors a 168-hour rolling average of the Confluence Score. A significant deviation below this historical baseline indicates momentum exhaustion, signaling that the driving force behind the trend has dissipated prior to a price reversal. This enables preemptive exits before a potential drawdown.
• 2. Statistical Over-Extension (Mean Reversion): Utilizing the core volatility logic, the system identifies instances where price deviates beyond 2.0 standard deviations from the mean. While the trend may be technically bullish, this statistical anomaly suggests a high probability of mean reversion (elastic snap-back), triggering a defensive exit to capitalize on peak valuation.
• 3. Oscillator Rejection (Immediate Pivot): To manage sudden V-shaped volatility, the system monitors RSI pivots. If a sharp "Pivot High" or divergence is detected, the protocol triggers an immediate "Peak Exit," bypassing standard trend filters to secure liquidity during high-velocity reversals.
🎨 Chapter 4: Visualization Guide
Gradient Oscillator Ribbon
The 15-layer SMA ribbon visualized via plot(r1...r15) represents the "Momentum Density" of the market.
• Visuals:
◦ Cyan/Blue Ribbon: Indicates Bullish Momentum.
◦ Pink/Magenta Ribbon: Indicates Bearish Momentum.
• Interpretation:
◦ Laminar Flow: When the ribbon expands widely and flows in parallel, it signifies a robust trend where momentum is distributed evenly across timeframes. This is the ideal state for trend-following.
◦ Compression (Consolidation): If the ribbon becomes narrow, twisted, or knotted, it indicates a "Non-Tradable Zone" where the market lacks a unified direction. Traders are advised to wait for clarity.
◦ Over-Extension: If the top layer crosses the Overbought (85) or Oversold (15) lines, it visually warns of potential market overheating.
Trend Baseline
The thick, color-changing line plotted via plot(baseline) represents the Structural Backbone of the market.
• Visuals: Changes color based on the trend direction (Blue for Bullish, Pink for Bearish).
• Interpretation:
Structural Filter: Long positions are statistically favored only when price action sustains above this baseline, while short positions are favored below it.
Dynamic Support/Resistance: The baseline acts as a dynamic support level during uptrends and resistance during downtrends.
Entry Signals & Labels
Text labels ("Long Entry", "Short Entry") appear when the system detects high-probability setups grounded in quantitative confluence.
• Visuals: Labeled signals appear above/below specific candles.
• Interpretation:
These signals represent moments where Volatility (Expansion), Momentum (Alignment), and Structure (Trend) are synchronized.
Smart Exit: Labels such as "Smart Exit" or "Peak Exit" appear when the system detects momentum exhaustion or structural decay, prompting a defensive exit to preserve capital.
Dynamic TP/SL Boxes
The semi-transparent colored zones drawn via fill() represent the risk management geometry.
• Visuals: Colored boxes extending from the entry point to the Take Profit (TP) and Stop Loss (SL) levels.
• Function:
Volatility-Adjusted Geometry: Unlike static price targets, these boxes expand during high volatility (to prevent wicks from stopping you out) and contract during low volatility (to optimize Risk-to-Reward ratios).
SAR + MACD Glow
Small glowing shapes appearing above or below candles.
• Visuals: Triangle or circle glows near the price bars.
• Interpretation:
This visual indicates a secondary confirmation where Parabolic SAR and MACD align with the main trend direction. It serves as an additional confluence factor to increase confidence in the trade setup.
Support/Resistance Table
A small table located at the bottom-right of the chart.
• Function: Automatically identifies and displays recent Pivot Highs (Resistance) and Pivot Lows (Support).
• Interpretation: These levels can be used as potential targets for Take Profit or invalidation points for manual Stop Loss adjustments.
🖥️ Chapter 5: Dashboard & Operational Guide
Integrated Analytics Panel (Dashboard Overview)
To facilitate rapid decision-making without manual calculation, the system aggregates critical market dimensions into a unified "Heads-Up Display" (HUD). This panel monitors real-time metrics across multiple timeframes and analytical vectors.
A. Intermediate Structure (12H Trend)
• Function: Anchors the intraday analysis to the broader market structure using a 12-hour rolling window.
• Interpretation:
◦ Bullish (> +0.5%): Indicates a positive structural bias. Long setups align with the macro flow.
◦ Bearish (< -0.5%): Indicates structural weakness. Short setups are statistically favored.
◦ Neutral: Represents a ranging environment where the Confluence Score becomes the primary weighting factor.
B. Composite Confluence Score (Signal Confidence)
• Definition: A probability metric derived from the synchronization of Volatility (Impulse Core), Momentum (Ribbon), and Trend (Baseline).
• Grading Scale:
Strong Buy/Sell (> 7.0 / < 3.0): Indicates full alignment across all three vectors. Represents a "Prime Setup" eligible for standard position sizing.
Buy/Sell (5.0–7.0 / 3.0–5.0): Indicates a valid trend but with moderate volatility confirmation.
Neutral: Signals conflicting data (e.g., Bullish Momentum vs. Bearish Structure). Trading is not recommended ("No-Trade Zone").
C. Statistical Deviation Status (Mean Reversion)
• Logic: Utilizes Bollinger Band deviation principles to quantify how far price has stretched from the statistical mean (20 SMA).
• Alert States:
Over-Extended (> 2.0 SD): Warning that price is statistically likely to revert to the mean (Elastic Snap-back), even if the trend remains technically valid. New entries are discouraged in this zone.
Normal: Price is within standard distribution limits, suitable for trend-following entries.
D. Volatility Regime Classification
• Metric: Compares current ATR against a 100-period historical baseline to categorize the market state.
• Regimes:
Low Volatility (Lvl < 1.0): Market Compression. Often precedes volatility expansion events.
Mid Volatility (Lvl 1.0 - 1.5): Standard operating environment.
High Volatility (Lvl > 1.5): Elevated market stress. Risk parameters should be adjusted (e.g., reduced position size) to account for increased variance.
E. Performance Telemetry
• Function: Displays the historical reliability of the Trend Baseline for the current asset and timeframe.
• Operational Threshold: If the displayed Win Rate falls below 40%, it suggests the current market behavior is incoherent (choppy) and does not respect trend logic. In such cases, switching assets or timeframes is recommended.
Operational Protocols & Signal Decoding
Visual Interpretation Standards
• Laminar Flow (Trade Confirmation): A valid trend is visually confirmed when the 15-layer SMA Ribbon is fully expanded and parallel. This indicates distributed momentum across timeframes.
• Consolidation (No-Trade): If the ribbon appears twisted, knotted, or compressed, the market lacks a unified directional vector.
• Baseline Interaction: The Triple-Smoothed Baseline acts as a dynamic support/resistance filter. Long positions remain valid only while price sustains above this structure.
System Calibration (Settings)
• Adaptive Signal Filtering (Prev. Anti-Greed): Enabled by default. This logic automatically raises the required trend slope threshold following consecutive wins to mitigate behavioral bias.
• Impulse Sensitivity: Controls the reactivity of the Volatility Core. Higher settings capture faster moves but may introduce more noise.
⚙️ Chapter 6: System Configuration & Alert Guide
This section provides a complete breakdown of every adjustable setting within Impulse Reactor to assist you in tailoring the engine to your specific needs.
🌐 LANGUAGE SETTINGS (Localization)
◦ Select Language (Default: English):
Function: Instantly translates all chart labels, dashboard texts into your preferred language.
Supported: English, Korean, Chinese, Spanish
⚡ IMPULSE CORE SETTINGS (Volatility Engine)
◦ Deviation Lookback (Default: 30): The period used to calculate the standard deviation of volatility.
Role: Sets the baseline for normalizing momentum. Higher values make the core smoother but slower to react.
◦ Fast Pulse Length (Default: 10): The short-term ATR period.
Role: Detects rapid volatility expansion.
◦ Slow Pulse Length (Default: 30): The long-term ATR baseline.
Role: Establishes the background volatility level. The core signal is derived from the divergence between Fast and Slow pulses.
🎯 TP/SL SETTINGS (Risk Management)
◦ SL/TP Fibonacci (Default: 0.786 / 1.618): Selects the Fibonacci ratio used for risk calculation.
◦ SL/TP Multiplier (Default: 1.5 / 2): Applies a multiplier to the ATR-based bands.
Role: Expands or contracts the Take Profit and Stop Loss boxes. Increase these values for higher volatility assets (like Altcoins) to avoid premature stop-outs.
◦ ATR Length (Default: 14): The lookback period for calculating the Average True Range used in risk geometry.
◦ Use Soft Stop (Close Basis):
Role: If enabled, Stop Loss alerts only trigger if a candle closes beyond the invalidation level. This prevents being stopped out by wick manipulations.
🔊 RIBBON SETTINGS (Momentum Visualization)
◦ Show SMA Ribbon: Toggles the visibility of the 15-layer gradient ribbon.
◦ Ribbon Line Count (Default: 15): The number of SMA lines in the ribbon array.
◦ Ribbon Start Length (Default: 2) & Step (Default: 1): Defines the spread of the ribbon.
Role: Controls the "thickness" of the momentum density visualization. A wider step creates a broader ribbon, useful for higher timeframes.
📎 DISPLAY OPTIONS
◦ Show Entry Lines / TP/SL Box / Position Labels / S/R Levels / Dashboard: Toggles individual visual elements on the chart to reduce clutter.
◦ Show SAR+MACD Glow: Enables the secondary confirmation shapes (triangles/circles) above/below candles.
📈 TREND BASELINE (Structural Filter)
◦ Supertrend Factor (Default: 12) & ATR Period (Default: 90): Controls the sensitivity of the underlying Supertrend algorithm used for the baseline calculation.
◦ WMA Length (40) & EMA Length (14): The smoothing periods for the Triple-Smoothed Baseline.
◦ Min Trend Duration (Default: 10): The minimum number of bars the trend must be established before a signal is considered valid.
🧠 SMART EXIT (Dynamic Liquidity)
◦ Use Smart Exit: Enables the momentum exhaustion logic.
◦ Exit Threshold Score (Default: 3): The sensitivity level for triggering a Smart Exit. Lower values trigger earlier exits.
◦ Average Period (168) & Min Hold Bars (5): Defines the rolling window for momentum decay analysis and the minimum duration a trade must be held before Smart Exit logic activates.
🛡️ TRAILING STOP (Step)
◦ Use Trailing Stop: Activates the step-function trailing mechanism.
◦ Step 1 Activation % (0.5) & Offset % (0.5): The price must move 0.5% in your favor to arm the first trail level, which sets a stop 0.5% behind price.
◦ Step 2 Activation % (1) & Offset % (0.2): Once price moves 1%, the trail tightens to 0.2%, securing the position.
🌀 SAR & MACD SETTINGS (Secondary Confirmation)
◦ SAR Start/Increment/Max: Standard Parabolic SAR parameters.
◦ SAR Score Scaling (ATR): Adjusts how much weight the SAR signal has in the overall confluence score.
◦ MACD Fast/Slow/Signal: Standard MACD parameters used for the "Glow" signals.
🔄 ANTI-GREED LOGIC (Behavioral Bias)
◦ Strict Entry after Win: Enables the negative feedback loop.
◦ Strict Multiplier (Default: 1.1): Increases the entry difficulty by 10% after each win.
Role: Prevents overtrading and entering at the top of an extended trend.
🌍 HTF FILTER (Multi-Timeframe)
◦ Use Auto-Adaptive HTF Filter: Automatically selects a higher timeframe (e.g., 1H -> 4H) to filter signals.
◦ Bypass HTF on Steep Trigger: Allows an entry even against the HTF trend if the local momentum slope is exceptionally steep (catch powerful reversals).
📉 RSI PEAK & CHOPPINESS
◦ RSI Peak Exit (Instant): Triggers an immediate exit if a sharp RSI pivot (V-shape) is detected.
◦ Choppiness Filter: Suppresses signals if the Choppiness Index is above the threshold (Default: 60), indicating a flat market.
📐 SLOPE TRIGGER LOGIC
◦ Force Entry on Steep Slope: Overrides other filters if the price angle is extremely vertical (high velocity).
◦ Slope Sensitivity (1.5): The angle required to trigger this override.
⛔ FLAT MARKET FILTER (ADX & ATR)
◦ Use ADX Filter: Blocks signals if ADX is below the threshold (Default: 20), indicating no trend.
◦ Use ATR Flat Filter: Blocks signals if volatility drops below a critical level (dead market).
🔔 Alert Configuration Guide
Impulse Reactor is designed with a comprehensive suite of alert conditions, allowing you to automate your trading or receive real-time notifications for specific market events.
How to Set Up:
Click the "Alert" (Clock) icon in the TradingView toolbar.
Select "Impulse Reactor " from the Condition dropdown.
Choose one of the specific trigger conditions below:
🚀 Entry Signals (Trend Initiation)
Long Entry:
Trigger: Fires when a confirmed Bullish Setup is detected (Momentum + Volatility + Structure align).
Usage: Use this to enter new Long positions.
Short Entry:
Trigger: Fires when a confirmed Bearish Setup is detected.
Usage: Use this to enter new Short positions.
🎯 Profit Taking (Target Levels)
Long TP:
Trigger: Fires when price hits the calculated Take Profit level for a Long trade.
Usage: Automate partial or full profit taking.
Short TP:
Trigger: Fires when price hits the calculated Take Profit level for a Short trade.
Usage: Automate partial or full profit taking.
🛡️ Defensive Exits (Risk Management)
Smart Exit:
Trigger: Fires when the system detects momentum decay or statistical exhaustion (even if the trend hasn't fully reversed).
Usage: Recommended for tightening stops or closing positions early to preserve gains.
Overbought / Oversold:
Trigger: Fires when the ribbon extends into extreme zones.
Usage: Warning signal to prepare for a potential reversal or pullback.
💡 Secondary Confirmation (Confluence)
SAR+MACD Bullish:
Trigger: Fires when Parabolic SAR and MACD align bullishly with the main trend.
Usage: Ideal for Pyramiding (adding to an existing winning position).
SAR+MACD Bearish:
Trigger: Fires when Parabolic SAR and MACD align bearishly.
Usage: Ideal for adding to short positions.
⚠️ Chapter 7: Conclusion & Risk Disclosure
Methodological Synthesis
Impulse Reactor represents a shift from reactive price tracking to proactive energy analysis. By decomposing market activity into its atomic components — Volatility, Momentum, and Structure — and reconstructing them into a coherent decision model, the system aims to provide a quantitative framework for market engagement. It is designed not to predict the future, but to identify high-probability conditions where kinetic energy and trend structure align.
Disclaimer & Risk Warnings
◦ Educational Purpose Only
This indicator, including all associated code, documentation, and visual outputs, is provided strictly for educational and informational purposes. It does not constitute financial advice, investment recommendations, or a solicitation to buy or sell any financial instruments.
◦ No Guarantee of Performance
Past performance is not indicative of future results. All metrics displayed on the dashboard (including "Win Rate" and "P&L") are theoretical calculations based on historical data. These figures do not account for real-world trading factors such as slippage, liquidity gaps, spread costs, or broker commissions.
◦ High-Risk Warning
Trading cryptocurrencies, futures, and leveraged financial products involves a substantial risk of loss. The use of leverage can amplify both gains and losses. Users acknowledge that they are solely responsible for their trading decisions and should conduct independent due diligence before executing any trades.
◦ Software Limitations
The software is provided "as is" without warranty. Users should be aware that market data feeds on analysis platforms may experience latency or outages, which can affect signal generation accuracy.

Dix$ons Tackle BoxDixsons Tackle Box — Multi-Tool Trend & Levels Suite (MA/EMA + VWAP + BB + Adaptive Trend Channels + Auto Fibs)
---
**Dixsons Tackle Box** is an all-in-one overlay for traders who want a clean chart with *stacked edge* instead of stacked indicators.
It combines:
* A **5-slot MA/EMA pack** with live slope % labels and MTF smoothing
* A **full VWAP engine** with event-based anchors, trend angle coloring, and VWAP bands
* **Bollinger Bands** with volatility-aware coloring and optional gradient background
* A **Short-Term & Long-Term Adaptive Trend Channel (ATC)** with automatic period detection, log-regression channels, and performance tables
* A **Dixson Auto Fibonacci suite**: ATR-based “rail” Fibs + Lookback Fibs off HH/LL, both driving a shared, fully customizable Fib bank
Everything is controlled logically by feature groups under the **“Tackle Box”** section, so you can quickly turn modules on/off and tune the tool to your style (scalp, intraday, swing, or position).
> **Important:** This is an analysis/visualization tool only. Nothing here is financial advice or an automatic trading system. Always test and manage risk yourself.
---
## 1. MA/EMA Pack — 5 Smart Averages with Slope %
**Group:** `Tackle Box` + per-slot groups `MA/EMA 1` … `MA/EMA 5`
**Main toggle:** `Enable MA's`
**Per-slot master row:** `_maRow1` … `_maRow5`
### What it does
This module gives you **five independent MA/EMA slots**, each with:
* Its own **type** (MA or EMA)
* **Length**, **color**, **line width**, and **plot style** (`Solid`, `Step`, or `Circles`)
* **Timeframe per slot** (MTF)
* Rich **label controls** (slope %, length/type text, timeframe text, etc.)
* **Label size** per slot (`tiny → huge`)
On top of that, each average has a **live slope % readout**, normalized by instrument tick size, so you can compare trend steepness across assets.
### Key features
* **Master slot row (1–5):**
In the `Tackle Box` group you have `_maRow1`–`_maRow5` toggles. These gate each slot globally, so you can quickly show/hide specific MAs without digging into each slot.
* **MTF Smoothed Mode:**
* `MTF Smoothed Mode` (on by default) makes higher-timeframe MAs **update only when the HTF bar closes (and on the last bar)**.
* That reduces the stair-stepping noise you often get when pulling HTF data onto an LTF chart, while still giving you accurate levels and a smooth, tradeable line.
* **Per-slot label text controls:**
Each MA group has toggles to control exactly what the label shows:
* `Show Label` – show/hide label entirely
* `Slope` – append slope % to the label
* `Len+Type` – show e.g. `50EMA` or `200MA`
* `TF` – show HTF name if the slot is on an MTF
* `'slope' text` – optionally include the word `slope` in the label
* **Slope % (angle) logic:**
Slope for each MA uses a normalized **“angle %” in **, based on the 1-bar change vs `syminfo.mintick`.
* Big positive values = strong uptrend
* Big negative values = strong downtrend
* Near zero = flat/neutral
This makes it easy to build rules like:
* “Only trade long if the **50EMA slope** is above +20% and price is above VWAP”
* “Take profit if slope on my faster MA collapses back toward 0.”
### Typical use
* Slot 1–2: **fast intraday EMAs** (e.g., 9 / 20 EMA)
* Slot 3–4: **structural EMAs/MAs** (e.g., 50 / 200)
* Slot 5: a **dedicated MTF trend filter** (e.g., 5-minute or 1-hour EMA on a 1-minute chart)
---
## 2. VWAP Engine + Bands — Anchor-Aware, Angle-Aware VWAP
**Group:** `Enable VWAP` + `------ VWAP Settings ------`, `Bands Settings`, `Color Settings`
### Core VWAP
* **Anchors:**
`Anchor Period` lets you choose where each VWAP reset starts:
* `Session` (day session VWAP, perfect for intraday)
* `Week`, `Month`, `Quarter`, `Year`, `Decade`, `Century`
* Corporate events: `Earnings`, `Dividends`, `Splits`
This lets you build VWAP logic around:
* **Intraday mean reversion** (Session VWAP + bands)
* **Swing anchor VWAPs** (Weekly/Monthly)
* **Event-based anchors** (earnings/dividend/split reaction)
* **Hide on DWM:**
`Hide VWAP on 1D or Above` lets you keep intraday VWAP from cluttering higher-TF charts.
* **Angle/Trend Detection:**
The VWAP engine computes a **regression slope** over each anchor segment and converts it to an **angle %**:
* `Angle Lookback (bars)` controls how many bars are used
* `Angle Trend Threshold (%)` sets the threshold where a slope is considered “trending”
With `Color VWAP by Trend` enabled:
* Uptrend > threshold → VWAP turns **trend up color** (e.g., lime)
* Downtrend < −threshold → VWAP turns **trend down color** (e.g., red)
* Inside threshold → VWAP uses a neutral color
You can also set separate **line widths** for neutral vs trend state and transparency to give a “Hull-style” visual feel.
* **VWAP Labels:**
You get a single, de-duplicated VWAP label on the last bar with:
* Optional **name** (`VWAP`)
* Optional **price** (`$xxx.xx`)
* Optional **angle %** and optional `"slope"` word
* Global **label size** for VWAP + bands
### VWAP Bands
* **Calc modes:**
`Bands Calculation Mode`:
* `Standard Deviation` – classic VWAP ± n * σ
* `Percentage` – bands as a fixed % of VWAP
* **Bands 1-3:**
Each band has:
* Visibility toggle, independent multiplier (`×`)
* Separate **upper/lower colors** per band
* Optional **fill** between upper/lower for each band
* Label toggles:
* `Show All Labels`
* `Show Band #X Label`
* `Band Labels: Show Names` (VWAP+1, VWAP-1, etc.)
* `Band Labels: Show Prices`
This lets you configure anything from a minimalist “just VWAP + 1 band” view to a full 3-band ladder.
### VWAP Highlight Fill
* **Premium/discount shading**:
Optional fill that shades:
* Region **above VWAP** when price is above (e.g., greenish)
* Region **below VWAP** when price is below (e.g., reddish)
This makes it extremely easy to see when price is trading at **premium vs discount** relative to the current anchor VWAP.
### Typical use
* Intraday scalpers: Session VWAP + 1–2 bands + highlight fill
* Swing traders: Weekly/Monthly VWAP + only the main line and label
* Event traders: Earnings-anchored VWAP, tracking post-earnings drift
---
## 3. Bollinger Bands — Volatility-Aware BB with Gradient Fill
**Group:** `Enable Bollinger Bands` + `------ Bollinger Band settings ------`
### What it adds
A clean Bollinger Band overlay designed to play nicely with the VWAP/MA stack:
* `Bollinger Bands Length` (default 20)
* `Bollinger Bands Multiplier` (default 2.0)
* `BB Basis Color` & **line width**
* Upper/lower bands colored based on **width change**:
* Expanding volatility → `BB Expanding Color`
* Contracting volatility → `BB Contracting Color`
You can also toggle:
* `Show Center Line MA Label` – prints something like `20ma` on the last bar.
* `Enable Gradient Background Fill` – draws a gradient between price and the bands:
* `Gradient Fill Up Color` for below-price fill
* `Gradient Fill Down Color` for above-price fill
### Why it’s unique here
Instead of just static bands, this implementation **flags volatility regimes** (expansion vs contraction) via color and optional gradient. That pairs nicely with ATR Fibs and VWAP:
* Use **BB contraction (squeeze)** + flat VWAP angle to anticipate breakouts.
* Use BB + VWAP bands to filter which “touches” are genuinely overextended.
---
## 4. Dixson Adaptive Trend Channel (ATC) — Short-Term & Long-Term Log Channels
**Master toggle:** `Enable Adaptive Trend Channel`
**Groups:** `------ Dixson ATC Settings ------`, `Short-Term Channel Settings`, `Long-Term Channel Settings`, `Short-Term Midline Settings`, `Long-Term Midline Settings`, `Channel Trend Background Fill Settings`, `Short-Term Table Settings`, `Long-Term Table Settings`
### Under the hood
ATC is a **log-scale regression channel engine** that automatically:
1. Scans a set of candidate periods.
* **Short-term:** 20 → 200 bars
* **Long-term:** 300 → 1200 bars
2. For each period, it computes:
* Log-price regression slope & intercept
* Standard deviation of residuals
* A Pearson-style R value (trend “strength”)
3. Picks the period with the **highest correlation (|R|)** and uses that as the **detected trend length**.
This yields a **data-driven channel** that adapts to whatever trend the market is actually respecting.
> For long-term stats, annualized return only makes sense on **daily/weekly** charts. On intraday charts, treat the “Annual Return” purely as informational.
### Short-Term Channel
Controls in `Short-Term Channel Settings` + `Short-Term Midline Settings`:
* `Show Short-Term Channel` – on/off
* `Deviation Multiplier (Short-Term)` – how wide the channel is (in standard deviations)
* **Upper/Lower colors**, line width, style (Solid/Dotted/Dashed), transparency
* `Line Extension Style` – Extend Right / Extend Both / Extend None / Extend Left
Optional **Short-Term Midline**:
* Toggle + color, style, width, transparency
* Tracks the regression line itself (center of the channel)
Background fill:
* `Enable ST Background Fill` with separate **ST Uptrend** / **ST Downtrend** colors
* Trend direction is inferred from regression slope sign
### Long-Term Channel
Mirrors the ST controls with its own group:
* `Show Long-Term Channel`
* `Deviation Multiplier (Long-Term)`
* Upper/Lower channel colors, thickness, style, transparency
* `Line Extension Style`
* Optional Long-Term midline + colors/styles
* Optional **background fill** with separate colors for up vs down
You can run **both channels at once**, giving a panel of:
* **Macro trend structure** (Long-Term ATC)
* **Current swing trend** (Short-Term ATC)
* MAs, VWAP, and Auto Fibs on top for entries/exits
### Trend Info Tables
Each channel has its own table options:
* `Show Detected Period` (bars used)
* `Show Trend Strength` – either:
* Descriptive text: “Extremely Weak” → “Ultra Strong”, or
* Raw Pearson R value if `Show Pearson R` is enabled
* `Show Annualized Return` (when timeframe is daily/weekly)
* Table position (`Top Left`, `Bottom Right`, etc.)
* Text size (`Small`, `Normal`, `Large`)
These tables quantify:
* Over what lookback the trend is being measured
* How “clean” that trend is
* What the approximate annualized performance of that trend has been
---
## 5. Dixson Auto Fibonacci Suite — ATR Fibs + Lookback Fibs + Shared Fib Bank
**Master toggle:** `Enable Auto Fibonacci`
**Groups:** `Dixson Auto Fibonacci`, `ATR Auto Fib`, `Previous ATR Fib`, `Lookback Auto Fib`, `Lookback Anchor Overrides`, `Fibonacci Levels`
You get **two separate engines** (ATR-based and Lookback-based) that both draw from the **same customizable Fib bank**, with optional log scaling.
---
### 5.1 Global Auto Fib Settings
* `Logarithmic Scale`
* When ON, Fib levels are interpolated in log-space (better for assets that move in percentages).
* When OFF, interpolation is linear in price.
This applies to **both** the ATR and Lookback engines.
---
### 5.2 ATR Auto Fib (Rail-Based, Supertrend-Driven)
**Groups:** `ATR Auto Fib`, `Previous ATR Fib`
The ATR engine builds **“rails”** that hug price without letting candles touch them, then projects Fib levels between these anchors.
#### How it works
1. Uses built-in `ta.supertrend` with:
* `ATR Period`
* `ATR Multiplier`
2. Builds dynamic **upper and lower rails** around price:
* Uses ATR to define a **proximity gap** (`Proximity (×ATR)`) so rails stay **just outside the wicks** (no-touch behavior).
* Smooths raw highs/lows slightly (RMA) to avoid spiky rails.
* Ensures the upper rail is always ≥ high+gap and lower rail ≤ low−gap.
3. The **direction** (uptrend/downtrend) is inferred from the Supertrend direction:
* On trend flips, the script:
* Captures the prior rail pair as a **“previous segment”**
* Starts a new rail segment in the new direction
4. From these rails, the script draws **directional Fib “ladders”**:
* For the **current ATR Fib**:
* The Fib is drawn from one anchor to the other depending on the trend sign.
* Rays are projected `Ray Length` bars to the right of `Current Offset`.
* For the **previous ATR Fib**:
* The last completed segment’s start/end rails are used as anchors
* Rays are projected using `Prev Fib Offset` and `Prev Fib Length`
#### Current ATR Fib controls
* `Enable ATR Fib` – toggles current ATR Fib bank
* `ATR Period`, `ATR Multiplier` – control the “engine” behind the rails and ST logic
* `Current Offset`, `Ray Length` – where and how far rays are drawn
* `Show Level Text`, `Show Price`, `Display % not ratio` – label style
* `Label Size (Current ATR Fib)` – for all current ATR Fib labels
Visual extras:
* `Plot Hi/Low Anchor Lines` – shows upper/lower rails
* `Plot ATR Trailing Stop` – shows clamped Supertrend as a continuous line
#### Previous ATR Fib controls
* `Enable Prev ATR Fib` – toggles previous segment ladders
* Independent `Prev Fib Offset`, `Prev Fib Length`
* Separate label controls:
* `Show Level Text (Prev)`
* `Show Price (Prev)`
* `Display % not ratio (Prev)`
* `Label Size (Previous ATR Fib)`
Use the **current ATR Fib** as your active trading “ladder” and the **previous ATR Fib** to track recently broken structure and potential retest zones.
---
### 5.3 Lookback Auto Fib — HH/LL-Driven Fib Bank, MTF + Manual Overrides
**Group:** `Lookback Auto Fib` + `Lookback Anchor Overrides`
This engine draws Fibs between **highest high** and **lowest low** within a given lookback window on a chosen timeframe.
#### How it works
1. Select higher timeframe:
* `Lookback Timeframe` (empty = chart timeframe)
2. Choose your range:
* `Lookback Bars` – number of bars on the selected TF to scan for extremes
3. Optionally allow look-ahead:
* `Look-ahead Bars (repainting)`
* `0` = no look-ahead (no forward info, no repainting)
* `>0` = uses `barmerge.lookahead_on` for forward-looking extremes (can repaint)
4. For that range, the script finds:
* Highest high + its bar offset
* Lowest low + its bar offset
5. Trend direction is determined by **which extreme is more recent**:
* Recent high → **down** direction (high → low)
* Recent low → **up** direction (low → high)
6. Manual direction overrides:
* `Force Uptrend` / `Force Downtrend` – override the auto decision
7. Manual anchor overrides:
* `Manual Anchor High (LB)`
* `Manual Anchor Low (LB)`
If both are set, those become the anchors and direction is deduced from which is higher.
8. The engine then draws a **directional Fib ladder**:
* Anchors between high/low based on direction
* Rays extend `Lookback Fib Length` bars from `Lookback Fib Offset`
#### Label controls
* `Show Level Text`, `Show Price`, `Display % not ratio`
* `Label Size (Lookback Fib)`
* Labels are prefixed with `LB` to distinguish them from ATR Fibs.
This engine is ideal for:
* **Swing structure mapping:** Drawing Fibs across the last major swing on the HTF.
* **Confluence:** Aligning Lookback Fibs with ATR Fibs, ATC channel boundaries, and VWAP bands.
---
### 5.4 Shared Fibonacci Levels — Fully Custom Fib Bank for Both Engines
**Group:** `Fibonacci Levels`
The ATR and Lookback engines **both** use the same Fib bank:
* **Ratios provided by default:**
* 0.000
* 0.146
* 0.236
* 0.382
* 0.500
* 0.618
* 0.650
* 0.707
* 0.786
* 0.886
* 1.000
* 1.130
* 1.272
* 1.618
* 2.000
Each ratio has its own:
* `Enable Level X.XXX`
* `Level X.XXX` (the actual ratio – fully editable)
* `Thickness X.XXX` (line width)
* `Style X.XXX` (Solid / Dashed / Dotted)
* `Color X.XXX` (line + label color)
Adjusting a level here **instantly updates both** ATR and Lookback ladders. This makes it very easy to:
* Run “standard” Fib sets for classic retracements
* Or define your **own Fib presets** (e.g., 0.25 / 0.5 / 0.75, or custom extension clusters)
---
## How to Use & Suggested Workflows
**Scalpers / 0DTE / Intraday:**
* Enable:
* MA/EMA pack (fast EMAs + one MTF slot)
* VWAP (Session anchor) + 1–2 VWAP bands + highlight fill
* ATR Auto Fib (current + previous)
* Optionally hide:
* Lookback Fibs
* Long-Term ATC (unless you want HTF bias on your intraday chart)
Use slope labels, VWAP angle %, and ATR Fib ladders to structure trades around pullbacks, mean reversion, and breakouts.
**Swing / Position traders:**
* Turn on:
* Long-Term ATC (with table)
* Short-Term ATC for swing structure
* Lookback Auto Fib on a higher timeframe (e.g., D on 4H chart)
* Keep VWAP anchored to Week or Month, and MA slots for key reference MAs.
Use ATC channels for **trend structure**, Lookback Fibs for **swing levels**, and long VWAPs for **value zones**.
---
## Final Notes & Disclaimer
* Works on **all symbols** and **all timeframes**, but some stats (like “Annualized Return”) are only meaningful on **daily/weekly** data.
* Some options (like Look-ahead mode for Lookback Fibs) can **repaint** on purpose. These are clearly labeled — use them only if you understand and want forward-looking behavior.
* This script does **not** place trades. It is a visual / analytical tool only.
* Nothing in this indicator or description is financial advice. Always do your own research, forward-test, and manage risk appropriately.
If you have **invite-only access** to **Dixsons Tackle Box**, you’re getting the full Dixson overlay stack in one place — designed to be the central “hub” for your chart, not just another line on it.

All-in-One India v21. **Overview**: Multi-indicator strategy for NSE index options (NIFTY/BANKNIFTY) tracking CE/PE premiums as a synthetic asset (straddle or single-leg) on TradingView.
2. **Setup**: Input index, expiry (e.g., 21-08-24), strikes (e.g., 50800 CE/PE). Choose "Combined" for straddle premium or single option.
3. **Data**: Fetches OHLCV for options; plots premium as candlesticks (green up, red down).
4. **Indicators** (toggleable): EMA (7/12 cross), Supertrend (ATR7, factor2), VWAP (daily reset), RSI (7-period, 80/20 levels), SMA (7-period).
5. **Signals**: Buy/Sell on crosses/flips (e.g., EMA fast> slow for buy; one per day/direction). Multi-indicator: Sequential AND logic (best with 1 enabled).
6. **Buy Logic**: EMA cross up, Supertrend to up (-1), premium>VWAP/SMA, RSI>80 (momentum tweak).
7. **Sell Logic**: Opposite crosses/flips (e.g., EMA cross down, Supertrend to down +1, RSI<20).
8. **Trading**: Long premium on buy (volatility play); short on sell (decay). No exits—use opposite signal or targets.
9. **Visuals/Alerts**: Shapes for signals; lines for indicators; alerts on buy/sell.
10. **Tips**: Test intraday near expiry; ATM strikes; risk 1-2%; tweak RSI if needed.

Futures Momentum Scanner – jyoti//@version=5
indicator("Futures Momentum Scanner – Avvu Edition", overlay=false, max_lines_count=500)
//------------------------------
// USER INPUTS
//------------------------------
rsiLen = input.int(14, "RSI Length")
macdFast = input.int(12, "MACD Fast")
macdSlow = input.int(26, "MACD Slow")
macdSignal = input.int(9, "MACD Signal")
stLength = input.int(10, "Supertrend Length")
stMult = input.float(3.0, "Supertrend Multiplier")
//------------------------------
// SUPER TREND
//------------------------------
= ta.supertrend(stMult, stLength)
trendUp = stDirection == 1
//------------------------------
// RSI
//------------------------------
rsi = ta.rsi(close, rsiLen)
rsiBull = rsi > 50 and rsi < 65
//------------------------------
// MACD
//------------------------------
= ta.macd(close, macdFast, macdSlow, macdSignal)
macdBull = macd > signal and macd > 0
//------------------------------
// MOVING AVERAGE TREND
//------------------------------
ema20 = ta.ema(close, 20)
ema50 = ta.ema(close, 50)
ema200 = ta.ema(close, 200)
trendStack = ema20 > ema50 and ema50 > ema200
//------------------------------
// BREAKOUT LOGIC
//------------------------------
prevHigh = ta.highest(high, 20)
breakout = close > prevHigh
//------------------------------
// FINAL SCANNER LOGIC
//------------------------------
bullishCandidate = trendUp and rsiBull and macdBull and trendStack and breakout
//------------------------------
// TABLE OUTPUT FOR SCANNER FEEL
//------------------------------
var table t = table.new(position.top_right, 1, 1)
if barstate.islast
msg = bullishCandidate ? "✔ BUY Candidate" : "– Not a Setup"
table.cell(t, 0, 0, msg, bgcolor=bullishCandidate ? color.new(color.green, 0) : color.new(color.red, 70))
//------------------------------
// ALERT
//------------------------------
alertcondition(bullishCandidate, title="Scanner Trigger", message="This stock meets Avvu's futures scanner criteria!")

EMA+SuperThis indicator integrates multiple trend-following components into a unified, clean, and easy-to-interpret chart overlay. Its purpose is to help traders observe short-term and long-term trend direction, momentum shifts, and potential areas of interest using established moving-average and volatility-based techniques.
🔹 Features
1. Multi-EMA Framework
Plots the 9, 21, 50, 100, and 200 EMAs to provide a structured view of short, medium, and long-term market trends.
2. Supertrend Overlay
Applies an ATR-based Supertrend to visualize potential directional shifts.
Both uptrend and downtrend zones are lightly shaded for improved clarity.
3. NovaWave-Style Trend Cloud
A dynamic cloud formed from:
Fast EMA
Slow EMA
Signal MA
The cloud automatically adapts its color based on the relationship between the fast and slow EMAs, offering a quick visual read of momentum bias.
4. Displaced Moving Averages (20 / 50 / 200 DMA)
Includes optional forward displacement to replicate commonly used DMA models in trend-following systems.
5. Crossover Buy/Sell Signals
Buy and sell markers appear when the fast EMA crosses above or below the slow EMA.
Users may create custom alerts via the TradingView alerts panel.
🔹 Alerts
This indicator supports built-in EMA crossover alerts:
Buy Alert – triggered when the fast EMA crosses above the slow EMA
Sell Alert – triggered when the fast EMA crosses below the slow EMA
Users can enable these alerts through the “Add Alert” panel and select the corresponding alert condition.
Alerts are evaluated on bar close for consistency and do not repaint.
🔹 How to Use
EMA structure helps define directional bias and market phase.
The Supertrend and Trend Cloud offer contextual confirmation.
EMA crossovers can help highlight momentum changes.
DMAs provide an additional perspective on smoothed trend levels.
This tool is intended for visual analysis and can complement other approaches such as volume studies, higher-timeframe trend analysis, or support/resistance mapping.
⚠️ Disclaimer
This script is for educational and informational purposes only. It does not constitute financial advice or guarantee any outcome. Always perform independent analysis and apply proper risk management.

💎 Trend Master Pro Scalping MTFTrend Master Pro Scalping MTF is a professional-grade indicator designed for intraday trading and scalping, optimized for 1M, 5M, and 15M timeframes. It combines multiple technical filters to provide high-confidence breakout and trend signals with visual clarity.
Key Features:
Multi-indicator analysis: EMA, RSI, ATR, SuperTrend, and volume.
Multi-Timeframe (MTF) filter: signals are validated only if the higher timeframe trend is aligned.
Clear visual signals: colored triangles and dynamic labels showing signal strength: A++, A+, A, B.
Confirmation dashboard: instantly see EMA trend, RSI strength, volume, ATR activity, SuperTrend direction, and final signal on your chart.
Reliable alerts: fixed alert messages compatible with TradingView, avoiding Pine Script errors.
Customizable parameters: adjust EMA, RSI, ATR, volume, and SuperTrend settings to match your scalping or day trading style.
How to Use:
Select your desired timeframe: 1M, 5M, or 15M.
Look for signals rated A++ or A+ for maximum probability.
Confirm trends using labels and the dashboard before entering trades.
Receive real-time notifications via alerts when confirmed signals occur.
Benefits:
Ideal for quick scalping and intraday strategies.
Reduces false signals with MTF trend filtering.
Professional visualization for fast and confident decision-making.
Recommendations:
Test on a demo account before trading live.
Adjust parameters to fit your asset and timeframe.
Combine with proper risk management strategies.

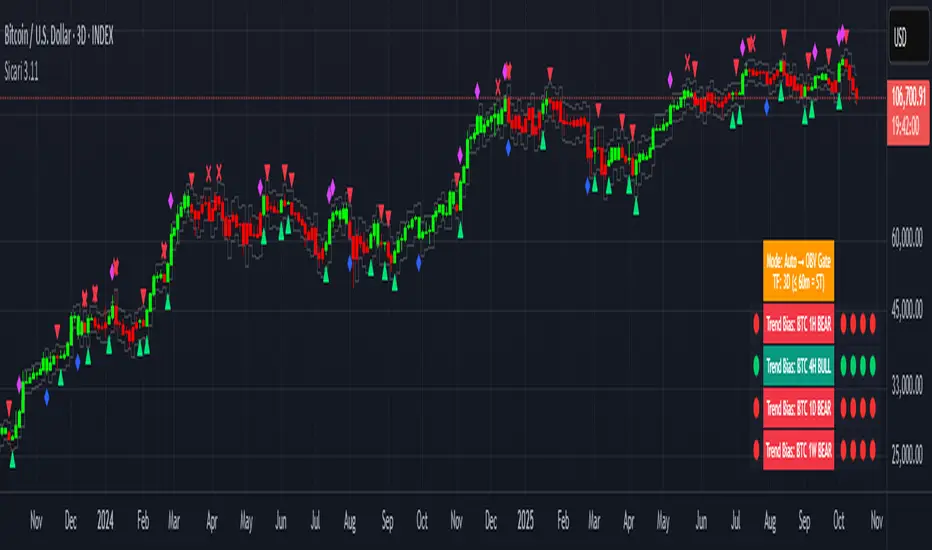
SicariSicari
What is it?
Sicari is a trend-following trading system that identifies potential bullish or bearish trends. It blends EMA trend, OBV participation, and an Adaptive SuperTrend gate (machine-learning k-means over ATR bands) into a strict 2-of-3 confirmation model.
By default, it uses a clean two-colour scheme: 🟢 green = long bias and 🔴 red = short bias.
Optionally, a four-colour mode exposes hedge and early-risk conditions.
Sicari works across all asset classes and timeframes (recommended: 15-minute to monthly).
How it works
* Auto mode adapts by timeframe: ≤60m uses a Hard-Gate where SuperTrend must confirm to flip; >60m uses Majority mode where OBV carries more weight for faster reversals
* Voters are EMA, OBV, and Adaptive SuperTrend; a flip requires 2 of 3 agreement (Hard-Gate also needs ST)
* Optional four-colour candles highlight hedge state when voters disagree. The hedge direction is OBV-led (↑ / ↓ tint), helping you trim risk or wait for full confirmation.
* Multi-Timeframe Trend Bias panel (1H, 4H, 1D, 1W): left dot = live bias for that TF; Four dots on the right show = last four closed bars (newest on right). In 4-colour mode, the left/current dot follows 4-colour logic, history dots remain 2-colour for stability. Compact mode optionally shows only current dots per TF.
What you can plot
* Candles: two-colour by default (🟢 long / 🔴 short); optional 4-colour hedge mode (OBV-led ↑/↓ tint).
* Triangles: mark long/short flips.
* Multi-Timeframe Trend Bias panel: 1H / 4H / 1D / 1W
* VWAPs: Session + Weekly VWAP for fair-value anchoring.
* Moving Averages: Daily 20/50 (non-repainting) and Weekly 20/50/100 stair-step MAs for structure.
* Dynamic ATR Stops: step-line long/short stop bands for risk control and stopped-out detection.
* RSI Take-Profit markers: X-shaped markers on the chart TF (touch / re-entry logic)
* 4H RSI Diamonds: non-repainting diamonds confirming on 4H close
Combined Asset Volume (crypto-aware)
* One toggle aggregates spot volume across major venues
* Majors (BTC/ETH): Binance + Coinbase + Bitfinex + Kraken (USD/USDT/USDC)
* Alts: Binance + Bybit + KuCoin + Coinbase (lean, USDT/USD)
* CRYPTOCAP indexes, non-crypto or FX pairs automatically fall back to the chart’s own volume
* OBV has a unit-volume fallback when volume data is missing
Alerts (programmatic or traditional)
* Programmatic (recommended): Create one alert → “Any alert() function call”. This single alert respects your chosen settings (asset, timeframe, 2/four-colour mode, RSI levels, chop/flip cooldown, stops on/off, etc.) and fires for all enabled conditions once-per-bar-close. Long/short signals trigger only at flips, not every bar.
* Traditional: add specific alerts only for what you want (entries, exits, etc.)
Alert list (fires on bar close)
* 🚀🟢 LONG entry
* 🔻🔴 SHORT entry
* 🟡 HEDGE LONG (four-colour mode)
* 🟠 HEDGE SHORT (four-colour mode)
* 🎯 Take Profit Long (RSI-based)
* 🎯 Take Profit Short (RSI-based)
* 💥🔴 HTF Super SHORT (4H RSI diamond)
* 🚀🟢 HTF Super LONG (4H RSI diamond)
* 💀 Stopped Out of Short (dynamic ATR stop)
* 💀 Stopped Out of Long (dynamic ATR stop)
Programmatic alerts include tick-aware thousands separators and VWAP references on intraday charts for mobile readability
Setup & tips
* After adding Sicari: Click the three dots next to the script name → Visual order → Bring to front. This hides the original candles so Sicari’s candles are fully visible
* Keep Auto mode ON; enable 4-colour only if you want hedge awareness; toggle VWAPs and MAs as structure guides
* Works on crypto, indices, FX and equities - any symbol, ny timeframe
* Use standard candles (not Heikin Ashi)
* Colours optimised for dark backgrounds
Sicari distills trend, participation, and structure into one adaptive stream - delivering institutional-grade precision, clarity, and timing within the Sicari ecosystem.
RK Scalper V1.0Version 1.0
Scalper Indicator
Use multiple options to decide the best possible scalping possibilities on 1, 3, 5 and 15 min timeframes
1. 3 different EMA trend lines to decide direction and reversal; option to include EMA crossover to take entry and exit positions
2. Show signal when price cross VWAP with huge volume
3. Show SuperTrend and identify possible reversal when price touches the SuperTrend line
4. Show VWAP line
5. Show SuperTrend VWAP crossover with an option to either include volume spike or not
6. Show VWMA line to decide exit points when price moves below at buy and above at sell positions
7. Show Open=High / Open-Low to see the buy and sell pressure and buyer seller dominance
8. Show Volume spike indication on Volume for NIFTY, BANK NIFTY and MIDCAP NIFTY futures volume on their respective underlying asset
9.
Note: It is batter to use scalp indicator along with trend and momentum indicators to have better results.

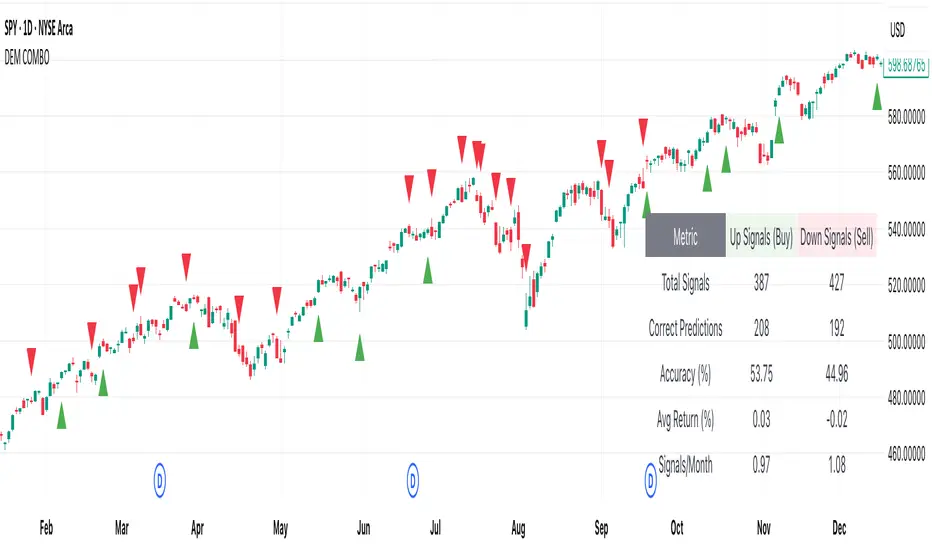
[DEM] Combo Signal (With Backtesting) Combo Signal (With Backtesting) is designed to generate buy and sell signals by combining seven different trading strategies that incorporate multiple technical indicators including SuperTrend, Parabolic SAR, MACD, and RSI. It also includes a comprehensive backtesting framework to evaluate the historical performance of these signals. The indicator overlays directly on the price chart, plotting signals and displaying performance statistics in a table. The strategy triggers buy signals when any of seven long conditions are met (including ATR-based reversal patterns, SuperTrend confirmations, RSI oversold crossovers, MACD bullish crossovers, and SuperTrend line breaks), while sell signals are generated when any of the corresponding seven short conditions occur, creating a multi-faceted approach that aims to capture various market conditions and trading opportunities while tracking signal accuracy, average returns, and signal frequency through its integrated backtesting system.
NEO CLOUD + Kinetic Compass CombinedThis is a comprehensive technical analysis indicator combining three powerful trading systems:
📊 NEO CLOUD System:
- Trend identification system based on dual EMA range filters
- Provides dynamic cloud fill for intuitive trend direction and strength visualization
- Supports Fast/Normal/Slow trend length settings
- Fully customizable colors including cloud fill and signal arrows
🧭 KINETIC COMPASS System:
- Modified trend indicator based on EMA100 for high-precision trend tracking
- Dual-layer exit signal system to optimize exit timing
- Integrated EMA50/100/200 multi-timeframe confirmation
- Gradient fill effects for clear support/resistance visualization
- Independent control over buy/sell signals and exit signals display
📈 DUAL SUPERTREND System:
- Two independent Supertrend indicators with separate parameters
- Selective display control - show one, both, or neither
- Dynamic support/resistance lines that adapt to market volatility
- Adjustable transparency fill areas
🚀 Combined Features:
- MEGA Alerts: Super alerts triggered when multiple systems align
- Independent Switches: Each system can be enabled/disabled separately
- Color Customization: Full personalization of all visual elements
- Candle Coloring: Support for NEO or Kinetic candle coloring schemes
- Signal Filtering: Choose to show or hide various types of trading signals
💡 Usage Recommendations:
- Beginners: Start with single system, then combine after familiarization
- Trend Trading: Focus on NEO CLOUD direction and Kinetic trend lines
- Scalping: Use exit signals and Supertrend for precise entry/exit points
- Signal Confirmation: Wait for multiple system alignment for higher success rate

NeuroFlow Pro IndicatorThe **NeuroFlow Pro Indicator** is a comprehensive technical analysis tool designed for traders on the TradingView platform. It provides actionable buy and sell signals by combining multiple technical indicators, including Moving Averages, MACD, RSI, Stochastic RSI, SuperTrend, Ichimoku Cloud, Bollinger Bands, and Volume analysis. The indicator generates a **Composite Score** (0–100) that reflects market conditions, with low scores indicating bullish opportunities and high scores suggesting bearish conditions. It also identifies key trend reversal points and significant EMA crossovers (Golden Cross and Death Cross) to help traders make informed decisions.
**Key Features**:
- **Composite Score**: Aggregates signals from multiple indicators to provide a single, easy-to-read metric.
- **Buy/Sell Signals**: Generates clear signals for potential long (buy) and short (sell) opportunities.
- **Golden/Death Cross**: Marks EMA 50 crossing above (🚀) or below (💀) EMA 200, indicating major trend shifts.
- **Dashboard**: Displays real-time metrics like trend direction, momentum, volume, and signal confidence.
- **Customizable Alerts**: Notifies users of buy/sell signals, divergences, and EMA crossovers via TradingView’s alert system.
- **Multi-Timeframe Analysis**: Incorporates higher timeframe trends for enhanced signal reliability.
- **Candlestick Patterns**: Optionally includes patterns like Hammer, Engulfing, or Morning Star for signal confirmation.
This indicator is ideal for traders seeking a robust, all-in-one tool to identify trading opportunities across various markets (e.g., crypto, stocks, forex) and timeframes (e.g., 1H, 4H, daily).
User Guide for NeuroFlow Pro Indicator
Understanding the Indicator
- **Dashboard**:
- Located on the chart (left or right, configurable), it shows real-time metrics:
- **Comp Score**: Composite Score (0–100); low (<30) is bullish, high (>70) is bearish.
- **Trend**: Bullish, Bearish, or Neutral
- **MTF Trend**: Trend from a higher timeframe (e.g., 60m or 240m).
- **Momentum**: RSI and Stochastic RSI-based momentum (Bullish, Bearish, Neutral).
- **MFI**: Money Flow Index (Inflow, Outflow, Neutral).
- **Volatility**: High or Low based on ATR and Bollinger Bands.
- **Volume**: High, Low, or Neutral relative to volume MA.
- **Ichimoku**: Bullish, Bearish, or Neutral based on cloud position.
- **ADX Strength**: Strong or Weak trend based on ADX.
- **Divergence**: Bullish, Bearish, or Neutral for RSI/MACD divergences.
- **Reversal**: Bullish or Bearish reversal potential with confidence percentage.
- **Signal Status**: Long (buy), Short (sell), or None.
- **Signal Confid**: Confidence percentage for the current signal.
- **Chart Visuals**:
- **EMA 50 (White)**: Fast-moving average for short-term trends.
- **EMA 200 (Blue)**: Long-moving average for long-term trends.
- **Golden Cross (🚀)**: Green rocket emoji when EMA 50 crosses above EMA 200 (bullish).
- **Death Cross (💀)**: Red skull emoji when EMA 50 crosses below EMA 200 (bearish).
- **Alerts**:
- Configurable for Buy/Sell Signals, Golden/Death Cross, and Bullish/Bearish Divergences.
Configuring Settings
1. **Open Settings**:
- Right-click the indicator’s name on the chart and select “Settings,” or double-click the indicator in the chart’s indicator list.
2. **Key Settings to Customize**:
- **Strategy Settings**:
- **Max ATR Multiplier**: Adjusts sensitivity to volatility (default: 3.0).
- **Main Settings**:
- **Candlestick Pattern**: Choose Hammer, Engulfing, Morning Star, or Custom (default: Hammer).
- **Multi-Timeframe Period**: Set higher timeframe for trend analysis (e.g., 60m, 240m, Daily; default: 60m).
- **Higher Timeframe**: Secondary timeframe for confirmation (default: 240m).
- **Use Candlestick Patterns**: Enable/disable pattern-based signals (default: off).
- **Use Volume Filter**: Require high volume for signals (default: on).
- **Use ADX Filter**: Require strong trend for signals (default: on).
- **Momentum Settings**:
- **RSI/Stochastic/MFI Lengths**: Adjust periods for RSI, Stochastic RSI, and MFI (defaults: 14, 14, 60).
- **EMA Lengths**: Fast (50), Slow (100), Long (200) for trend and crossovers.
- **ATR/ADX Lengths**: Volatility and trend strength periods (default: 14).
- **SuperTrend/Bollinger/Ichimoku Settings**:
- Customize periods and multipliers (defaults: SuperTrend 10/3.0, Bollinger 20/2.0, Ichimoku 9/26/52).
- **MACD Settings**:
- **MACD Preset**: Auto (timeframe-based), 1H (3-10-16), 4H (5-34-21), D (5-15-9), or Custom (default: Auto).
- **Custom MACD Lengths**: Fast (12), Slow (26), Signal (9) for Custom preset.
- **Weights Settings**:
- Adjust weights for trend, momentum, volatility, etc., to prioritize certain indicators (defaults: Trend 1.0, Momentum 0.3, etc.).
- **Threshold Settings**:
- **Bullish/Bearish Reversal Thresholds**: Set score thresholds for reversals (default: 30/70).
- **ADX Threshold**: Minimum ADX for trend strength (default: 20).
- **Signal Thresholds**: Base (70) and alert (80) thresholds for signals.
- **Dashboard Settings**:
- **Position**: Left or Right (default: Right).
- **Show/Hide Metrics**: Enable/disable dashboard rows (e.g., Comp Score, Trend, MFI; all enabled by default except Volatility and Volume MA).
3. **Save Changes**:
- Click “OK” to apply settings. The dashboard and plots update instantly.
Using the Indicator
1. **Interpreting Signals**:
- **Buy Signal (Long)**: Appears when Composite Score is low (≤30), with at least two bullish confirmations . Shown as “Long” in Signal Status with confidence percentage.
- **Sell Signal (Short)**: Appears when Composite Score is high (≥70), with at least two bearish confirmations. Shown as “Short” in Signal Status.
- **Golden Cross (🚀)**: Indicates a bullish trend when EMA 50 crosses above EMA 200. Look for confirmation from Composite Score and Signal Status.
- **Death Cross (💀)**: Indicates a bearish trend when EMA 50 crosses below EMA 200. Confirm with dashboard metrics.
- **Reversal Signals**: Dashboard shows “Bullish” or “Bearish” with a percentage when reversal conditions are met .
2. **Monitoring the Dashboard**:
- Use the dashboard to assess market conditions in real-time.
- Green (bullish), red (bearish), or gray (neutral) colors highlight key metrics.
- Check “Signal Confid” for confidence in buy/sell signals (higher is better, e.g., >60%).
3. **Trading Decisions**:
- Combine signals with your own analysis (e.g., support/resistance, news).
- Use Golden/Death Cross for long-term trend confirmation.
- Avoid trading in high volatility (dashboard: “Volatility: High”) unless experienced
Best Practices
- **Timeframe Selection**:
- Use higher timeframes (e.g., 4H, Daily) for more reliable signals, especially for Golden/Death Cross.
- Lower timeframes (e.g., 5m, 15m) may produce more signals but with higher noise.
- **Confirm Signals**:
- Cross-check buy/sell signals with dashboard metrics (e.g., Trend, MFI, ADX).
- Use Golden/Death Cross as a trend filter rather than a standalone signal.
- **Risk Management**:
- Always use stop-losses and position sizing based on your risk tolerance.
- Avoid trading during high volatility unless part of your strategy.
- **Regular Updates**:
- Monitor TradingView for script updates from the author (KoKalito) to access new features or bug fixes.
Troubleshooting
- **No Signals**:
- Ensure the chart timeframe matches your settings (e.g., 60m for MTF Period).
- Check if filters (Volume, ADX) are too strict; try disabling them.
- **Dashboard Missing**:
- Verify “Dashboard Position” is set to Left or Right.
- Ensure dashboard metrics are enabled (e.g., Show Comp Score).
- **Alerts Not Triggering**:
- Confirm the alert condition is set to “NeuroFlow Pro Indicator” and the correct option (e.g., “Golden Cross Alert”).
- Check TradingView’s “Alerts” panel for errors or expired alerts.
- Reapply the indicator to the chart if it was recently updated.
- **EMA Crosses Not Showing**:
- Zoom in on the chart to see 🚀 (Golden Cross) or 💀 (Death Cross) symbols.
- Ensure EMA 50 and EMA 200 lengths are not identical (defaults: 50, 200).
Support
- **Author**: KoKalito (check TradingView profile for updates or contact info).
- **TradingView Community**: Post questions in the TradingView Pine Script community or forums.
- **Documentation**: Refer to TradingView’s Pine Script v5 documentation for advanced customization.
- **Risk Warning**: Trading involves risk. Use the indicator as a tool, not a guarantee of profits. Always conduct your own analysis and manage risk appropriately.
Happy trading with **NeuroFlow Pro Indicator**! 🚀

Q Squeeze TrendQ Squeeze Trend
A sharp, signal-based trend tool that combines classic SuperTrend mechanics with configurable squeeze breakout logic and momentum confirmation. Built for clean entry points and minimalist charting — perfect for fast setups and real-time alerts.
🔧 Core Features
Configurable Squeeze Breakout Logic
• Detects low-volatility "squeeze" phases using customizable Bollinger Band vs. Keltner Channel logic
• Confirms breakouts only when momentum aligns with directional bias
SuperTrend Confirmation
• Filters noise and validates signals based on ATR-based trend logic
• Adds directional confidence before triggering signals
Alternating Signal Logic
• Ensures only one directional signal is active at a time
• Avoids repetitive entries and improves clarity
Clean Visual Feedback
• Directional arrows on confirmed buy/sell signals
• Optional colored fill between price and signal level
• Lightweight, non-intrusive label system
Real-Time Alerts
• Alerts for confirmed buy and sell setups
• Easy integration with webhooks, bots, or mobile notifications
⚙️ Configurable Inputs
• ATR Period & Multiplier – adjust SuperTrend sensitivity
• Squeeze Length, BB/KC Multipliers – fine-tune compression detection
• Signal Colors – customize arrow and background styling
✨ Highlights
• Designed for fast, visual trading with minimal clutter
• Non-repainting logic, effective across all timeframes
• Pairs well with structure, momentum, and volume strategies
📈 How to Use
• Enter on breakout arrows when trend, momentum, and squeeze align
• Use background fill to track current direction
• Exit on opposite signal, or combine with your own trade management logic
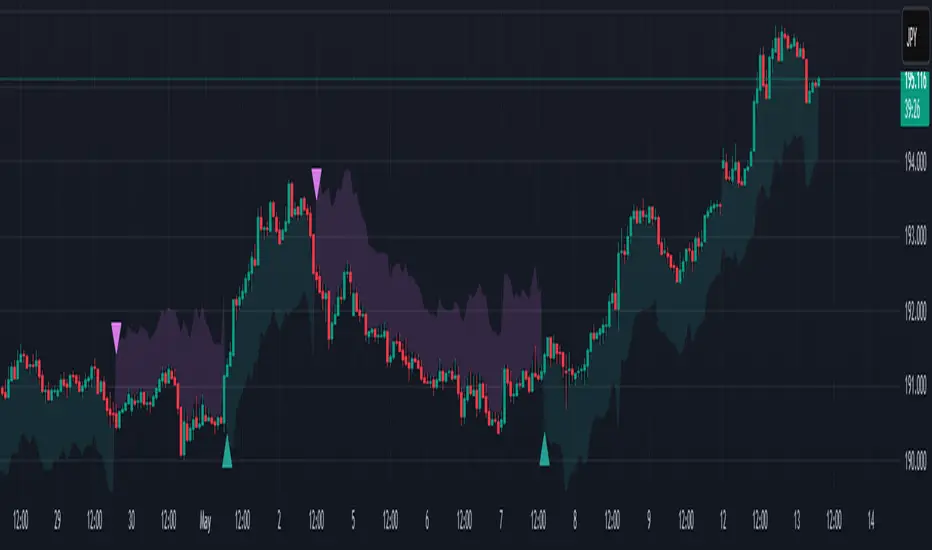
Gabriel's Asset Rotation System📈 Gabriel's Asset Rotation System
Overview
Gabriel’s Asset Rotation System is an advanced multi-asset trend-following tool that dynamically ranks and rotates up to 6 assets (plus USD) based on a customizable trend scoring matrix. Using enhanced signal detection techniques like Cauchy-weighted Supertrend, Jurík RSX, Fisherized CCI, Kalman-filtered PSAR, and Dynamic DMI Smoothing, the system identifies the most dominant asset and simulates strategy equity performance compared to buy-and-hold benchmarks.
🔍 Key Features
✅ Multi-Asset Rotation: Analyze up to 6 symbols and USD simultaneously.
✅ Relative Strength Matrix: Compares every asset against each other to find outperformers.
✅ Custom Trend Engine:
Jurik RSX with advanced RSX logic
Fisherized CCI for momentum confirmation
Kalman-smoothed PSAR for trend bias
SuperTrend using a Cauchy Moving Average
Smoothed DMI signal across looped periods (10–17)
✅ Dynamic Best Asset Detection: Identifies and tracks the asset with the highest trend score over time.
✅ Performance Table: Displays Sharpe, Sortino, and Omega Ratios along with drawdowns and means for both strategy and each asset.
✅ Visual Trend Matrix: Tabular view of asset strength comparisons against each other + final scoring.
✅ Realistic Strategy Equity Curve: Tracks performance assuming full capital rotation into the best asset.
✅ Alerts: Get notified when the top-performing asset changes.
⚙️ Inputs
🔹 Assets: Customize 6 tickers (crypto, stocks, ETFs, etc.)
🔹 Trend Classification Method:
RSI
CCI
SuperTrend
DMI
PSAR
or use all together
🔹 Jurik RSX Length
🔹 Fisherized CCI Length
🔹 Cauchy MA Gamma and ATR Settings
🔹 DMI Range and MA Type (SMA, EMA, HMA, etc.)
🔹 PSAR Parameters with Kalman smoothing
🔹 Custom Backtest Start Date
📊 Outputs
Plot 1: Best Asset Equity (colored dynamically)
Plot 2–7: Buy & Hold Curves for each asset (with labels)
Tables:
Rotation Matrix (bottom-right)
Best Performing Asset (bottom-center)
Performance Metrics Table (optional toggle)
🧠 Use Case Ideas
🔁 Dynamic Portfolio Rebalancing
⚖️ Compare Risk-Adjusted Returns Across Crypto or Stocks
🧪 Backtest Rotation Hypotheses
🚀 Identify Strongest Breakout Assets in Trend Environments
📉 Avoid Weakening Assets with Rising Drawdowns
🚨 Alerts
🔔 "New Optimal Asset": Triggers when a new top-ranking asset replaces the current one.
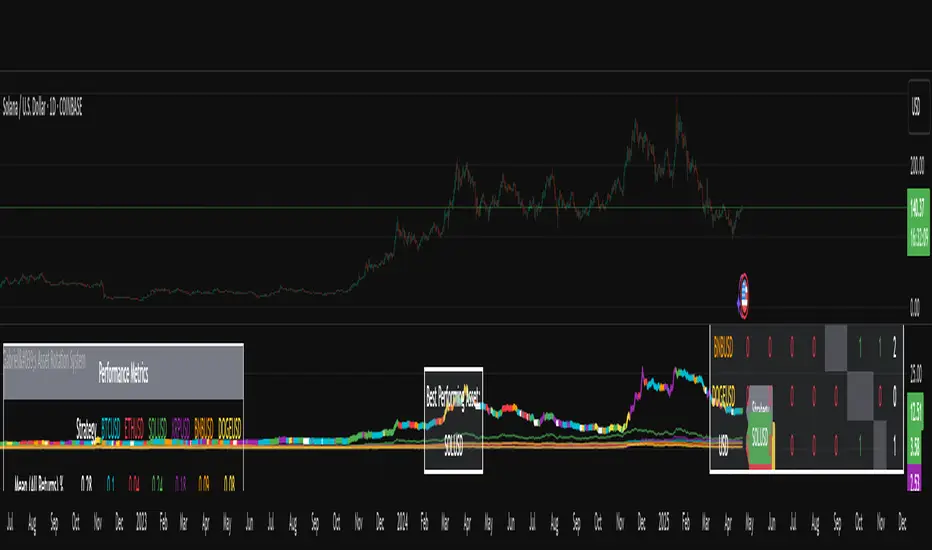
Ensemble Alerts█ OVERVIEW
This indicator creates highly customizable alert conditions and messages by combining several technical conditions into groups , which users can specify directly from the "Settings/Inputs" tab. It offers a flexible framework for building and testing complex alert conditions without requiring code modifications for each adjustment.
█ CONCEPTS
Ensemble analysis
Ensemble analysis is a form of data analysis that combines several "weaker" models to produce a potentially more robust model. In a trading context, one of the most prevalent forms of ensemble analysis is the aggregation (grouping) of several indicators to derive market insights and reinforce trading decisions. With this analysis, traders typically inspect multiple indicators, signaling trade actions when specific conditions or groups of conditions align.
Simplifying ensemble creation
Combining indicators into one or more ensembles can be challenging, especially for users without programming knowledge. It usually involves writing custom scripts to aggregate the indicators and trigger trading alerts based on the confluence of specific conditions. Making such scripts customizable via inputs poses an additional challenge, as it often involves complicated input menus and conditional logic.
This indicator addresses these challenges by providing a simple, flexible input menu where users can easily define alert criteria by listing groups of conditions from various technical indicators in simple text boxes . With this script, you can create complex alert conditions intuitively from the "Settings/Inputs" tab without ever writing or modifying a single line of code. This framework makes advanced alert setups more accessible to non-coders. Additionally, it can help Pine programmers save time and effort when testing various condition combinations.
█ FEATURES
Configurable alert direction
The "Direction" dropdown at the top of the "Settings/Inputs" tab specifies the allowed direction for the alert conditions. There are four possible options:
• Up only : The indicator only evaluates upward conditions.
• Down only : The indicator only evaluates downward conditions.
• Up and down (default): The indicator evaluates upward and downward conditions, creating alert triggers for both.
• Alternating : The indicator prevents alert triggers for consecutive conditions in the same direction. An upward condition must be the first occurrence after a downward condition to trigger an alert, and vice versa for downward conditions.
Flexible condition groups
This script features six text inputs where users can define distinct condition groups (ensembles) for their alerts. An alert trigger occurs if all the conditions in at least one group occur.
Each input accepts a comma-separated list of numbers with optional spaces (e.g., "1, 4, 8"). Each listed number, from 1 to 35, corresponds to a specific individual condition. Below are the conditions that the numbers represent:
1 — RSI above/below threshold
2 — RSI below/above threshold
3 — Stoch above/below threshold
4 — Stoch below/above threshold
5 — Stoch K over/under D
6 — Stoch K under/over D
7 — AO above/below threshold
8 — AO below/above threshold
9 — AO rising/falling
10 — AO falling/rising
11 — Supertrend up/down
12 — Supertrend down/up
13 — Close above/below MA
14 — Close below/above MA
15 — Close above/below open
16 — Close below/above open
17 — Close increase/decrease
18 — Close decrease/increase
19 — Close near Donchian top/bottom (Close > (Mid + HH) / 2)
20 — Close near Donchian bottom/top (Close < (Mid + LL) / 2)
21 — New Donchian high/low
22 — New Donchian low/high
23 — Rising volume
24 — Falling volume
25 — Volume above average (Volume > SMA(Volume, 20))
26 — Volume below average (Volume < SMA(Volume, 20))
27 — High body to range ratio (Abs(Close - Open) / (High - Low) > 0.5)
28 — Low body to range ratio (Abs(Close - Open) / (High - Low) < 0.5)
29 — High relative volatility (ATR(7) > ATR(40))
30 — Low relative volatility (ATR(7) < ATR(40))
31 — External condition 1
32 — External condition 2
33 — External condition 3
34 — External condition 4
35 — External condition 5
These constituent conditions fall into three distinct categories:
• Directional pairs : The numbers 1-22 correspond to pairs of opposing upward and downward conditions. For example, if one of the inputs includes "1" in the comma-separated list, that group uses the "RSI above/below threshold" condition pair. In this case, the RSI must be above a high threshold for the group to trigger an upward alert, and the RSI must be below a defined low threshold to trigger a downward alert.
• Non-directional filters : The numbers 23-30 correspond to conditions that do not represent directional information. These conditions act as filters for both upward and downward alerts. Traders often use non-directional conditions to refine trending or mean reversion signals. For instance, if one of the input lists includes "30", that group uses the "Low relative volatility" condition. The group can trigger an upward or downward alert only if the 7-period Average True Range (ATR) is below the 40-period ATR.
• External conditions : The numbers 31-35 correspond to external conditions based on the plots from other indicators on the chart. To set these conditions, use the source inputs in the "External conditions" section near the bottom of the "Settings/Inputs" tab. The external value can represent an upward, downward, or non-directional condition based on the following logic:
▫ Any value above 0 represents an upward condition.
▫ Any value below 0 represents a downward condition.
▫ If the checkbox next to the source input is selected, the condition becomes non-directional . Any group that uses the condition can trigger upward or downward alerts only if the source value is not 0.
To learn more about using plotted values from other indicators, see this article in our Help Center and the Source input section of our Pine Script™ User Manual.
Group markers
Each comma-separated list represents a distinct group , where all the listed conditions must occur to trigger an alert. This script assigns preset markers (names) to each condition group to make the active ensembles easily identifiable in the generated alert messages and labels. The markers assigned to each group use the format "M", where "M" is short for "Marker" and "x" is the group number. The titles of the inputs at the top of the "Settings/Inputs" tab show these markers for convenience.
For upward conditions, the labels and alert messages show group markers with upward triangles (e.g., "M1▲"). For downward conditions, they show markers with downward triangles (e.g., "M1▼").
NOTE: By default, this script populates the "M1" field with a pre-configured list for a mean reversion group ("2,18,24,28"). The other fields are empty. If any "M*" input does not contain a value, the indicator ignores it in the alert calculations.
Custom alert messages
By default, the indicator's alert message text contains the activated markers and their direction as a comma-separated list. Users can override this message for upward or downward alerts with the two text fields at the bottom of the "Settings/Inputs" tab. When the fields are not empty , the alerts use that text instead of the default marker list.
NOTE: This script generates alert triggers, not the alerts themselves. To set up an alert based on this script's conditions, open the "Create Alert" dialog box, then select the "Ensemble Alerts" and "Any alert() function call" options in the "Condition" tabs. See the Alerts FAQ in our Pine Script™ User Manual for more information.
Condition visualization
This script offers organized visualizations of its conditions, allowing users to inspect the behaviors of each condition alongside the specified groups. The key visual features include:
1) Conditional plots
• The indicator plots the history of each individual condition, excluding the external conditions, as circles at different levels. Opposite conditions appear at positive and negative levels with the same absolute value. The plots for each condition show values only on the bars where they occur.
• Each condition's plot is color-coded based on its type. Aqua and orange plots represent opposing directional conditions, and purple plots represent non-directional conditions. The titles of the plots also contain the condition numbers to which they apply.
• The plots in the separate pane can be turned on or off with the "Show plots in pane" checkbox near the top of the "Settings/Inputs" tab. This input only toggles the color-coded circles, which reduces the graphical load. If you deactivate these visuals, you can still inspect each condition from the script's status line and the Data Window.
• As a bonus, the indicator includes "Up alert" and "Down alert" plots in the Data Window, representing the combined upward and downward ensemble alert conditions. These plots are also usable in additional indicator-on-indicator calculations.
2) Dynamic labels
• The indicator draws a label on the main chart pane displaying the activated group markers (e.g., "M1▲") each time an alert condition occurs.
• The labels for upward alerts appear below chart bars. The labels for downward alerts appear above the bars.
NOTE: This indicator can display up to 500 labels because that is the maximum allowed for a single Pine script.
3) Background highlighting
• The indicator can highlight the main chart's background on bars where upward or downward condition groups activate. Use the "Highlight background" inputs in the "Settings/Inputs" tab to enable these highlights and customize their colors.
• Unlike the dynamic labels, these background highlights are available for all chart bars, irrespective of the number of condition occurrences.
█ NOTES
• This script uses Pine Script™ v6, the latest version of TradingView's programming language. See the Release notes and Migration guide to learn what's new in v6 and how to convert your scripts to this version.
• This script imports our new Alerts library, which features functions that provide high-level simplicity for working with complex compound conditions and alerts. We used the library's `compoundAlertMessage()` function in this indicator. It evaluates items from "bool" arrays in groups specified by an array of strings containing comma-separated index lists , returning a tuple of "string" values containing the marker of each activated group.
• The script imports the latest version of the ta library to calculate several technical indicators not included in the built-in `ta.*` namespace, including Double Exponential Moving Average (DEMA), Triple Exponential Moving Average (TEMA), Fractal Adaptive Moving Average (FRAMA), Tilson T3, Awesome Oscillator (AO), Full Stochastic (%K and %D), SuperTrend, and Donchian Channels.
• The script uses the `force_overlay` parameter in the label.new() and bgcolor() calls to display the drawings and background colors in the main chart pane.
• The plots and hlines use the available `display.*` constants to determine whether the visuals appear in the separate pane.
Look first. Then leap.

Batman - IndicatorThe Batman - Indicator is an advanced trend-following tool that combines multiple methodologies to provide traders with actionable insights for efficient decision-making. This comprehensive indicator leverages both classic and innovative approaches to detect market trends, identify relative strength, and signal entry/exit opportunities. Key features include:
Core Features:
1. Trend Analysis with ADX :
- Measures trend strength and signals shifts in momentum using the Average Directional Index (ADX).
- Configurable parameters allow traders to fine-tune the threshold for their preferred trading style.
2. Relative Strength (RS) Evaluation :
- Analyzes the relative strength of the asset compared to broader market indices (e.g., CRYPTOCAP:TOTAL, NSE:NIFTY, NASDAQ:NDX).
- Provides intuitive visual cues with strength and weakness coloring for quick decision-making.
3. Volume-Based Price Action Insights :
- Highlights bars with significant volume activity relative to a configurable moving average.
- Identifies potential turning points and momentum using color-coded volume bars.
4. 52-Week High/Low Detection :
- Tracks and flags new 52-week highs or lows to highlight key levels of interest.
- Adds context for long-term market trends and potential breakout/breakdown points.
5. Donchian Channel Breakouts :
- Detects changes in Donchian channel levels, signaling potential breakout or reversal scenarios.
6. Multi-Layered Scoring System :
- Combines ADX and RSI to score market conditions on a scale from bearish (Z) to bullish (A).
- Includes intermediate levels (X, Y, C) to capture nuanced shifts in sentiment.
7. Exit Strategies :
- Features customizable exit indicators, offering a choice between SuperTrend and VStop .
- Provides dynamic, visually distinct trendlines for clear trend-following exits.
Unique Value:
- Unlike traditional single-purpose indicators, the Batman - Indicator integrates multiple tools into a single cohesive framework.
- Each component is independently configurable, allowing traders to adapt the indicator to their unique strategy and risk tolerance.
- Background color and plot shapes improve visual clarity, ensuring ease of use during fast-paced trading sessions.
Use Cases:
- Scalping and intraday trading with dynamic trend and volume signals.
- Swing and positional trading with long-term high/low levels and trend exits.
- Relative strength analysis for pair trading or benchmarking performance against broader markets.
How It Works:
- Trend Identification : Utilizes ADX and RSI to provide directional bias and signal overbought/oversold conditions.
- Volume Analysis : Highlights potential areas of interest based on abnormal volume activity.
- Breakout Signals : Detects new 52-week highs/lows and Donchian channel breakouts for actionable alerts.
- Exit Planning : Offers clear, customizable exit levels via SuperTrend or VStop, reducing emotional decision-making.
Configuration:
- The indicator includes customizable inputs for all calculations (length, thresholds, multipliers) to suit diverse market conditions and trading styles.
- Default settings provide a balanced approach suitable for most markets but can be tailored as needed.
---
Instructions for Use:
1. Add the indicator to your chart and configure the inputs according to your trading timeframe and asset type.
2. Pay attention to the ADX-RSI Scoring System for overall market sentiment.
3. Use volume-based price action and 52-week breakout signals to identify potential entries.
4. Exit trades based on the chosen exit indicator (SuperTrend or VStop) to manage risk and lock in profits.
Alerts:
- Set up alerts for scoring system changes, 52-week high/low breakouts, and exit signals for seamless trading automation.
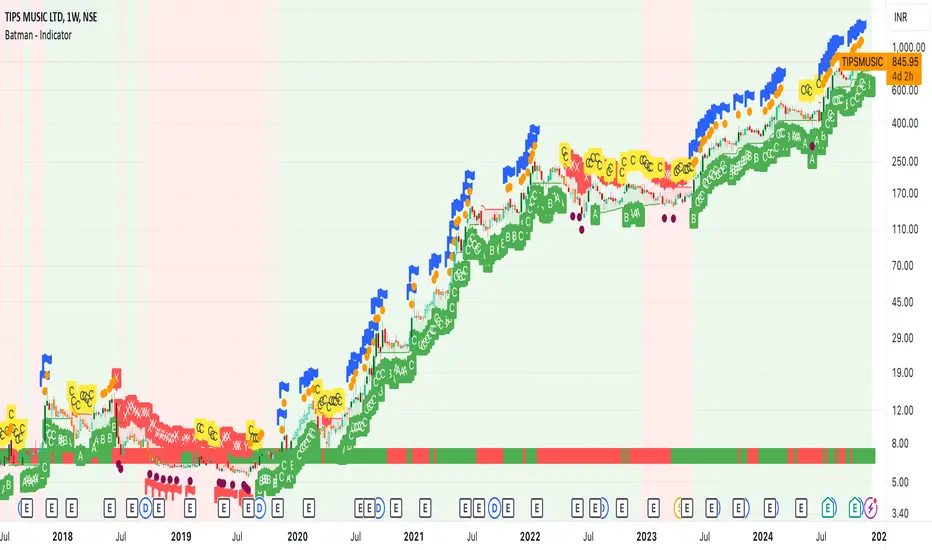
MadTrend [InvestorUnknown]The MadTrend indicator is an experimental tool that combines the Median and Median Absolute Deviation (MAD) to generate signals, much like the popular Supertrend indicator. In addition to identifying Long and Short positions, MadTrend introduces RISK-ON and RISK-OFF states for each trade direction, providing traders with nuanced insights into market conditions.
Core Concepts
Median and Median Absolute Deviation (MAD)
Median: The middle value in a sorted list of numbers, offering a robust measure of central tendency less affected by outliers.
Median Absolute Deviation (MAD): Measures the average distance between each data point and the median, providing a robust estimation of volatility.
Supertrend-like Functionality
MadTrend utilizes the median and MAD in a manner similar to how Supertrend uses averages and volatility measures to determine trend direction and potential reversal points.
RISK-ON and RISK-OFF States
RISK-ON: Indicates favorable conditions for entering or holding a position in the current trend direction.
RISK-OFF: Suggests caution, signaling RISK-ON end and potential trend weakening or reversal.
Calculating MAD
The mad function calculates the median of the absolute deviations from the median, providing a robust measure of volatility.
// Function to calculate the Median Absolute Deviation (MAD)
mad(series float src, simple int length) =>
med = ta.median(src, length) // Calculate median
abs_deviations = math.abs(src - med) // Calculate absolute deviations from median
ta.median(abs_deviations, length) // Return the median of the absolute deviations
MADTrend Function
The MADTrend function calculates the median and MAD-based upper (med_p) and lower (med_m) bands. It determines the trend direction based on price crossing these bands.
MADTrend(series float src, simple int length, simple float mad_mult) =>
// Calculate MAD (volatility measure)
mad_value = mad(close, length)
// Calculate the MAD-based moving average by scaling the price data with MAD
median = ta.median(close, length)
med_p = median + (mad_value * mad_mult)
med_m = median - (mad_value * mad_mult)
var direction = 0
if ta.crossover(src, med_p)
direction := 1
else if ta.crossunder(src, med_m)
direction := -1
Trend Direction and Signals
Long Position (direction = 1): When the price crosses above the upper MAD band (med_p).
Short Position (direction = -1): When the price crosses below the lower MAD band (med_m).
RISK-ON: When the price moves further in the direction of the trend (beyond median +- MAD) after the initial signal.
RISK-OFF: When the price retraces towards the median, signaling potential weakening of the trend.
RISK-ON and RISK-OFF States
RISK-ON LONG: Price moves above the upper band after a Long signal, indicating strengthening bullish momentum.
RISK-OFF LONG: Price falls back below the upper band, suggesting potential weakness in the bullish trend.
RISK-ON SHORT: Price moves below the lower band after a Short signal, indicating strengthening bearish momentum.
RISK-OFF SHORT: Price rises back above the lower band, suggesting potential weakness in the bearish trend.
Picture below show example RISK-ON periods which can be identified by “cloud”
Note: Highlighted areas on the chart indicating RISK-ON and RISK-OFF periods for both Long and Short positions.
Implementation Details
Inputs and Parameters:
Source (input_src): The price data used for calculations (e.g., close, open, high, low).
Median Length (length): The number of periods over which the median and MAD are calculated.
MAD Multiplier (mad_mult): Determines the distance of the upper and lower bands from the median.
Calculations:
Median and MAD are recalculated each period based on the specified length.
Upper (med_p) and Lower (med_m) Bands are computed by adding and subtracting the scaled MAD from the median.
Visual representation of the indicator on a price chart:
Backtesting and Performance Metrics
The MadTrend indicator includes a Backtesting Mode with a performance metrics table to evaluate its effectiveness compared to a simple buy-and-hold strategy.
Equity Calculation:
Calculates the equity curve based on the signals generated by the indicator.
Performance Metrics:
Metrics such as Mean Returns, Standard Deviation, Sharpe Ratio, Sortino Ratio, and Omega Ratio are computed.
The metrics are displayed in a table for both the strategy and the buy-and-hold approach.
Note: Due to the use of labels and plot shapes, automatic chart scaling may not function ideally in Backtest Mode.
Alerts and Notifications
MadTrend provides alert conditions to notify traders of significant events:
Trend Change Alerts
RISK-ON and RISK-OFF Alerts - Provides real-time notifications about the RISK-ON and RISK-OFF states for proactive trade management.
Customization and Calibration
Default Settings: The provided default settings are experimental and not optimized. They serve as a starting point for users.
Parameter Adjustment: Traders are encouraged to calibrate the indicator's parameters (e.g., length, mad_mult) to suit their specific trading style and the characteristics of the asset being analyzed.
Source Input: The indicator allows for different price inputs (open, high, low, close, etc.), offering flexibility in how the median and MAD are calculated.
Important Notes
Market Conditions: The effectiveness of the MadTrend indicator can vary across different market conditions. Regular calibration is recommended.
Backtest Limitations: Backtesting results are historical and do not guarantee future performance.
Risk Management: Always apply sound risk management practices when using any trading indicator.

RV- Dynamic Trend AnalyzerRV Dynamic Trend Analyzer
The RV Dynamic Trend Analyzer is a powerful TradingView indicator designed to help traders identify and capitalize on trends across multiple time frames—daily, weekly, and monthly. With dynamic adjustments to key technical indicators like EMA and MACD, the tool adapts to different chart periods, ensuring more accurate signals. Whether you are swing trading or holding longer-term positions, this indicator provides reliable buy/sell signals, breakout opportunities, and customizable visual elements to enhance decision-making. Its intelligent use of EMAs and MACD values ensures high potential returns, making it suitable for traders seeking strong, data-driven strategies. Below are its core features and their respective benefits.
Supertrend Indicator:
Importance: The Supertrend is a trend-following tool that helps traders identify the market’s direction by offering clear buy and sell signals based on price movement relative to the Supertrend line.
Benefits:
Helps filter out market noise and enables traders to stay in trends longer.
The pullback detection feature enhances trade timing by identifying potential entry points during retracements.
ATH/ATL & 52-Week High/Low with Candle Coloring:
Importance: Tracking all-time highs (ATH), all-time lows (ATL), and 52-week high/low levels helps traders identify key support and resistance levels.
Benefits:
Offers insights into the strength of price movements and potential reversal zones.
Candle coloring improves visual analysis, allowing quick identification of bullish or bearish conditions at critical levels.
Multi-Time Frame Analysis
Importance: The ability to view indicators like RSI and MACD across multiple time frames provides a more in-depth and comprehensive view of market behavior, allowing traders to make informed decisions that align with both short-term and long-term trends.
Benefits:
Align Strategies Across Time frames: By using multiple time frames, traders can align their strategies with larger trends (such as weekly or daily) while executing trades on lower time frames (like 1-minute or 5-minute charts). This improves the accuracy of trade entries and exits.
Reduce False Signals: Viewing key technical indicators like RSI and MACD across different time frames reduces the likelihood of false signals by offering a broader market context, filtering out noise from smaller time frames.
Customization of Table Display: Traders can customize the position and size of a table that displays RSI and MACD values for selected time frames. This flexibility enhances visibility and ease of analysis.
Time frame-Specific Data: The code allows for displaying RSI and MACD data for up to seven different time frames, making it highly customizable for traders depending on their preferred analysis period.
Visual Clarity: The table displays key values such as RSI and MACD histogram readings in a visually clear format, with color coding to quickly indicate overbought/oversold levels or MACD crossovers.
Pivot Points:
Importance: Pivot points serve as key support and resistance levels that help predict potential price movements.
Benefits:
Assists in identifying potential reversal zones and breakout points, aiding in trade planning.
Displaying pivot points across multiple time frames enhances market insight and improves strategic planning.
Quarterly Earnings Table:
Importance: Understanding a company’s quarterly earnings releases is crucial, as these events often lead to significant price volatility. Traders can leverage this information to adjust their strategies around earnings reports and prevent unexpected losses.
Benefits:
Helps traders anticipate potential price movements due to earnings reports.
Allows traders to avoid sudden losses by being aware of important earnings announcements and adjusting positions accordingly.
Customizable Visuals for Traders:
Dark Mode: Toggle between dark and light themes based on your chart's color scheme.
Mini Mode: A condensed version that visually simplifies the data, making it quicker to interpret through color-coded traffic lights (green for positive, red for negative).
Table Size & Position: Customize the size and position of the table for better visibility on your charts.
Data Period (FQ vs FY): Easily switch between displaying quarterly or yearly data based on the selected period.
Top-Left Cell Display: Option to display Free Float or Market Cap in the top-left cell for quick reference.
Exponential Moving Averages (EMAs) with Adjustable Lengths:
Importance: EMAs are essential for identifying trends and generating reliable buy/sell signals. The indicator plots four EMAs that dynamically adjust based on the selected time frame.
Benefits:
Dynamic Time frame Logic: EMA lengths and sources automatically adapt based on whether the user selects daily, weekly, or monthly time frames. This ensures the EMAs are relevant for the chosen strategy.
Multiple EMAs: By incorporating four different EMAs, users can observe both short-term and long-term trends simultaneously, improving their ability to identify key trend shifts.
Breakout Arrow Functionality:
Importance: This feature visually signals potential buy/sell opportunities based on the interaction between EMAs and MACD crossovers.
Benefits:
Crossover Signals: Arrows are plotted when EMAs and MACD cross, indicating breakout opportunities and aiding in quick trade decisions.
RSI Filter Option: Users can apply an optional RSI filter to refine buy/sell signals, reducing false signals and improving overall accuracy.
Disclaimer:
Before engaging in actual trading, we strongly recommend back testing the this indicator to ensure it fits your trading style and risk tolerance. Be sure to adjust your risk-reward ratio and set appropriate stop-loss levels to safeguard your investments. Proper risk management is key to successful trading.

Super Trend ReversalsMain Concept
The core idea behind the Super Trend Reversals indicator is to assess the momentum of automated trading bots (often referred to as 'Supertrend bots') that enter the market during critical turning points. Specifically, the indicator is tuned to identify when the market is nearing bottoms or peaks, but just before it shifts direction based on the triggered Supertrend signals. This approach helps traders engage with the market right as the reversal momentum builds up, allowing for entry just as conditions become favorable and exit before momentum wanes.
How It Works
The Super Trend Reversals uses multiple Supertrend calculations, each with different period and multiplier settings, to form a comprehensive view of the trend. The total trend score from these calculations is then analyzed using the Relative Strength Index (RSI) and Exponential Moving Averages (EMA) to gauge the strength and sustainability of the trend.
A key feature of this indicator is the isCurrentRangeSmaller() function, which evaluates if the current price range is lower than the average over the recent period. This function is critical as it helps determine the stability of the market environment, reducing the likelihood of entering or exiting trades based on erratic price movements that could lead to false signals.

Uptrick: Comprehensive Market Sentiment DashboardIntroducing "Uptrick: Comprehensive Market Sentiment Dashboard"—an advanced trading indicator designed to provide traders with a complete and detailed overview of market conditions for multiple assets at a glance. This sophisticated tool is engineered to enhance your trading decisions by consolidating key technical indicators into a single, easy-to-read dashboard. Perfect for both novice and experienced traders, the Uptrick Dashboard is built to offer a competitive edge in the dynamic world of trading.
### Purpose
The primary goal of the Uptrick Dashboard is to equip traders with a powerful, all-in-one solution that streamlines market analysis. By combining multiple technical indicators and presenting their outputs in a cohesive format, this dashboard eliminates the need to toggle between different charts and tools. It delivers a clear, immediate understanding of market sentiment across various assets, enabling faster and more informed trading decisions.
### Features and Inputs
The Uptrick Dashboard integrates several widely-used technical indicators, each customizable to fit your specific trading strategy. Here’s a detailed breakdown of the features and input parameters:
1. **Exponential Moving Average (EMA)**
- **Input Parameter:** EMA Length
- **Purpose:** Tracks the asset’s price trend by smoothing out price data over a specified period.
2. **Simple Moving Average (SMA)**
- **Input Parameter:** SMA Length
- **Purpose:** Provides a simpler, more straightforward calculation of price trends compared to EMA.
3. **Relative Strength Index (RSI)**
- **Input Parameter:** RSI Length
- **Purpose:** Measures the magnitude of recent price changes to evaluate overbought or oversold conditions.
4. **Moving Average Convergence Divergence (MACD)**
- **Input Parameters:** MACD Fast Length, MACD Slow Length, MACD Signal Length
- **Purpose:** Identifies changes in the strength, direction, momentum, and duration of a trend.
5. **Bollinger Bands (BB)**
- **Input Parameters:** BB Length, BB StdDev
- **Purpose:** Provides a visual representation of volatility and relative price levels over a specified period.
6. **Ichimoku Cloud**
- **Input Parameters:** Ichimoku Tenkan Length, Ichimoku Kijun Length, Ichimoku Span A Length, Ichimoku Span B Length
- **Purpose:** Offers a comprehensive view of support and resistance levels, momentum, and trend direction.
7. **Supertrend**
- **Input Parameters:** Supertrend ATR Length, Supertrend Multiplier
- **Purpose:** Combines trend direction and volatility to provide buy and sell signals.
8. **Symbols Input**
- **Input Parameter:** Symbols (comma separated)
- **Purpose:** Allows users to specify and monitor multiple assets simultaneously.
### Customization and Flexibility
Each indicator within the Uptrick Dashboard is fully customizable, allowing you to adjust parameters to align with your trading strategy. Whether you prefer short-term trading with faster indicators or long-term analysis with slower, more reliable data, this dashboard can be tailored to meet your needs.
### Key Differentiators
What sets the Uptrick Dashboard apart from other market sentiment tools is its unparalleled integration of multiple technical indicators into a single, comprehensive view. This consolidation not only saves time but also provides a more holistic understanding of market conditions. Here’s what makes the Uptrick Dashboard unique:
- **Integrated Analysis:** Combines multiple indicators to provide a unified market sentiment.
- **Customizable Inputs:** Each indicator can be adjusted to suit your specific trading strategy.
- **Multi-Asset Monitoring:** Track and analyze several assets simultaneously.
- **User-Friendly Interface:** Designed for ease of use, presenting data in an organized, visually appealing format.
- **Real-Time Updates:** Continuously updates to reflect the latest market data.
### Future Updates
We are committed to continually improving the Uptrick Dashboard to ensure it remains a valuable tool in your trading arsenal. Users can expect regular updates that will introduce new features, enhance existing functionalities, and incorporate user feedback. Future updates may include:
- **Additional Indicators:** Introducing new technical indicators to provide even deeper insights.
- **Enhanced Visualization:** Improved graphical representations for better data interpretation.
- **Automation Features:** Tools to automate certain trading strategies based on indicator outputs.
- **User Customization:** More options for personalizing the dashboard to fit individual preferences.
### How It Works
The Uptrick Dashboard operates by calculating key technical indicators for each specified asset and displaying the results in a neatly organized table. Here’s a closer look at how it works:
1. **Input Parameters:** Users input their preferred settings for each indicator, including the list of assets to monitor.
2. **Data Retrieval:** The dashboard retrieves real-time market data for each specified asset.
3. **Indicator Calculation:** Using the input parameters, the dashboard calculates the values for each technical indicator.
4. **Visual Display:** Results are displayed in a table format, highlighting key information such as price, 24-hour change, and sentiment indicators (e.g., MACD, RSI, Bollinger Bands).
5. **Final Position:** The dashboard calculates an overall market position (Long, Short, or Neutral) based on the combined outputs of the individual indicators.
### Conclusion
The "Uptrick: Comprehensive Market Sentiment Dashboard" is a must-have tool for traders seeking a streamlined, efficient way to monitor market conditions across multiple assets. By integrating essential technical indicators into a single, customizable dashboard, it provides a comprehensive view of market sentiment, facilitating quicker and more informed trading decisions. Stay ahead of the market with Uptrick and experience the difference that a well-designed, all-in-one trading tool can make.
With regular updates and a commitment to excellence, the Uptrick Dashboard is poised to evolve continually, adapting to the changing needs of traders and the dynamics of the market. Whether you’re a seasoned trader or just starting out, the Uptrick Dashboard offers the insights and flexibility needed to enhance your trading strategy. Invest in the Uptrick Dashboard today and take your trading to the next level.
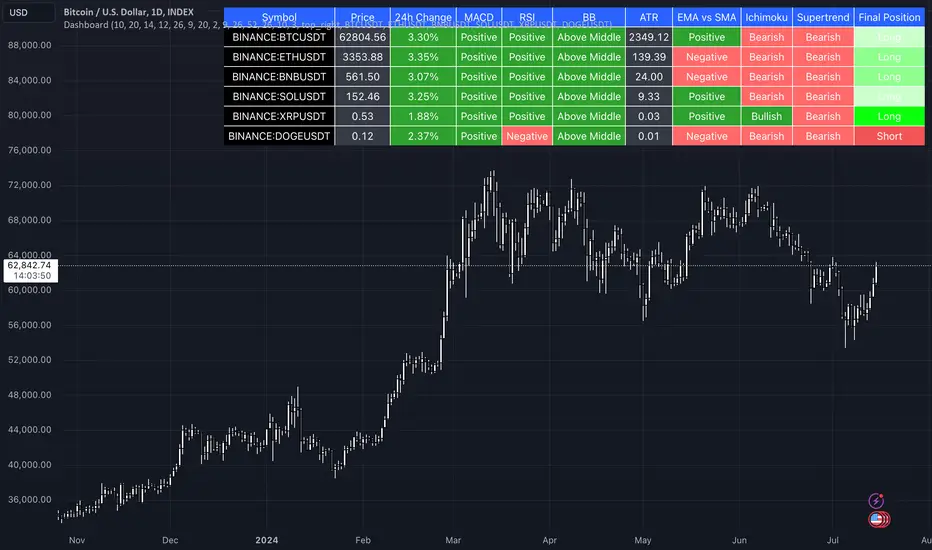
Kalman Hull RSI [BackQuant]Kalman Hull RSI
At its core, this indicator uses a Kalman filter of price, put inside of a hull moving average function (replacing the weighted moving averages) and then using that as a price source for the the RSI, very similar to the Kalman Hull Supertrend just processing price for a different indicator.
This also allows it to make it more adaptive to price and also sensitive to recent price action. This indicator is also mainly built for trend-following systems
PLEASE Read the following, knowing what an indicator does at its core before adding it into a system is pivotal. The core concepts can allow you to include it in a logical and sound manner.
1. What is a Kalman Filter
The Kalman Filter is an algorithm renowned for its efficiency in estimating the states of a linear dynamic system amidst noisy data. It excels in real-time data processing, making it indispensable in fields requiring precise and adaptive filtering, such as aerospace, robotics, and financial market analysis. By leveraging its predictive capabilities, traders can significantly enhance their market analysis, particularly in estimating price movements more accurately.
If you would like this on its own, with a more in-depth description please see our Kalman Price Filter.
OR our Kalman Hull Supertrend
2. Hull Moving Average (HMA) and Its Core Calculation
The Hull Moving Average (HMA) improves on traditional moving averages by combining the Weighted Moving Average's (WMA) smoothness and reduced lag. Its core calculation involves taking the WMA of the data set and doubling it, then subtracting the WMA of the full period, followed by applying another WMA on the result over the square root of the period's length. This methodology yields a smoother and more responsive moving average, particularly useful for identifying market trends more rapidly.
3. Combining Kalman Filter with HMA
The innovative combination of the Kalman Filter with the Hull Moving Average (KHMA) offers a unique approach to smoothing price data. By applying the Kalman Filter to the price source before its incorporation into the HMA formula, we enhance the adaptiveness and responsiveness of the moving average. This adaptive smoothing method reduces noise more effectively and adjusts more swiftly to price changes, providing traders with clearer signals for market entries or exits.
The calculation is like so:
KHMA(_src, _length) =>
f_kalman(2 * f_kalman(_src, _length / 2) - f_kalman(_src, _length), math.round(math.sqrt(_length)))
Use Case
The Kalman Hull RSI is particularly suited for traders who require a highly adaptive indicator that can respond to rapid market changes without the excessive noise associated with typical RSI calculations. It can be effectively used in markets with high volatility where traditional indicators might lag or produce misleading signals.
Application in a Trading System
The Kalman Hull RSI is versatile in application, suitable for:
Trend Identification: Quickly identify potential reversals or confirmations of existing trends.
Overbought/Oversold Conditions: Utilize the dynamic RSI thresholds to pinpoint potential entry and exit points, adapting to current market conditions.
Risk Management: Enhance trading strategies by integrating a more reliable measure of momentum, which can lead to improved stop-loss placements and exit strategies.
Core Calculations and Benefits
Dynamic State Estimation: By applying the Kalman Filter, the indicator continually adjusts its calculations based on incoming price data, providing a real-time, smoothed response to price movements.
Reduced Lag: The integration with HMA significantly reduces lag, offering quicker responses to price changes than traditional moving averages or RSI alone.
Increased Accuracy: The dual filtering effect minimizes the impact of price spikes and noise, leading to more accurate signaling for trades.
Thus following all of the key points here are some sample backtests on the 1D Chart
Disclaimer: Backtests are based off past results, and are not indicative of the future.
INDEX:BTCUSD
INDEX:ETHUSD
BINANCE:SOLUSD