Trend Following Volatility Trail*Script was previously removed by Moderators at 1.8k boosts* - This was out of my control. This script was very popular and seemed to help a lot of traders. I am re uploading to help the community!
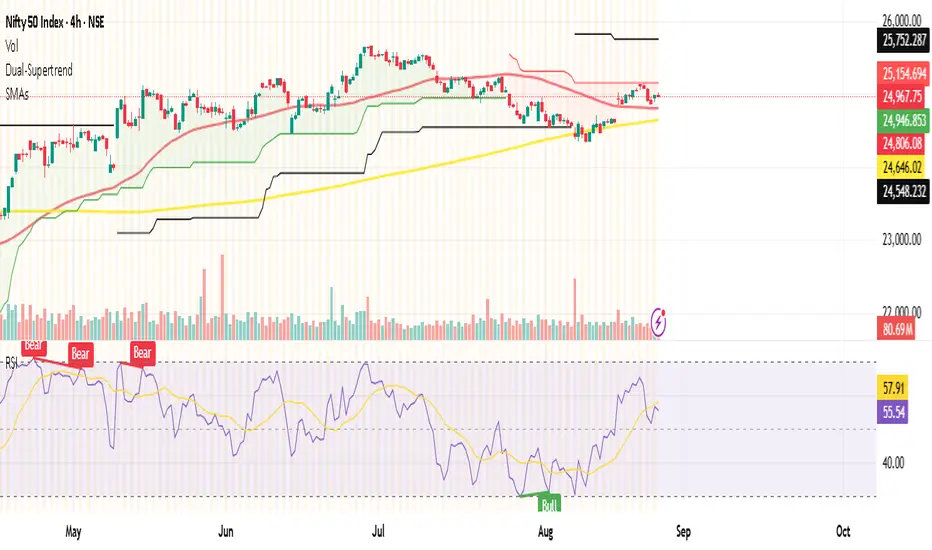
Trend Following Volatility Trail
The Trend Following Volatility Trail is a dynamic trend-following tool that adapts its stop, bias, and zones to real-time volatility and trend strength. Instead of using static ATR multiples like a normal Supertrend or Chandelier Stop, it continuously adjusts itself based on how stretched the market is and how persistent the trend has been. This indicator is based on volatility weighted EMAC
This makes the system far more reactive during momentum phases and more conservative during consolidation, helping avoid fake flips and late entries.
How It Works
The indicator builds an adaptive trail around a smoothed price basis:
– It starts with a short EMA as the “core trend line.”
– It measures volatility expansion versus normal volatility.
– It measures trend persistence by reading whether price has been rising or falling consistently.
– These two components combine to adjust the ATR multiplier dynamically.
As volatility expands or the trend becomes more persistent, the bands widen.
When volatility compresses or the trend weakens, the bands tighten.
These adaptive bands form the foundation of the trailing system.
Bull & Bear State Logic
The tool constantly tracks whether price is above or below the adaptive trail:
Price above the upper trail → Bullish regime
Price below the lower trail → Bearish regime
But instead of flipping immediately, it waits for confirmation bars to avoid noise.
This greatly reduces whipsaws and keeps the focus on sustained moves.
Once a new regime is confirmed:
– A coloured cloud appears (bull or bear)
– A label marks the flip point
– Alerts can be triggered automatically
Best Uses
Identifying regime shifts early
Riding sustained trends with confidence
Avoiding choppy markets by requiring confirmation
Using the adaptive cloud as a directional bias layer
Cari dalam skrip untuk "supertrend"

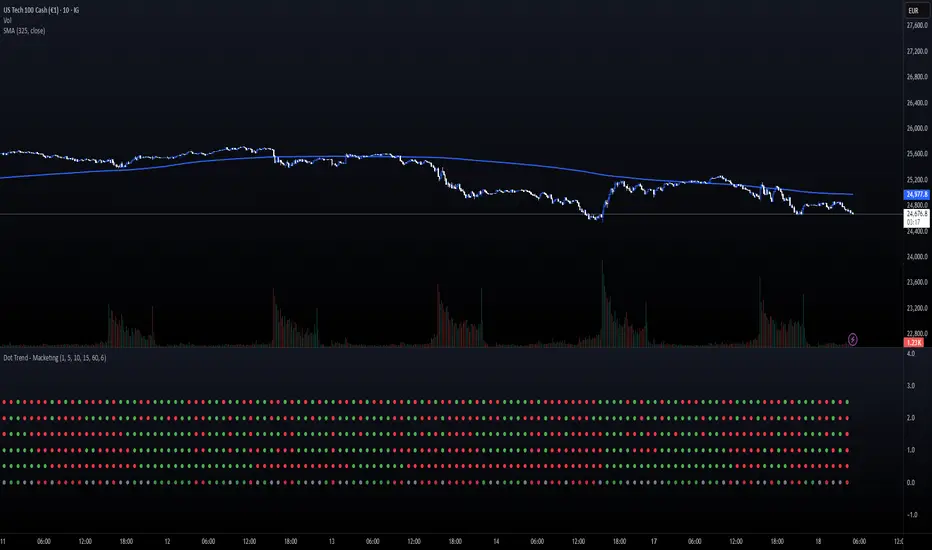
Dot Trend - MacketingDOT TRENDS (5x Multi-Timeframe Consensus Filter)
Description:
The DOT TRENDS indicator is a powerful, highly customizable tool designed to provide a clear, aggregated view of trend direction across five distinct timeframes (TFs). It uses an advanced ATR-based trailing mechanism coupled with an optional MACD filter to generate reliable trend signals, making multi-timeframe analysis simple and non-cluttered.
This indicator is ideal for scalpers and day traders who need immediate confirmation that market momentum aligns across various horizons (e.g., 1m, 5m, 15m, 1h).
Key Features:
5-Tier Trend Alignment: Track the trend across five fully customizable timeframes simultaneously (Default: 1m, 5m, 10m, 15m, 60m).
Clean Visual Design: Trends are represented by large, clear dots (Green for Bullish, Red for Bearish) in a dedicated sub-panel, free from chart clutter.
Consensus Row (NEW!): A dedicated bottom row displays the overall consensus. It signals a strong institutional trend (Muted Green/Red) only when 4 out of 5 timeframes agree.
MACD Momentum Filter: An optional feature that detects divergence/weakness. If the primary ATR trend is Bullish, but the MACD Histogram is negative, the dot turns Yellow—warning of a potential reversal or pause.
Dot Plot Frequency Filter: Custom setting (plotFrequency) to reduce visual noise by only drawing dots every N bars, keeping the panel clean when zoomed out.
Companion Chart Markers (Separate Script): A companion script is available to plot visual markers directly onto the main price chart when a perfect 5/5 consensus is reached.
How to Use It:
Green Dot: Strong Bullish Trend on that specific timeframe.
Red Dot: Strong Bearish Trend on that specific timeframe.
Yellow Dot (If Filter Active): Trend is confirmed, but momentum is fading (MACD disagreement).
Consensus Row (Bottom): Use as a primary confirmation filter. Only trade in the direction indicated by the Consensus row's color.
Technical Note:
The core trend logic is a custom, recursive ATR-based mechanism (similar to SuperTrend) known for its stability and lag-free signal generation.
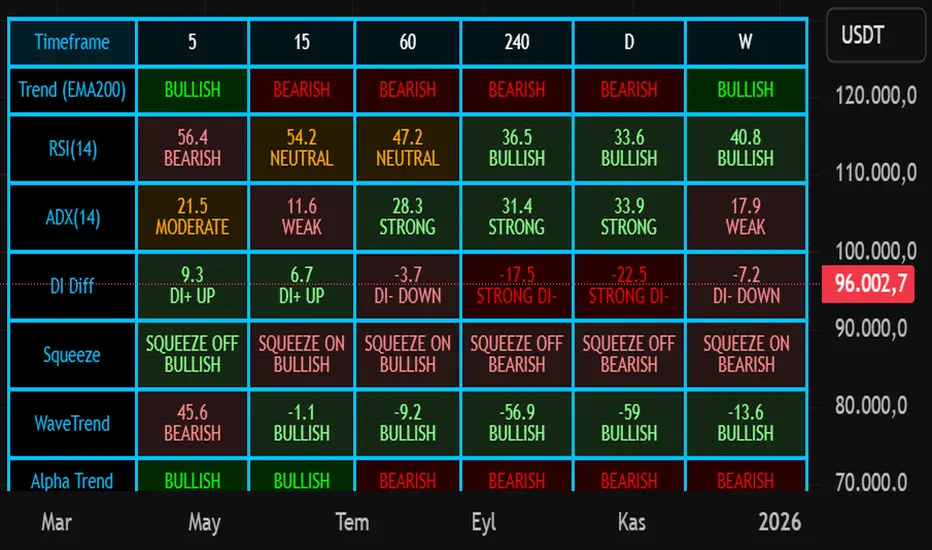
Nuh's Multi-Timeframe DashboardAll 10 indicators (EMA, RSI, ADX, RI, Squeezee, WaveTrend, Alpha Trend, SuperTrend, Stoch RSI, Vix Fix) across 7 time frames (5m, 15m, 1h, 2h, 4h, 1D, 1W) consolidated into a single table.
Triple Supertrend final indicatorit gives 3 super trends giving the trend and is very good indicator.can be used to be in trend and trail your profit and stoip losses

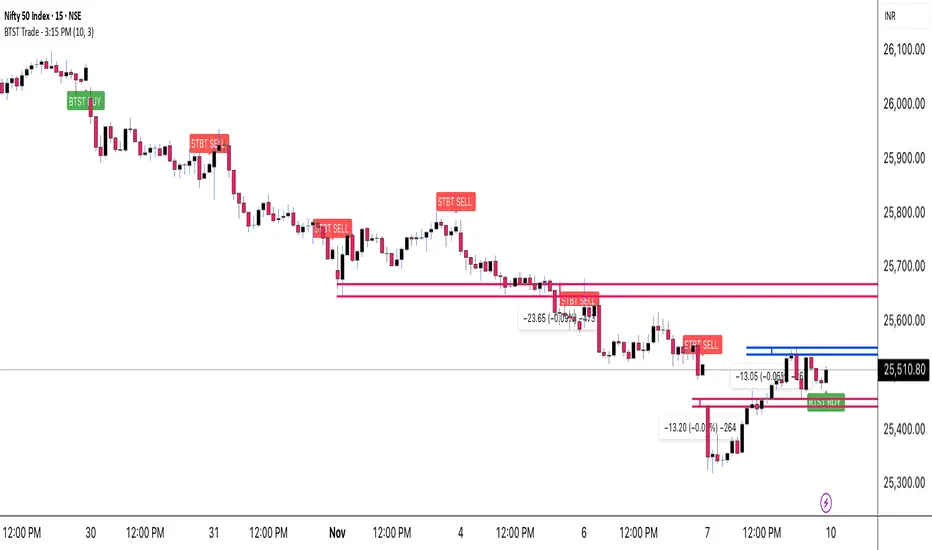
BTST Trade - 3:15 PMOverview
This indicator is specifically designed for BTST (Buy Today, Sell Tomorrow) traders who want a clear directional signal at 3:15 PM, just before the market closes.
It identifies the active market trend and instantly shows whether the market is positioned for a BTST BUY or BTST SELL setup.
Its goal is simple — help you take a data-based end-of-day decision rather than relying on guesswork or emotion.
Detects the current market trend throughout the day.
At exactly 3:15 PM, it checks that trend and prints one clear signal:
🟢 BTST BUY → Trend is bullish.
🔴 BTST SELL → Trend is bearish.
The signal appears as a label on the chart, making it easy to spot and understand.
Only one signal per day, ensuring clarity and discipline.
How to Use
Apply the indicator on an intraday timeframe (recommended 5-min or 15-min).
Make sure your chart’s exchange timezone is set correctly (for NSE / BSE, use India Standard Time).
Observe the signal generated at 3:15 PM:
If you get a green BUY label, plan a BTST long trade for the next session.
If you get a red SELL label, consider a short-side opportunity or avoid longs.
Use it together with your own price-action or volume confirmation before entering a trade.
Best Practices
Works best on liquid stocks/indices where volume is strong near close.
Combine with Supertrend, EMA, or RSI for additional confirmation.
Avoid using on higher timeframes like 1 hour or daily (no 3:15 bar there).
Designed mainly for BTST and short-term traders.
Disclaimer
This indicator is created for educational purposes only.
It is not financial advice, and no outcome is guaranteed.
Always use proper risk management and confirm signals with your own analysis before taking any trade.
Credits
Created by Virendra Pandey
A simple, time-based approach to identify the BTST & STBT opportunity at 3:15 PM.
ma+ko Arrowsma+ko ARROWS is a clean Supertrend-based indicator that generates precise BUY and SELL arrows without repainting after candle close.

Lynie's V9 SELL🟢🔴 Lynie’s V8 — BUY & SELL (Mirrored, Interlocking System)
Lynie’s V8 is a paired long/short engine built as two mirrored scripts—Lynie’s V8 BUY and Lynie’s V8 SELL—that read price the same way, flip conditions symmetrically, and manage trades with the exact logic on opposite sides. Use either one standalone or run both together for full two-sided automation of entries, re-entries, caution states, and adaptive SL/TP.
✳️ What “mirrored” means here
Supertrend Tri-Stack (10/11/12):
BUY: ST10 primary pierce; ST12 fallback; “PAG Buy” when price pierces any ST while above the other two.
SELL: Exact inverse—ST10 primary pierce down; ST12 fallback; “PAG Sell” when price pierces any ST while below the other two.
Re-Enter Clusters:
BUY: Ratcheted up (Heikin-Ashi green holds/tightens).
SELL: Ratcheted down (Heikin-Ashi red holds/tightens).
Both sides use the same cluster age/decay math, care penalties, session awareness, and fast-candle tightening.
Care Flags (context risk):
Ichimoku, MACD, RSI combine into single and paired flags that tighten or widen offsets on both sides with the same scoring.
VWAP–EMA50 (5m) cluster gate:
Identical distance checks for BUY/SELL. When the mean cluster is present, offsets and labels adapt (tighter/“riskier scalp” messaging).
Golden Pocket A/B/C (prev-day):
Same fib boxes & labeling (gold tone) on both sides to call out TP-friendly zones.
SL/TP Envelope:
Shared dynamic engine: per-bar decay, fast-candle expansion, and care-based compress/relax—all mirrored for up/down.
Caution Labels:
BUY side prints CAUTION SELL if HA flips red inside an active long cluster.
SELL side prints CAUTION BUY if HA flips green inside an active short cluster.
Same latching & auto-release behavior.
🧠 Core workflow (both sides)
Primary trigger via ST10 pierce (structure shift) with an ST12 fallback when ST10 didn’t qualify.
PAG Mode when price is already on the right side of the other two STs—strongest conviction.
Cluster phase begins after a signal: ratcheted re-entry level, session-aware offsets, dynamic tightening on fast bars.
Care system shapes every re-entry & SL/TP label (Ichi/MACD/RSI combos + VWAP/EMA gate + QQE).
Protective layer: SL-wick and SL-body logic, caution flips, and “hold 1 bar” cluster carry after SL to avoid whipsaw spam.
🔎 Labels & messages (shared vocabulary)
Lynie’s / Lynie’s+ / Lynie’s++ — strength tiers (ST12 involvement & clean context).
Re-Enter / Excellent Re-Enter — cluster pullback quality; ratchet shows the “must-hold” zone.
SL&TP (n) — live offset multiplier the engine is using right now.
CAUTION BUY / CAUTION SELL — HA flip against the active side inside the cluster.
Restart Next Candle — visual cue to re-arm after a confirmed signal bar.
⚡ Why run both together
Continuity: When a long cycle ends (SL or caution degradation), the SELL engine is already tracking the inverse without re-tuning.
Symmetry: Same math, same signals, opposite direction—no hidden biases.
Coverage: Trend hand-offs are cleaner; you don’t miss early shorts after a long fade (and vice versa).
🔧 Recommended usage
Intraday futures (ES/NQ) or any liquid market.
Keep the VWAP–EMA cluster ON; it filters FOMO chases.
Honor Caution flips inside cluster—scale down or wait for the next clean re-enter.
Treat Golden Zones as TP magnets, not guaranteed reversals.
📌 Notes
Both scripts are Pine v6 and independent. Load BUY and SELL together for the full experience.
All offsets (re-enter & SL/TP) are visible in labels—so you always know why a zone is where it is.
Alerts are provided for signals, re-enter hits, caution, and SL events on both sides.
Summary: Lynie’s V8 BUY & SELL are vice-versa twins—one framework, two directions—delivering consistent entries, adaptive re-entries, and contextual risk management whether the market is pressing up or breaking down.

Fib OscillatorWhat is Fib Oscillator and How to Use it?
🔶 1. Conceptual Overview
The Fib Oscillator is a Fibonacci-based relative position oscillator.
Instead of measuring momentum (like RSI or MACD), it measures where price currently sits between the recent swing high and swing low, expressed as a percentage within the Fibonacci range.
In other words:
It answers: “Where is price right now within its most recent dynamic range?”
It visualizes retracement and extension zones numerically, providing continuous feedback between 0% and 100% (and beyond if extended).
🔶 2. What the Script Does
The indicator:
Automatically detects recent high and low levels using an adaptive lookback window, which depends on ATR volatility.
Calculates the current price’s position between those levels as a percentage (0–100).
Plots that percentage as an oscillator — showing visually whether price is near the top, middle, or bottom of its recent range.
Overlays Fibonacci retracement levels (23.6%, 38.2%, 50%, 61.8%, 78.6%) as reference zones.
Generates alerts when the oscillator crosses key Fib thresholds — which can signal retracement completion, breakout potential, or pullback exhaustion.
🔶 3. Technical Flow Breakdown
(a) Inputs
Input Description Default Notes
atrLength ATR period used for volatility estimation 14 Used to dynamically tune lookback sensitivity
minLookback Minimum lookback window (candles) 20 Ensures stability even in low volatility
maxLookback Maximum lookback window 100 Limits over-expansion during high volatility
isInverse Inverts chart orientation false Useful for inverse markets (e.g. shorts or inverse BTC view)
(b) Volatility-Adaptive Lookback
Instead of using a fixed lookback, it calculates:
lookback
=
SMA(ATR,10)
/
SMA(Close,10)
×
500
lookback=SMA(ATR,10)/SMA(Close,10)×500
Then it clamps this between minLookback and maxLookback.
This makes the oscillator:
More reactive during high volatility (shorter lookback)
More stable during calm markets (longer lookback)
Essentially, it self-adjusts to market rhythm — you don’t have to constantly tweak lookback manually.
(c) High-Low Reference Points
It takes the highest and lowest points within the dynamic lookback window.
If isInverse = true, it flips the candle logic (useful if viewing inverse instruments like stablecoin pairs or when analyzing bearish setups invertedly).
(d) Oscillator Core
The main oscillator line:
osc
=
(
close
−
low
)
(
high
−
low
)
×
100
osc=
(high−low)
(close−low)
×100
0% = Price is at the lookback low.
100% = Price is at the lookback high.
50% = Midpoint (balanced).
Between Fibonacci percentages (23.6%, 38.2%, 61.8%, etc.), the oscillator indicates retracement stages.
(e) Fibonacci Levels as Reference
It overlays horizontal reference lines at:
0%, 23.6%, 38.2%, 50%, 61.8%, 78.6%, 100%
These act as support/resistance bands in oscillator space.
You can read it similar to how traders use Fibonacci retracements on charts, but compressed into a single line oscillator.
(f) Alerts
The script includes built-in alert conditions for crossovers at each major Fibonacci level.
You can set TradingView alerts such as:
“Oscillator crossed above 61.8%” → possible bullish continuation or breakout.
“Oscillator crossed below 38.2%” → possible pullback or correction starting.
This allows automated monitoring of fib retracement completions without manually drawing fib levels.
🔶 4. How to Use It
🔸 Visual Interpretation
Oscillator Value Zone Market Context
0–23.6% Deep Retracement Potential exhaustion of a down-move / early reversal
23.6–38.2% Shallow retracement zone Possible continuation phase
38.2–50% Mid retracement Neutral or indecisive structure
50–61.8% Key pivot region Common trend resumption zone
61.8–78.6% Late retracement Often “last pullback” area
78.6–100% Near high range Possible overextension / profit-taking
>100% Range breakout New leg formation / expansion
🔸 Practical Application Steps
Load the indicator on your chart (set overlay = false, so it’s below the main price chart).
Observe oscillator position relative to fib bands:
Use it to determine retracement depth.
Combine with structure tools:
Trend lines, swing points, or HTF market structure.
Use crossovers for timing:
Crossing above 61.8% in an uptrend often confirms breakout continuation.
Crossing below 38.2% in a downtrend signals renewed downside momentum.
For range markets, oscillator swings between 23.6% and 78.6% can define accumulation/distribution boundaries.
🔶 5. When to Use It
During Retracements: To gauge how deep the pullback has gone.
During Range Markets: To identify relative overbought/oversold positions.
Before Breakouts: Crossovers of 61.8% or 78.6% often precede impulsive moves.
In Multi-Timeframe Contexts:
LTF (15M–1H): Detect intraday retracement exhaustion.
HTF (4H–1D): Confirm major range expansions or key reversal zones.
🔶 6. Ideal Companion Indicators
The Fib Oscillator works best when contextualized with structure, volatility, and trend bias indicators.
Below are optimal pairings:
Companion Indicator Purpose Integration Insight
Market Structure MTF Tool Identify active trend direction Use Fib Oscillator only in trend direction for cleaner signals
EMA Ribbon / Supertrend Trend confirmation Align oscillator crossovers with EMA bias
ATR Bands / Volatility Envelope Validate breakout strength If oscillator >78.6% & ATR rising → valid breakout
Volume Oscillator Confirm retracement strength Volume contraction + oscillator under 38.2% → potential reversal
HTF Fib Retracement Tool Combine LTF oscillator with HTF fib confluence Powerful multi-timeframe setups
RSI or Stochastic Measure momentum relative to position RSI divergence while oscillator near 78.6% → exhaustion clue
🔶 7. Understanding the Settings
Setting Function Practical Impact
ATR Period (14) Controls volatility sampling Higher = smoother lookback adaptation
Min Lookback (20) Smallest window allowed Lower = more reactive but noisier
Max Lookback (100) Largest window allowed Higher = smoother but slower to react
Inverse Candle Chart Flips oscillator vertically Useful when analyzing bearish or inverse scenarios (e.g. short-side fib mapping)
Recommended Configs:
For scalping/intraday: ATR 10–14, lookback 20–50
For swing/position trading: ATR 14–21, lookback 50–100
🔶 8. Example Trade Logic (Practical Use)
Scenario: Uptrend on 4H chart
Oscillator drops to below 38.2% → retracement zone
Price consolidates → oscillator stabilizes
Oscillator crosses above 50% → pullback ending
Entry: Long when oscillator crosses above 61.8%
Exit: Near 78.6–100% zone or upon divergence with RSI
For Short Bias (Inverse Setup):
Enable isInverse = true to visually flip the oscillator (so lows become highs).
Use the same thresholds inversely.
🔶 9. Strengths & Limitations
✅ Strengths
Dynamic, self-adapting to volatility
Quantifies Fib retracement as a continuous function
Compact oscillator view (no clutter on chart)
Works well across all timeframes
Compatible with both trending and ranging markets
⚠️ Limitations
Doesn’t define trend direction — must be used with structure filters
Can whipsaw during choppy consolidations
The “lookback auto-adjust” may lag in sudden volatility shifts
Shouldn’t be used standalone for entries without structural confluence
🔶 10. Summary
The “Fib Oscillator” is a dynamic Fibonacci-relative positioning tool that merges retracement theory with adaptive volatility logic.
It gives traders an intuitive, quantified view of where price sits within its recent fib range, allowing anticipation of pullbacks, reversals, or breakout momentum.
Think of it as a "Fibonacci RSI", but instead of momentum strength, it shows positional depth — the vibrational location of price within its natural swing cycle.

Modern Combo Crypto SuiteBlends long and short playbooks in one overlay with quick toggles.
Tracks EMA stacks, SuperTrend, WaveTrend, QQE, and volume to score bias.
Colors the chart background when watch/ready conditions align.
Fires alerts for imminent or fully aligned long/short setups.
Displays a live checklist table summarizing trend, momentum, and volume confidence.

Hyper Strength Index | QuantLapse🧠 Hyper Strength Index (HSI) | QuantLapse
Overview:
The Hyper Strength Index (HSI) is a composite momentum oscillator designed to unify multiple strength measures into a single, adaptive framework. It combines the Relative Strength Index (RSI), Chande Momentum Oscillator (CMO), Money Flow Index (MFI), and Stochastic RSI to deliver a refined, multidimensional view of market momentum and overbought/oversold conditions.
Unlike traditional oscillators that rely on a single formula, the HSI averages four distinct momentum perspectives — price velocity, directional conviction, volume participation, and stochastic behavior — offering traders a more balanced and noise-resistant reading of market strength.
⚙️ Calculation Logic:
The Hyper Strength Index is computed as the normalized average of:
📈 RSI — classic measure of relative momentum.
💪 CMO — captures directional bias and intensity of moves.
💵 MFI — integrates volume and money flow pressure.
🔄 Stochastic RSI (K-line) — identifies momentum extremes and short-term turning points.
This fusion creates a smoother, more comprehensive signal, mitigating the weaknesses of any single oscillator.
🎯 Interpretation:
Overbought Zone (Default: > 75):
Indicates potential exhaustion of bullish momentum — a cooling phase or reversal may follow.
Oversold Zone (Default: < 7):
Suggests bearish exhaustion — a rebound or accumulation phase may emerge.
Neutral Zone (Between 7 and 75):
Represents balanced market conditions or trend continuation phases.
Visual cues highlight key conditions:
🔺 Red Highlights — Overbought regions or downward inflection points.
🔻 Green Highlights — Oversold regions or upward inflection points.
Neutral zones are shaded with subtle gray backgrounds for clarity.
💡 Key Features:
🔹 Multi-factor strength analysis (RSI + CMO + MFI + StochRSI).
🔹 Adaptive overbought/oversold detection.
🔹 Visual alerts via colored backgrounds and bar markers.
🔹 Customizable smoothing and length parameters for fine-tuning sensitivity.
🔹 Intuitive visualization ideal for both short-term scalping and swing trading setups.
🧭 Usage Notes:
Works best as a momentum confirmation tool — pair with trend filters like EMA, SuperTrend, or ADX.
In trending markets, use crossovers from extreme zones as potential continuation or exhaustion signals.
In ranging markets, exploit overbought/oversold reversals for high-probability mean reversion trades.
📘 Summary:
The Hyper Strength Index | QuantLapse distills multiple dimensions of market strength into a single, cohesive oscillator. By merging price, volume, and directional momentum, it provides traders with a more robust, responsive, and context-aware perspective on market dynamics — a next-generation evolution beyond the limitations of RSI or CMO alone.

ADOLFO'S NINJA TURTLE SOUPThis indicator signals when there is a turtle soup of m30 in the NY session following the trend of a supertrend indicator in a 1-hour time interval, being excellent for taking RR trades 1 to 1. Created by Engineer Adolfo Pérez Espinoza.

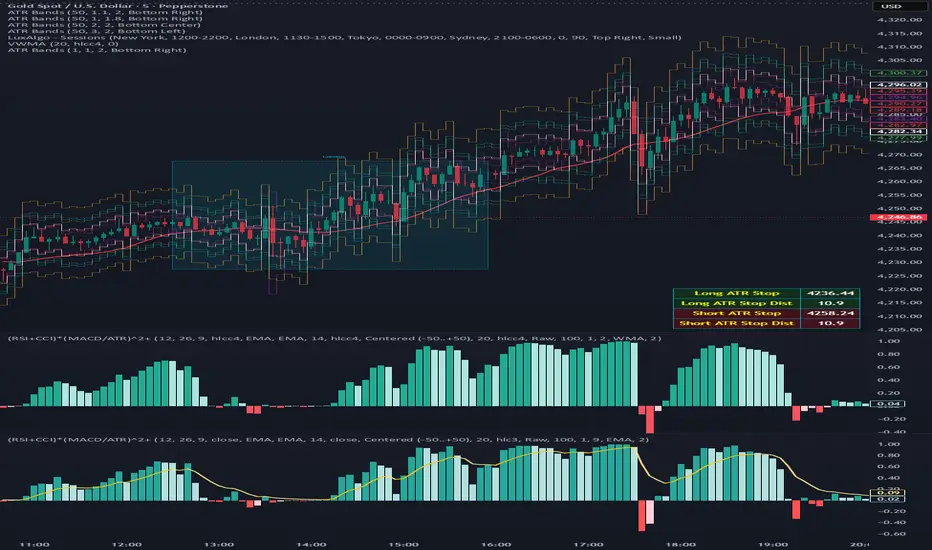
(RSI + CCI) × (MACD/ATR)^2⚙️ (RSI + CCI) × (MACD / ATR)² Composite — Normalized, Compressed, Dynamic Colors
This advanced composite oscillator merges three powerful momentum indicators — RSI, CCI, and MACD — into one normalized and volatility-adjusted signal that reacts smoothly across all markets.
By dividing MACD by ATR (Average True Range), the indicator self-scales for different symbols, and an optional tanh-like compression prevents extreme spikes while keeping the movement fluid and responsive.
🧩 Core Formula
(RSI + CCI) × (MACD / ATR)²
(optionally passed through a tanh compression for stability)
RSI and CCI are normalized (RSI ÷ 50, CCI ÷ 100) → roughly −2 to +2 range.
MACD is volatility-adjusted by ATR → scale-independent between assets.
The result is centered around 0 for clear bullish/bearish momentum comparison.
🎨 Visual Features
🟢🔴 Dynamic 4-Color Histogram
Positive + Rising = Strong Teal
Positive + Falling = Light Teal
Negative + Falling = Strong Red
Negative + Rising = Light Red
🟡⚫ 4-Color Smoothing Line
Positive & Rising = Bright Yellow
Positive & Falling = Soft Yellow
Negative & Rising = Grey
Negative & Falling = Dark Grey
Zero-centered layout for intuitive bullish/bearish visualization.
⚙️ Adjustable Parameters
Individual RSI, CCI, and MACD lengths and sources.
ATR length for volatility normalization.
Optional tanh-style compression with adjustable gain (to keep values in ±1 range).
Fully customizable colors and line widths for both bars and smoothing line.
🔔 Alerts
Triggered automatically when the composite crosses above or below zero, signaling potential trend reversals or momentum shifts.
💡 How to Use
Composite > 0 → Bullish momentum ↑
Composite < 0 → Bearish momentum ↓
A brightening line or bar = momentum accelerating.
A fading color = momentum weakening or reversal forming.
Combine with higher-timeframe trend filters (EMA, VWAP, Supertrend) for confirmation.
Bollinger RSI + SuperTrend TrailingBollinger Band RSI buy and sell signals with a super trend trailing stop

⚡ Elite Momentum Pro🎯 Key Features
1. Smart Signal Engine
3 Signal Modes: Aggressive, Balanced, Conservative
7-Point Scoring System - Ensures high-quality signals
Anti-Flip Protection - Prevents rapid signal changes
Multiple confirmations: Supertrend, MACD, RSI, EMA alignment, momentum
2. Advanced Risk Management
3 Take Profit Levels (TP1, TP2, TP3) for scaling out
ATR-Based Dynamic Stops - Adapts to volatility
Customizable Risk:Reward (default 2.5:1)
Visual stop and target levels
3. Clean Visual Design
Color-coded price bars based on trend strength
EMA Ribbon (9, 21, 50, 200) for trend clarity

Volume Cluster Heatmap [BackQuant]Volume Cluster Heatmap
A visualization tool that maps traded volume across price levels over a chosen lookback period. It highlights where the market builds balance through heavy participation and where it moves efficiently through low-volume zones. By combining a heatmap, volume profile, and high/low volume node detection, this indicator reveals structural areas of support, resistance, and liquidity that drive price behavior.
What Are Volume Clusters?
A volume cluster is a horizontal aggregation of traded volume at specific price levels, showing where market participants concentrated their buying and selling.
High Volume Nodes (HVN) : Price levels with significant trading activity; often act as support or resistance.
Low Volume Nodes (LVN) : Price levels with little trading activity; price moves quickly through these areas, reflecting low liquidity.
Volume clusters help identify key structural zones, reveal potential reversals, and gauge market efficiency by highlighting where the market is balanced versus areas of thin liquidity.
By creating heatmaps, profiles, and highlighting high and low volume nodes (HVNs and LVNs), it allows traders to see where the market builds balance and where it moves efficiently through thin liquidity zones.
Example: Bitcoin breaking away from the high-volume zone near 118k and moving cleanly through the low-volume pocket around 113k–115k, illustrating how markets seek efficiency:
Core Features
Visual Analysis Components:
Heatmap Display : Displays volume intensity as colored boxes, lines, or a combination for a dynamic view of market participation.
Volume Profile Overlay : Shows cumulative volume per price level along the right-hand side of the chart.
HVN & LVN Labels : Marks high and low volume nodes with color-coded lines and labels.
Customizable Colors & Transparency : Adjust high and low volume colors and minimum transparency for clear differentiation.
Session Reset & Timeframe Control : Dynamically resets clusters at the start of new sessions or chosen timeframes (intraday, daily, weekly).
Alerts
HVN / LVN Alerts : Notify when price reaches a significant high or low volume node.
High Volume Zone Alerts : Trigger when price enters the top X% of cumulative volume, signaling key areas of market interest.
How It Works
Each bar’s volume is distributed proportionally across the horizontal price levels it touches. Over the lookback period, this builds a cumulative volume profile, identifying price levels with the most and least trading activity. The highest cumulative volume levels become HVNs, while the lowest are LVNs. A side volume profile shows aggregated volume per level, and a heatmap overlay visually reinforces market structure.
Applications for Traders
Identify strong support and resistance at HVNs.
Detect areas of low liquidity where price may move quickly (LVNs).
Determine market balance zones where price may consolidate.
Filter noise: because volume clusters aggregate activity into levels, minor fluctuations and irrelevant micro-moves are removed, simplifying analysis and improving strategy development.
Combine with other indicators such as VWAP, Supertrend, or CVD for higher-probability entries and exits.
Use volume clusters to anticipate price reactions to breaking points in thin liquidity zones.
Advanced Display Options
Heatmap Styles : Boxes, lines, or both. Boxes provide a traditional heatmap, lines are better for high granularity data.
Line Mode Example : Simplified line visualization for easier reading at high level counts:
Profile Width & Offset : Adjust spacing and placement of the volume profile for clarity alongside price.
Transparency Control : Lower transparency for more opaque visualization of high-volume zones.
Best Practices for Usage
Reduce the number of levels when using line mode to avoid clutter.
Use HVN and LVN markers in conjunction with volume profiles to plan entries and exits.
Apply session resets to monitor intraday vs. multi-day volume accumulation.
Combine with other technical indicators to confirm high-probability trading signals.
Watch price interactions with LVNs for potential rapid movements and with HVNs for possible support/resistance or reversals.
Technical Notes
Each bar contributes volume proportionally to the price levels it spans, creating a dynamic and accurate representation of traded interest.
Volume profiles are scaled and offset for visual clarity alongside live price.
Alerts are fully integrated for HVN/LVN interaction and high-volume zone entries.
Optimized to handle large lookback windows and numerous price levels efficiently without performance degradation.
This indicator is ideal for understanding market structure, detecting key liquidity areas, and filtering out noise to model price more accurately in high-frequency or algorithmic strategies.

[ZP] Fixed v6 testDISCLAIMER:
This indicator in Pine V6 as my first ever Tradingview indicator, has been developed for my personal trading analysis, consolidating various powerful indicators that I frequently use. A number of the embedded indicators within this tool are the creations of esteemed Pine Script developers from the TradingView community. In recognition of their contributions, the names of these developers will be prominently displayed alongside the respective indicator names. My selection of these indicators is rooted in my own experience and reflects those that have proven most effective for me. Please note that the past performance of any trading system or methodology is not necessarily indicative of future results. Always conduct your own research and due diligence before using any indicator or tool.
===========================================================================
Introducing the ultimate all-in-one DIY strategy builder indicator, With over 30+ famous indicators (some with custom configuration/settings) indicators included, you now have the power to mix and match to create your own custom strategy for shorter time or longer time frames depending on your trading style. Say goodbye to cluttered charts and manual/visual confirmation of multiple indicators and hello to endless possibilities with this indicator.
Available indicators that you can choose to build your strategy, are coded to seamlessly print the BUY and SELL signal upon confirmation of all selected indicators:
EMA Filter
2 EMA Cross
3 EMA Cross
Range Filter (Guikroth)
SuperTrend
Ichimoku Cloud
SuperIchi (LuxAlgo)
B-Xtrender (QuantTherapy)
Bull Bear Power Trend (Dreadblitz)
VWAP
BB Oscillator (Veryfid)
Trend Meter (Lij_MC)
Chandelier Exit (Everget)
CCI
Awesome Oscillator
DMI ( Adx )
Parabolic SAR
Waddah Attar Explosion (Shayankm)
Volatility Oscillator (Veryfid)
Damiani Volatility ( DV ) (RichardoSantos)
Stochastic
RSI
MACD
SSL Channel (ErwinBeckers)
Schaff Trend Cycle ( STC ) (LazyBear)
Chaikin Money Flow
Volume
Wolfpack Id (Darrellfischer1)
QQE Mod (Mihkhel00)
Hull Suite (Insilico)
Vortex Indicator

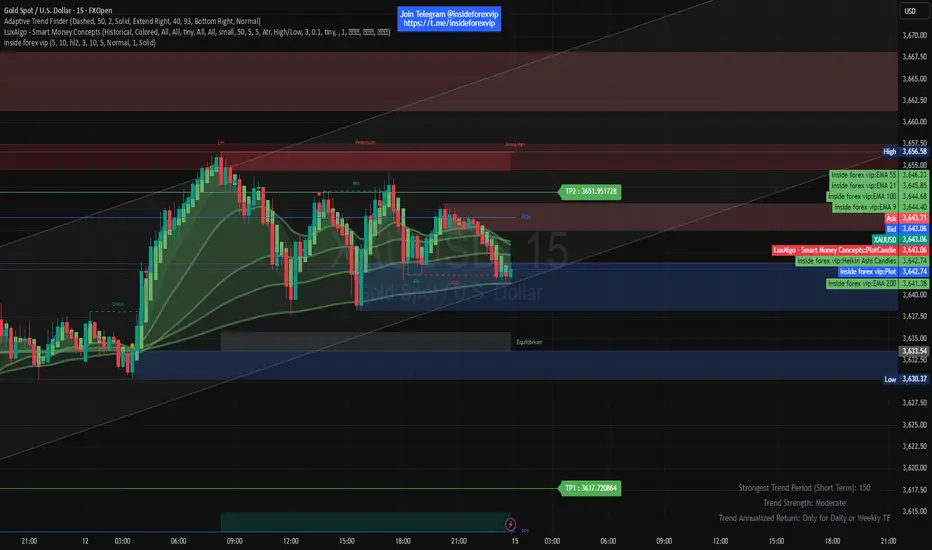
inside forex vip📌 SuperTrend
Based on:
ATR Period (default 10).
Multiplier ATR (default 3).
Calculates the trend direction (upward/downward).
Generates buy/sell signals:
Buy: Positive crossover with EMA color matching (bullish).
Sell: Negative crossover with EMA color matching (bearish).
Multi-Strategy Trading Screener SummaryI only combined famous scripts, all thanks to wonderful scripts and community out there .
ThankYou !
------
Core Architecture
Multi-Symbol Analysis: Tracks up to 5 configurable tickers simultaneously
Multi-Timeframe Support: Each symbol can use different timeframes
Real-Time Dashboard: Color-coded table displaying all signals and analysis
Trend Validation: All signals include trend alignment confirmation
Integrated Trading Strategies
1. Breaker Blocks (Order Blocks)
Detects institutional order blocks using swing analysis
Tracks when blocks are broken and become "breaker blocks"
Monitors retests of broken levels
Shows trend alignment (✓ aligned, ⚠️ misaligned)
2. Chandelier Exit
ATR-based trend-following exit system
Provides BUY/SELL signals based on dynamic stop levels
Uses configurable ATR multiplier and lookback period
3. Smart Money Breakout
Channel breakout detection with volatility normalization
Identifies accumulation/distribution phases
Generates persistent BUY/SELL signals on breakouts
4. Trendline Breakout
Dynamic trendline detection using pivot highs/lows
Calculates trendline slopes and breakout points
Provides BUY signals on upward breaks, SELL on downward breaks
Dashboard Columns Explained
Symbol: Ticker being analyzed
Trend: Overall SuperTrend direction (🟢 UP / 🔴 DOWN / ⚪ FLAT)
Timeframe: Analysis timeframe with clock icon
Breaker Block: Type (Bullish/Bearish) with trend alignment indicator
Status: Price position relative to breaker block (Inside/Approaching/Far)
Retests: Number of times the broken level was retested (indicates level strength)
Volume: Volume associated with the order block formation
Chandelier: BUY/SELL signals from Chandelier Exit strategy
Smart Money: BUY/SELL signals from breakout detection
Trendline: BUY/SELL signals from trendline breakouts
Key Features
No HOLD States: All signals show definitive BUY (🟢) or SELL (🔴) only
Persistent Signals: Signals remain active until opposite conditions trigger
Color Coding: Visual distinction between bullish (green) and bearish (red) signals
Trend Alignment: Enhanced accuracy through trend confirmation logic
This screener provides a comprehensive view of market conditions across multiple strategies, helping identify high-probability trading opportunities when signals align.

Volume Profile AnalysisThe Volume Profile Dashboard is a professional-grade analysis tool built for TradingView. It focuses on displaying a comprehensive volume profile breakdown within a dashboard format directly on the chart. The purpose of this tool is to help traders quickly assess buy versus sell volume dynamics, momentum, and sentiment in order to support informed trading decisions.
Instead of plotting simple bars, this indicator uses a detailed table and visual progress bar to summarize live and historical market activity. By condensing key metrics into a structured format, traders can analyse market behaviour without manually calculating or switching between multiple indicators.
________________________________________
How the Script Works
1. Data Gathering
The script uses lower-timeframe price and volume data to calculate buy volume, sell volume, and total traded volume for the current and previous candles.
2. Volume Allocation
Buy and sell volumes are estimated by looking at the candle’s range (high to low) and how the closing price aligns within that range. The closer the close is to the high, the stronger the buying pressure. The closer the close is to the low, the stronger the selling pressure.
3. Delta and Momentum
o Delta measures the difference between buy and sell volume.
o Volume momentum compares the current candle’s activity to the previous one, showing if interest is rising or fading.
4. Point of Control (POC)
An average of high, low, and close is calculated to give an approximate “point of control” level—an area of balance where buyers and sellers previously agreed on price.
5. Dashboard Visualization
All these calculations are displayed inside a clean dashboard table with separate rows for the current candle, previous candle, and a summary row. Icons, colors, and progress bars make it visually intuitive.
6. On-Chart Progress Indicator
A dynamic horizontal progress bar is plotted on the chart above price, showing the balance between buy and sell volume for the latest activity.
7. Alerts
Built-in alerts trigger when strong buying or selling pressure is detected or when there is a significant spike in total traded volume.
________________________________________
How This Tool Can Be Used
• Intraday Trading: Quickly gauge whether buyers or sellers are in control of the market at any moment.
• Swing Trading: Compare momentum shifts between candles to identify early trend reversals.
• Risk Management: Use delta and sentiment signals to confirm whether to hold or reduce exposure.
• Confirmation: Align the volume profile dashboard with other indicators (such as RSI, MACD, or trendlines) for stronger trading conviction.
________________________________________
Using Mixed Indicators for Decisions
This dashboard alone provides volume insights, but better decisions come when it is combined with other tools:
• Pairing it with an RSI can show whether heavy buying is happening in overbought conditions.
• Combining with a SuperTrend or moving averages can confirm if volume momentum aligns with the price trend.
• Overlaying support/resistance levels can identify whether strong buy/sell signals occur at critical levels.
Mixed indicators prevent relying on one signal alone, reducing false trades.
________________________________________
Importance of This Tool
• Clarity: Condenses complex volume data into a simple, visual format.
• Speed: Traders can react faster with pre-calculated buy/sell percentages.
• Precision: Highlights hidden imbalances that are not obvious from candles alone.
• Professional-grade dashboard: Offers an institutional-style view of market behavior directly within TradingView.
________________________________________
Parameters in the Dashboard Table
• Period: Shows whether the row is for the current or previous candle, along with trend arrows.
• Price Range: The high–low range of the candle.
• Total Volume: The sum of buy and sell activity.
• Buy Volume / Sell Volume: Separated distribution of transactions leaning bullish or bearish.
• Delta: The net difference between buy and sell volumes, highlighting pressure imbalance.
• Buy % / Sell %: The percentage contribution of each side to total volume.
• POC: An average reference level where market consensus was strongest.
• Progress: A graphical bar showing buy vs sell dominance.
• Signal: Simplified output like Strong Buy, Buy, Strong Sell, Sell, Neutral.
• Summary Row: Compares changes between the current and previous candles and gives overall market sentiment.
________________________________________
Stock Market Disclaimer
This tool is for educational and informational purposes only. It does not constitute financial advice, investment advice, or trading recommendations. The stock market and cryptocurrency markets involve high risk. Traders and investors should do their own research and consult licensed financial advisors before making investment decisions. Past performance is not indicative of future results.
________________________________________
Misuse Disclaimer
This script has been developed as per TradingView’s rules and is intended for responsible trading analysis only. Any misuse, redistribution, or modification outside of TradingView’s policies is discouraged. The author and platform are not responsible for financial losses, misinterpretation of signals, or misuse of the code.
________________________________________
Disclaimer
Training & Educational Only — This material and the indicator are provided for educational purposes only. Nothing here is investment advice or a solicitation to buy or sell financial instruments. Past simulated or historical performance does not predict future results. Always perform full back testing and risk management, and consider seeking advice from a qualified financial professional before trading with real capital.
________________________________________

Double Median ATR Bands | MisinkoMasterThe Double Median ATR Bands is a version of the SuperTrend that is designed to be smoother, more accurate while maintaining a good speed by combining the HMA smoothing technique and the median source.
How does it work?
Very simple!
1. Get user defined inputs:
=> Set them up however you want, for the result you want!
2. Calculate the Median of the source and the ATR
=> Very simple
3. Smooth the median with √length (for example if median length = 9, it would be smoothed over the length of 3 since 3x3 = 9)
4. Add ATR bands like so:
Upper = median + (atr*multiplier)
Lower = median - (atr*multiplier)
Trend Logic:
Source crossing over the upper band = uptrend
Source crossing below the lower band = downtrend
Enjoy G´s!

Market Spiralyst [Hapharmonic]Hello, traders and creators! 👋
Market Spiralyst: Let's change the way we look at analysis, shall we? I've got to admit, I scratched my head on this for weeks, Haha :). What you're seeing is an exploration of what's possible when code meets art on financial charts. I wanted to try blending art with trading, to do something new and break away from the same old boring perspectives. The goal was to create a visual experience that's not just analytical, but also relaxing and aesthetically pleasing.
This work is intended as a guide and a design example for all developers, born from the spirit of learning and a deep love for understanding the Pine Script™ language. I hope it inspires you as much as it challenged me!
🧐 Core Concept: How It Works
Spiralyst is built on two distinct but interconnected engines:
The Generative Art Engine: At its core, this indicator uses a wide range of mathematical formulas—from simple polygons to exotic curves like Torus Knots and Spirographs—to draw beautiful, intricate shapes directly onto your chart. This provides a unique and dynamic visual backdrop for your analysis.
The Market Pulse Engine: This is where analysis meets art. The engine takes real-time data from standard technical indicators (RSI and MACD in this version) and translates their states into a simple, powerful "Pulse Score." This score directly influences the appearance of the "Scatter Points" orbiting the main shape, turning the entire artwork into a living, breathing representation of market momentum.
🎨 Unleash Your Creativity! This Is Your Playground
We've included 25 preset shapes for you... but that's just the starting point !
The real magic happens when you start tweaking the settings yourself. A tiny adjustment can make a familiar shape come alive and transform in ways you never expected.
I'm genuinely excited to see what your imagination can conjure up! If you create a shape you're particularly proud of or one that looks completely unique, I would love to see it. Please feel free to share a screenshot in the comments below. I can't wait to see what you discover! :)
Here's the default shape to get you started:
The Dynamic Scatter Points: Reading the Pulse
This is where the magic happens! The small points scattered around the main shape are not just decorative; they are the visual representation of the Market Pulse Score.
The points have two forms:
A small asterisk (`*`): Represents a low or neutral market pulse.
A larger, more prominent circle (`o`): Represents a high, strong market pulse.
Here’s how to read them:
The indicator calculates the Pulse Strength as a percentage (from 0% to 100%) based on the total score from the active indicators (RSI and MACD). This percentage determines the ratio of circles to asterisks.
High Pulse Strength (e.g., 80-100%): Most of the scatter points will transform into large circles (`o`). This indicates that the underlying momentum is strong and It could be an uptrend. It's a visual cue that the market is gaining strength and might be worth paying closer attention to.
Low Pulse Strength (e.g., 0-20%): Most or all of the scatter points will remain as small asterisks (`*`). This suggests weak, neutral, or bearish momentum.
The key takeaway: The more circles you see, the stronger the bullish momentum is according to the active indicators. Watch the artwork "breathe" as the circles appear and disappear with the market's rhythm!
And don't worry about the shape you choose; the scatter points will intelligently adapt and always follow the outer boundary of whatever beautiful form you've selected.
How to Use
Getting started with Spiralyst is simple:
Choose Your Canvas: Start by going into the settings and picking a `Shape` and `Palette` from the "Shape Selection & Palette" group that you find visually appealing. This is your canvas.
Tune Your Engine: Go to the "Market Pulse Engine" settings. Here, you can enable or disable the RSI and MACD scoring engines. Want to see the pulse based only on RSI? Just uncheck the MACD box. You can also fine-tune the parameters for each indicator to match your trading style.
Read the Vibe: Observe the scatter points. Are they mostly small asterisks or are they transforming into large, vibrant circles? Use this visual feedback as a high-level gauge of market momentum.
Check the Dashboard: For a precise breakdown, look at the "Market Pulse Analysis" table on the top-right. It gives you the exact values, scores, and total strength percentage.
Explore & Experiment: Play with the different shapes and color palettes! The core analysis remains the same, but the visual experience can be completely different.
⚙️ Settings & Customization
Spiralyst is designed to be highly customizable.
Shape Selection & Palette: This is your main control panel. Choose from over 25 unique shapes, select a color palette, and adjust the line extension style ( `extend` ) or horizontal position ( `offsetXInput` ).
scatterLabelsInput: This setting controls the total number of points (both asterisks and circles) that orbit the main shape. Think of it as adjusting the density or visual granularity of the market pulse feedback.
The Market Pulse engine will always calculate its strength as a percentage (e.g., 75%). This percentage is then applied to the `scatterLabelsInput` number you've set to determine how many points transform into large circles.
Example: If the Pulse Strength is 75% and you set this to `100` , approximately 75 points will become circles. If you increase it to `200` , approximately 150 points will transform.
A higher number provides a more detailed, high-resolution view of the market pulse, while a lower number offers a cleaner, more minimalist look. Feel free to adjust this to your personal visual preference; the underlying analytical percentage remains the same.
Market Pulse Engine:
`⚙️ RSI Settings` & `⚙️ MACD Settings`: Each indicator has its own group.
Enable Scoring: Use the checkbox at the top of each group to include or exclude that indicator from the Pulse Score calculation. If you only want to use RSI, simply uncheck "Enable MACD Scoring."
Parameters: All standard parameters (Length, Source, Fast/Slow/Signal) are fully adjustable.
Individual Shape Parameters (01-25): Each of the 25+ shapes has its own dedicated group of settings, allowing you to fine-tune every aspect of its geometry, from the number of petals on a flower to the windings of a knot. Feel free to experiment!
For Developers & Pine Script™ Enthusiasts
If you are a developer and wish to add more indicators (e.g., Stochastic, CCI, ADX), you can easily do so by following the modular structure of the code. You would primarily need to:
Add a new `PulseIndicator` object for your new indicator in the `f_getMarketPulse()` function.
Add the logic for its scoring inside the `calculateScore()` method.
The `calculateTotals()` method and the dashboard table are designed to be dynamic and will automatically adapt to include your new indicator!
One of the core design philosophies behind Spiralyst is modularity and scalability . The Market Pulse engine was intentionally built using User-Defined Types (UDTs) and an array-based structure so that adding new indicators is incredibly simple and doesn't require rewriting the main logic.
If you want to add a new indicator to the scoring engine—let's use the Stochastic Oscillator as a detailed example—you only need to modify three small sections of the code. The rest of the script, including the adaptive dashboard, will update automatically.
Here’s your step-by-step guide:
#### Step 1: Add the User Inputs
First, you need to give users control over your new indicator. Find the `USER INTERFACE: INPUTS` section and add a new group for the Stochastic settings, right after the MACD group.
Create a new group name: `string GRP_STOCH = "⚙️ Stochastic Settings"`
Add the inputs: Create a boolean to enable/disable it, and then add the necessary parameters (`%K`, `%D`, `Smooth`). Use the `active` parameter to link them to the enable/disable checkbox.
// Add this code block right after the GRP_MACD and MACD inputs
string GRP_STOCH = "⚙️ Stochastic Settings"
bool stochEnabledInput = input.bool(true, "Enable Stochastic Scoring", group = GRP_STOCH)
int stochKInput = input.int(14, "%K Length", minval=1, group = GRP_STOCH, active = stochEnabledInput)
int stochDInput = input.int(3, "%D Smoothing", minval=1, group = GRP_STOCH, active = stochEnabledInput)
int stochSmoothInput = input.int(3, "Smooth", minval=1, group = GRP_STOCH, active = stochEnabledInput)
#### Step 2: Integrate into the Pulse Engine (The "Factory")
Next, go to the `f_getMarketPulse()` function. This function acts as a "factory" that builds and configures the entire market pulse object. You need to teach it how to build your new Stochastic indicator.
Update the function signature: Add the new `stochEnabledInput` boolean as a parameter.
Calculate the indicator: Add the `ta.stoch()` calculation.
Create a `PulseIndicator` object: Create a new object for the Stochastic, populating it with its name, parameters, calculated value, and whether it's enabled.
Add it to the array: Simply add your new `stochPulse` object to the `array.from()` list.
Here is the complete, updated `f_getMarketPulse()` function :
// Factory function to create and calculate the entire MarketPulse object.
f_getMarketPulse(bool rsiEnabled, bool macdEnabled, bool stochEnabled) =>
// 1. Calculate indicator values
float rsiVal = ta.rsi(rsiSourceInput, rsiLengthInput)
= ta.macd(close, macdFastInput, macdSlowInput, macdSignalInput)
float stochVal = ta.sma(ta.stoch(close, high, low, stochKInput), stochDInput) // We'll use the main line for scoring
// 2. Create individual PulseIndicator objects
PulseIndicator rsiPulse = PulseIndicator.new("RSI", str.tostring(rsiLengthInput), rsiVal, na, 0, rsiEnabled)
PulseIndicator macdPulse = PulseIndicator.new("MACD", str.format("{0},{1},{2}", macdFastInput, macdSlowInput, macdSignalInput), macdVal, signalVal, 0, macdEnabled)
PulseIndicator stochPulse = PulseIndicator.new("Stoch", str.format("{0},{1},{2}", stochKInput, stochDInput, stochSmoothInput), stochVal, na, 0, stochEnabled)
// 3. Calculate score for each
rsiPulse.calculateScore()
macdPulse.calculateScore()
stochPulse.calculateScore()
// 4. Add the new indicator to the array
array indicatorArray = array.from(rsiPulse, macdPulse, stochPulse)
MarketPulse pulse = MarketPulse.new(indicatorArray, 0, 0.0)
// 5. Calculate final totals
pulse.calculateTotals()
pulse
// Finally, update the function call in the main orchestration section:
MarketPulse marketPulse = f_getMarketPulse(rsiEnabledInput, macdEnabledInput, stochEnabledInput)
#### Step 3: Define the Scoring Logic
Now, you need to define how the Stochastic contributes to the score. Go to the `calculateScore()` method and add a new case to the `switch` statement for your indicator.
Here's a sample scoring logic for the Stochastic, which gives a strong bullish score in oversold conditions and a strong bearish score in overbought conditions.
Here is the complete, updated `calculateScore()` method :
// Method to calculate the score for this specific indicator.
method calculateScore(PulseIndicator this) =>
if not this.isEnabled
this.score := 0
else
this.score := switch this.name
"RSI" => this.value > 65 ? 2 : this.value > 50 ? 1 : this.value < 35 ? -2 : this.value < 50 ? -1 : 0
"MACD" => this.value > this.signalValue and this.value > 0 ? 2 : this.value > this.signalValue ? 1 : this.value < this.signalValue and this.value < 0 ? -2 : this.value < this.signalValue ? -1 : 0
"Stoch" => this.value > 80 ? -2 : this.value > 50 ? 1 : this.value < 20 ? 2 : this.value < 50 ? -1 : 0
=> 0
this
#### That's It!
You're done. You do not need to modify the dashboard table or the total score calculation.
Because the `MarketPulse` object holds its indicators in an array , the rest of the script is designed to be adaptive:
The `calculateTotals()` method automatically loops through every indicator in the array to sum the scores and calculate the final percentage.
The dashboard code loops through the `enabledIndicators` array to draw the table. Since your new Stochastic indicator is now part of that array, it will appear automatically when enabled!
---
Remember, this is your playground! I'm genuinely excited to see the unique shapes you discover. If you create something you're proud of, feel free to share it in the comments below.
Happy analyzing, and may your charts be both insightful and beautiful! 💛