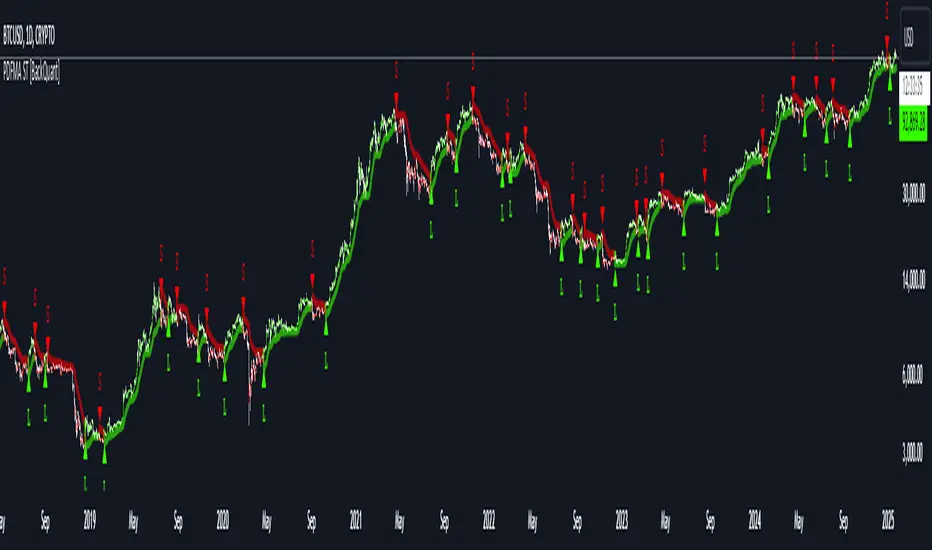
BBTrend w SuperTrend decision - Strategy [presentTrading]This strategy aims to improve upon the performance of Traidngview's newly published "BB Trend" indicator by incorporating the SuperTrend for better trade execution and risk management. Enjoy :)
█Introduction and How it is Different
The "BBTrend w SuperTrend decision - Strategy " is a trading strategy designed to identify market trends using Bollinger Bands and SuperTrend indicators. What sets this strategy apart is its use of two Bollinger Bands with different lengths to capture both short-term and long-term market trends, providing a more comprehensive view of market dynamics. Additionally, the strategy includes customizable take profit (TP) and stop loss (SL) settings, allowing traders to tailor their risk management according to their preferences.
BTCUSD 4h Long Performance
█ Strategy, How It Works: Detailed Explanation
The BBTrend strategy employs two key indicators: Bollinger Bands and SuperTrend.
🔶 Bollinger Bands Calculation:
- Short Bollinger Bands**: Calculated using a shorter period (default 20).
- Long Bollinger Bands**: Calculated using a longer period (default 50).
- Bollinger Bands use the standard deviation of price data to create upper and lower bands around a moving average.
Upper Band = Middle Band + (k * Standard Deviation)
Lower Band = Middle Band - (k * Standard Deviation)
🔶 BBTrend Indicator:
- The BBTrend indicator is derived from the absolute differences between the short and long Bollinger Bands' lower and upper values.
BBTrend = (|Short Lower - Long Lower| - |Short Upper - Long Upper|) / Short Middle * 100
🔶 SuperTrend Indicator:
- The SuperTrend indicator is calculated using the average true range (ATR) and a multiplier. It helps identify the market trend direction by plotting levels above and below the price, which act as dynamic support and resistance levels. * @EliCobra makes the SuperTrend Toolkit. He is GOAT.
SuperTrend Upper = HL2 + (Factor * ATR)
SuperTrend Lower = HL2 - (Factor * ATR)
The strategy determines market trends by checking if the close price is above or below the SuperTrend values:
- Uptrend: Close price is above the SuperTrend lower band.
- Downtrend: Close price is below the SuperTrend upper band.
Short: 10 Long: 20 std 2
Short: 20 Long: 40 std 2
Short: 20 Long: 40 std 4
█ Trade Direction
The strategy allows traders to choose their trading direction:
- Long: Enter long positions only.
- Short: Enter short positions only.
- Both: Enter both long and short positions based on market conditions.
█ Usage
To use the "BBTrend - Strategy " effectively:
1. Configure Inputs: Adjust the Bollinger Bands lengths, standard deviation multiplier, and SuperTrend settings.
2. Set TPSL Conditions: Choose the take profit and stop loss percentages to manage risk.
3. Choose Trade Direction: Decide whether to trade long, short, or both directions.
4. Apply Strategy: Apply the strategy to your chart and monitor the signals for potential trades.
█ Default Settings
The default settings are designed to provide a balance between sensitivity and stability:
- Short BB Length (20): Captures short-term market trends.
- Long BB Length (50): Captures long-term market trends.
- StdDev (2.0): Determines the width of the Bollinger Bands.
- SuperTrend Length (10): Period for calculating the ATR.
- SuperTrend Factor (12): Multiplier for the ATR to adjust the SuperTrend sensitivity.
- Take Profit (30%): Sets the level at which profits are taken.
- Stop Loss (20%): Sets the level at which losses are cut to manage risk.
Effect on Performance
- Short BB Length: A shorter length makes the strategy more responsive to recent price changes but can generate more false signals.
- Long BB Length: A longer length provides smoother trend signals but may be slower to react to price changes.
- StdDev: Higher values create wider bands, reducing the frequency of signals but increasing their reliability.
- SuperTrend Length and Factor: Shorter lengths and higher factors make the SuperTrend more sensitive, providing quicker signals but potentially more noise.
- Take Profit and Stop Loss: Adjusting these levels affects the risk-reward ratio. Higher take profit percentages can increase gains but may result in fewer closed trades, while higher stop loss percentages can decrease the likelihood of being stopped out but increase potential losses.
Cari dalam skrip untuk "supertrend"
AI SuperTrend x Pivot Percentile - Strategy [PresentTrading]█ Introduction and How it is Different
The AI SuperTrend x Pivot Percentile strategy is a sophisticated trading approach that integrates AI-driven analysis with traditional technical indicators. Combining the AI SuperTrend with the Pivot Percentile strategy highlights several key advantages:
1. Enhanced Accuracy in Trend Prediction: The AI SuperTrend utilizes K-Nearest Neighbors (KNN) algorithm for trend prediction, improving accuracy by considering historical data patterns. This is complemented by the Pivot Percentile analysis which provides additional context on trend strength.
2. Comprehensive Market Analysis: The integration offers a multi-faceted approach to market analysis, combining AI insights with traditional technical indicators. This dual approach captures a broader range of market dynamics.
BTC 6H L/S Performance
Local
█ Strategy: How it Works - Detailed Explanation
🔶 AI-Enhanced SuperTrend Indicators
1. SuperTrend Calculation:
- The SuperTrend indicator is calculated using a moving average and the Average True Range (ATR). The basic formula is:
- Upper Band = Moving Average + (Multiplier × ATR)
- Lower Band = Moving Average - (Multiplier × ATR)
- The moving average type (SMA, EMA, WMA, RMA, VWMA) and the length of the moving average and ATR are adjustable parameters.
- The direction of the trend is determined based on the position of the closing price in relation to these bands.
2. AI Integration with K-Nearest Neighbors (KNN):
- The KNN algorithm is applied to predict trend direction. It uses historical price data and SuperTrend values to classify the current trend as bullish or bearish.
- The algorithm calculates the 'distance' between the current data point and historical points. The 'k' nearest data points (neighbors) are identified based on this distance.
- A weighted average of these neighbors' trends (bullish or bearish) is calculated to predict the current trend.
For more please check: Multi-TF AI SuperTrend with ADX - Strategy
🔶 Pivot Percentile Analysis
1. Percentile Calculation:
- This involves calculating the percentile ranks for high and low prices over a set of predefined lengths.
- The percentile function is typically defined as:
- Percentile = Value at (P/100) × (N + 1)th position
- Where P is the desired percentile, and N is the number of data points.
2. Trend Strength Evaluation:
- The calculated percentiles for highs and lows are used to determine the strength of bullish and bearish trends.
- For instance, a high percentile rank in the high prices may indicate a strong bullish trend, and vice versa for bearish trends.
For more please check: Pivot Percentile Trend - Strategy
🔶 Strategy Integration
1. Combining SuperTrend and Pivot Percentile:
- The strategy synthesizes the insights from both AI-enhanced SuperTrend and Pivot Percentile analysis.
- It compares the trend direction indicated by the SuperTrend with the strength of the trend as suggested by the Pivot Percentile analysis.
2. Signal Generation:
- A trading signal is generated when both the AI-enhanced SuperTrend and the Pivot Percentile analysis agree on the trend direction.
- For instance, a bullish signal is generated when both the SuperTrend is bullish, and the Pivot Percentile analysis shows strength in bullish trends.
🔶 Risk Management and Filters
- ADX and DMI Filter: The strategy uses the Average Directional Index (ADX) and the Directional Movement Index (DMI) as filters to assess the trend's strength and direction.
- Dynamic Trailing Stop Loss: Based on the SuperTrend indicator, the strategy dynamically adjusts stop-loss levels to manage risk effectively.
This strategy stands out for its ability to combine real-time AI analysis with established technical indicators, offering traders a nuanced and responsive tool for navigating complex market conditions. The equations and algorithms involved are pivotal in accurately identifying market trends and potential trade opportunities.
█ Usage
To effectively use this strategy, traders should:
1. Understand the AI and Pivot Percentile Indicators: A clear grasp of how these indicators work will enable traders to make informed decisions.
2. Interpret the Signals Accurately: The strategy provides bullish, bearish, and neutral signals. Traders should align these signals with their market analysis and trading goals.
3. Monitor Market Conditions: Given that this strategy is sensitive to market dynamics, continuous monitoring is crucial for timely decision-making.
4. Adjust Settings as Needed: Traders should feel free to tweak the input parameters to suit their trading preferences and to respond to changing market conditions.
█Default Settings and Their Impact on Performance
1. Trading Direction (Default: "Both")
Effect: Determines whether the strategy will take long positions, short positions, or both. Adjusting this setting can align the strategy with the trader's market outlook or risk preference.
2. AI Settings (Neighbors: 3, Data Points: 24)
Neighbors: The number of nearest neighbors in the KNN algorithm. A higher number might smooth out noise but could miss subtle, recent changes. A lower number makes the model more sensitive to recent data but may increase noise.
Data Points: Defines the amount of historical data considered. More data points provide a broader context but may dilute recent trends' impact.
3. SuperTrend Settings (Length: 10, Factor: 3.0, MA Source: "WMA")
Length: Affects the sensitivity of the SuperTrend indicator. A longer length results in a smoother, less sensitive indicator, ideal for long-term trends.
Factor: Determines the bandwidth of the SuperTrend. A higher factor creates wider bands, capturing larger price movements but potentially missing short-term signals.
MA Source: The type of moving average used (e.g., WMA - Weighted Moving Average). Different MA types can affect the trend indicator's responsiveness and smoothness.
4. AI Trend Prediction Settings (Price Trend: 10, Prediction Trend: 80)
Price Trend and Prediction Trend Lengths: These settings define the lengths of weighted moving averages for price and SuperTrend, impacting the responsiveness and smoothness of the AI's trend predictions.
5. Pivot Percentile Settings (Length: 10)
Length: Influences the calculation of pivot percentiles. A shorter length makes the percentile more responsive to recent price changes, while a longer length offers a broader view of price trends.
6. ADX and DMI Settings (ADX Length: 14, Time Frame: 'D')
ADX Length: Defines the period for the Average Directional Index calculation. A longer period results in a smoother ADX line.
Time Frame: Sets the time frame for the ADX and DMI calculations, affecting the sensitivity to market changes.
7. Commission, Slippage, and Initial Capital
These settings relate to transaction costs and initial investment, directly impacting net profitability and strategy feasibility.
Vegas SuperTrend Enhanced - Strategy [presentTrading]█ Introduction and How it is Different
The "Vegas SuperTrend Enhanced - Strategy " trading strategy represents a novel integration of two powerful technical analysis tools: the Vegas Channel and the SuperTrend indicator. This fusion creates a dynamic, adaptable strategy designed for the volatile and fast-paced cryptocurrency markets, particularly focusing on Bitcoin trading.
Unlike traditional trading strategies that rely on a static set of rules, this approach modifies the SuperTrend's sensitivity to market volatility, offering traders the ability to customize their strategy based on current market conditions. This adaptability makes it uniquely suited to navigating the often unpredictable swings in cryptocurrency valuations, providing traders with signals that are both timely and reflective of underlying market dynamics.
BTC 6h LS
█ Strategy, How it Works: Detailed Explanation
This is an innovative approach that combines the volatility-based Vegas Channel with the trend-following SuperTrend indicator to create dynamic trading signals. This section delves deeper into the mechanics and mathematical foundations of the strategy.
Detail picture to show :
🔶 Vegas Channel Calculation
The Vegas Channel serves as the foundation of this strategy, employing a simple moving average (SMA) coupled with standard deviation to define the upper and lower bounds of the trading channel. This channel adapts to price movements, offering a visual representation of potential support and resistance levels based on historical price volatility.
🔶 SuperTrend Indicator Adjustment
Central to the strategy is the SuperTrend indicator, which is adjusted according to the width of the Vegas Channel. This adjustment is achieved by modifying the SuperTrend's multiplier based on the channel's volatility, allowing the indicator to become more sensitive during periods of high volatility and less so during quieter market phases.
🔶 Trend Determination and Signal Generation
The market trend is determined by comparing the current price with the SuperTrend values. A shift from below to above the SuperTrend line signals a potential bullish trend, prompting a "buy" signal, whereas a move from above to below indicates a bearish trend, generating a "sell" signal. This methodology ensures that trades are entered in alignment with the prevailing market direction, enhancing the potential for profitability.
BTC 6h Local
█ Trade Direction
A distinctive feature of this strategy is its configurable trade direction input, allowing traders to specify whether they wish to engage in long positions, short positions, or both. This flexibility enables users to tailor the strategy according to their risk tolerance, trading style, and market outlook, providing a personalized trading experience.
█ Usage
To utilize the "Vegas SuperTrend - Enhanced" strategy effectively, traders should first adjust the input settings to align with their trading preferences and the specific characteristics of the asset being traded. Monitoring the strategy's signals within the context of overall market conditions and combining its insights with other forms of analysis can further enhance its effectiveness.
█ Default Settings
- Trade Direction: Both (allows trading in both directions)
- ATR Period for SuperTrend: 10 (determines the length of the ATR for volatility measurement)
- Vegas Window Length: 100 (sets the length of the SMA for the Vegas Channel)
- SuperTrend Multiplier Base: 5 (base multiplier for SuperTrend calculation)
- Volatility Adjustment Factor: 5.0 (adjusts SuperTrend sensitivity based on Vegas Channel width)
These default settings provide a balanced approach suitable for various market conditions but can be adjusted to meet individual trading needs and objectives.
Supertrend (Buy/Sell) With TP & SLSupertrend (Buy/Sell) with TP & SL: An Enhanced Trading Tool
This Pine Script indicator combines the popular Supertrend indicator with multiple take-profit (TP) and stop-loss (SL) levels, providing traders with a comprehensive visual aid for potential entries, exits, and risk management.
Originality
Buffer Zones for Precision: Instead of relying solely on the Supertrend line, this script incorporates buffer zones around it. This helps filter out false signals, especially in volatile markets, leading to more accurate buy/sell signals.
Flexible Stop-Loss: Offers the choice between a fixed or trailing stop-loss, allowing traders to tailor their risk management approach based on their preferences and market conditions.
Multiple Take-Profit Levels: Provides three potential take-profit levels, giving traders the flexibility to secure profits at different stages of a trend.
Heikin Ashi Candles & VWAP: Incorporates Heikin Ashi candles for smoother trend visualization and adds a VWAP line for potential support/resistance levels.
Clear Table Display: Presents key information like Stop Loss and Take Profit levels in a user-friendly table, making it easier to track trade targets.
How It Works
Supertrend Calculation: The Supertrend is calculated using ATR (Average True Range) to gauge market volatility. The script then creates buffer zones around the Supertrend line for refined signal generation.
Buy/Sell Signals:
Buy: When the close price crosses above the upper buffer zone, indicating a potential uptrend.
Sell: When the close price crosses below the lower buffer zone, suggesting a potential downtrend.
Take Profit & Stop Loss:
Take Profits: Three TP levels are calculated based on ATR and a customizable profit factor.
Stop Loss: The stop-loss can be set as either a fixed value based on ATR or as a trailing stop-loss that dynamically adjusts to lock in profits.
How To Use
Add the Indicator: Search for "Supertrend (Buy/Sell) With TP & SL" in the TradingView indicators list and add it to your chart.
Customize Inputs: Adjust parameters like ATR Period, Factor, Take Profit Factor, Stop Loss Factor, Stop Loss Type, etc., based on your trading style and preferences.
Interpret Signals: Look for buy signals when the price crosses above the upper buffer and sell signals when it crosses below the lower buffer.
Manage Risk: Use the plotted Take Profit and Stop Loss levels to manage your risk and potential rewards.
Concepts
Supertrend: A trend-following indicator that helps identify the direction of the prevailing trend.
ATR (Average True Range): A measure of market volatility.
Buffer Zones: Used to filter out false signals by creating a zone around the Supertrend line.
Trailing Stop Loss: A dynamic stop-loss that moves with the price to protect profits.
Heikin Ashi: A type of candlestick chart designed to filter out market noise and make trends easier to identify.
VWAP (Volume Weighted Average Price): An indicator that shows the average price at which a security has traded throughout the day, based on both volume and price.
Important Note: This script is for educational and informational purposes only. Backtest thoroughly and use with caution in live trading. Always manage your risk appropriately.
Pivot Point SuperTrend Strategy +TrendFilterIn the dynamic world of financial markets, traders are always on the lookout for innovative strategies to identify trends and make timely trades. The "Pivot Point SuperTrend strategy +TrendFilter" has emerged as an intriguing approach, combining two popular indicators - Pivot Points and SuperTrend, while introducing an additional trend filter for added precision. This strategy draws inspiration from Lonesome TheBlue's "Pivot Point SuperTrend" script, aiming to provide traders with a reliable tool for trend following while minimizing false signals.
The Core Concept:
The strategy's foundation lies in the fusion of Pivot Points and SuperTrend indicators, and the addition of a robust trend filter. It begins by calculating Pivot Highs and Lows over a specified period, serving as crucial reference points for trend analysis. Through a weighted average calculation, these Pivot Points create a center line, refining the overall indicator.
Next, based on the center line and the Average True Range (ATR) with a user-defined Factor, upper and lower bands are generated. These bands adapt to market volatility, adding flexibility to the strategy. The heart of the "Pivot Point SuperTrend" strategy lies in accurately identifying the prevailing trend, with the indicator smoothly transitioning between bullish and bearish signals as the price interacts with the SuperTrend bands.
The additional trend filter introduced into the strategy further enhances its capabilities. This filter is based on a moving average, providing a dynamic assessment of the trend's strength and direction. By combining this trend filter with the original Pivot Point SuperTrend signals, the strategy aims to make more informed and reliable trading decisions.
Advantages of "Pivot Point SuperTrend" with Trend Filter:
1. Enhanced Precision: The incorporation of a trend filter improves the strategy's accuracy by confirming the overall trend direction before generating signals.
2. Trend Continuation: The integration of Pivot Points and SuperTrend, along with the trend filter, aims to prolong trades during strong market trends, potentially maximizing profit opportunities.
3. Reduced Whipsaws: The strategy's weighted average calculation, coupled with the trend filter, helps minimize false signals and reduces whipsaws during uncertain or sideways market conditions.
4. Support and Resistance Insights: The strategy continues to provide additional support and resistance levels based on the Pivot Points, offering valuable contextual information to traders.
JS-TechTrading: Supertrend-Strategy_Basic versionAre you looking for a reliable and profitable algorithmic trading strategy for TradingView? If so, you might be interested in our Supertrend basic strategy, which is based on three powerful indicators: Supertrend (ATR), RSI and EMA.
Supertrend is a trend-following indicator that helps you identify the direction and strength of the market. It also gives you clear signals for entry and exit points based on price movements.
RSI is a momentum indicator that measures the speed and change of price movements. It helps you filter out false signals and avoid overbought or oversold conditions.
EMA is a moving average indicator that smooths out price fluctuations and shows you the long-term trend of the market. It helps you confirm the validity of your trades and avoid trading against the trend.
Our Supertrend basic strategy combines these three indicators to give you a simple yet effective way to trade any market. Here's how it works:
- For long trades, you enter when the price is above Supertrend and pulls back below it (the low of the candle crosses Supertrend) and then rebounds above it (the high of the next candle goes above the pullback candle). You exit when the price closes below Supertrend or when you reach your target profit or stop loss.
- For short trades, you enter when the price is below Supertrend and pulls back above it (the high of the candle crosses Supertrend) and then drops below it (the low of the next candle goes below the pullback candle). You exit when the price closes above Supertrend or when you reach your target profit or stop loss.
- You can also use RSI and EMA filters to improve your results. For long trades, you only enter if RSI is above 50 and price is above 200 EMA. For short trades, you only enter if RSI is below 50 and price is below 200 EMA.
- You can set your stop loss and target profit as a percentage of your entry price or based on other criteria. You can also adjust the parameters of each indicator according to your preferences and risk tolerance.
Our Supertrend basic strategy is easy to use and has been tested on various markets and time frames. It can help you capture consistent profits while minimizing your losses.
Mtf Supertrend Table
english
It is a study of how the supertrend indicator looks on multiple timeframes. You can see the Supertrend direction in Multiple Timeframes by looking at the chart
Türkçe
supertrend indikatörünün çoklu zaman dilimdlerinde nasıl göründüğü yönünde bir çalışmadır. Tabloya bakarak Çoklu Zaman dilimlerinde Supertrend yönünü görebilirsiniz
ADX Supertrend | [DeV]The "ADX Supertrend" indicator is a user-friendly tool that blends two popular trading indicators—the Supertrend and the Average Directional Index (ADX)—to help traders spot trends and make smarter trading decisions. By combining these two, it offers a clearer picture of when a market is trending strongly and in which direction, while cutting down on misleading signals. Here’s a straightforward explanation of how each part works, how they team up, the benefits of using them together, and why the ADX makes the Supertrend even better.
Supertrend:
It's like a guide that follows the market’s price movements to tell you whether prices are trending up or down. It creates two lines, one above and one below the price, based on how much the market is bouncing around (its volatility). When the price moves above the upper line, it signals an uptrend (a good time to buy), and the indicator draws a line below the price to show support. When the price drops below the lower line, it signals a downtrend (a potential time to sell), and the line appears above the price as resistance. The Supertrend is great because it adjusts to market conditions, widening the gap between lines in wild markets and tightening it in calm ones.
Average Directional Index:
The ADX is all about measuring how strong a trend is, without caring whether it’s going up or down. Think of it as a meter that tells you if the market is charging forward with purpose or just drifting aimlessly. It uses a scale from 0 to 100, where higher numbers mean a stronger trend. For example, an ADX above 25 often suggests a solid trend worth paying attention to, while a low ADX signals a sleepy, sideways market. The ADX also looks at whether buyers or sellers are in control to confirm the trend’s direction.
Confluence:
The Supertrend is great at spotting trends, but it can be a bit trigger-happy, giving signals in markets that aren’t really trending. That’s where the ADX shines. It acts like a quality control check, making sure the Supertrend’s signals only count when the market is moving with conviction. By filtering out weak or messy trends, the ADX helps you avoid wasting time on trades that fizzle out. It also double-checks the trend’s direction, so you’re not just guessing whether buyers or sellers are in charge. This teamwork means you get signals that are more reliable and less likely to lead you astray, especially in tricky markets where prices bounce around without a clear path.
Kalman Hull Supertrend [BackQuant]Kalman Hull Supertrend
At its core, this indicator uses a Kalman filter of price, put inside of a hull moving average function (replacing the weighted moving averages) and then using that as a price source for the supertrend instead of the normal hl2 (high+low/2).
Therefore, making it more adaptive to price and also sensitive to recent price action.
PLEASE Read the following, knowing what an indicator does at its core before adding it into a system is pivotal. The core concepts can allow you to include it in a logical and sound manner.
1. What is a Kalman Filter
The Kalman Filter is an algorithm renowned for its efficiency in estimating the states of a linear dynamic system amidst noisy data. It excels in real-time data processing, making it indispensable in fields requiring precise and adaptive filtering, such as aerospace, robotics, and financial market analysis. By leveraging its predictive capabilities, traders can significantly enhance their market analysis, particularly in estimating price movements more accurately.
If you would like this on its own, with a more in-depth description please see our Kalman Price Filter.
2. Hull Moving Average (HMA) and Its Core Calculation
The Hull Moving Average (HMA) improves on traditional moving averages by combining the Weighted Moving Average's (WMA) smoothness and reduced lag. Its core calculation involves taking the WMA of the data set and doubling it, then subtracting the WMA of the full period, followed by applying another WMA on the result over the square root of the period's length. This methodology yields a smoother and more responsive moving average, particularly useful for identifying market trends more rapidly.
3. Combining Kalman Filter with HMA
The innovative combination of the Kalman Filter with the Hull Moving Average (KHMA) offers a unique approach to smoothing price data. By applying the Kalman Filter to the price source before its incorporation into the HMA formula, we enhance the adaptiveness and responsiveness of the moving average. This adaptive smoothing method reduces noise more effectively and adjusts more swiftly to price changes, providing traders with clearer signals for market entries or exits.
The calculation is like so:
KHMA(_src, _length) =>
f_kalman(2 * f_kalman(_src, _length / 2) - f_kalman(_src, _length), math.round(math.sqrt(_length)))
4. Integration with Supertrend
Incorporating this adaptive price smoothing technique into the Supertrend indicator further enhances its efficiency. The Supertrend, known for its proficiency in identifying the prevailing market trend and providing clear buy or sell signals, becomes even more powerful with an adaptive price source. This integration allows the Supertrend to adjust more dynamically to market changes, offering traders more accurate and timely trading signals.
5. Application in a Trading System
In a trading system, the Kalman Hull Supertrend indicator can serve as a critical component for identifying market trends and generating signals for potential entry and exit points. Its adaptiveness and sensitivity to price changes make it particularly useful for traders looking to minimize lag in signal generation and improve the accuracy of their market trend analysis. Whether used as a standalone tool or in conjunction with other indicators, its dynamic nature can significantly enhance trading strategies.
6. Core Calculations and Benefits
The core of this indicator lies in its sophisticated filtering and averaging techniques, starting with the Kalman Filter's predictive adjustments, followed by the adaptive smoothing of the Hull Moving Average, and culminating in the trend-detecting capabilities of the Supertrend. This multi-layered approach not only reduces market noise but also adapts to market volatility more effectively. Benefits include improved signal accuracy, reduced lag, and the ability to discern trend changes more promptly, offering traders a competitive edge.
Thus following all of the key points here are some sample backtests on the 1D Chart
Disclaimer: Backtests are based off past results, and are not indicative of the future.
INDEX:BTCUSD
INDEX:ETHUSD
BINANCE:SOLUSD
Simple SuperTrend Strategy for BTCUSD 4HHello guys!, If you are a swing trader and you are looking for a simple trend strategy, you should check this one. Based in the supertrend indicator, this strategy will help you to catch big movements in BTCUSD 4H and avoid losses as much as possible in consolidated situations of the market
This strategy was designed for BTCUSD in 4H timeframe
Backtesting context: 2020-01-02 to 2023-01-05 (The strategy has also worked in previous years)
Trade conditions:
Rules are actually simple, the most important thing is the risk and position management of this strategy
For long:
Once Supertrend changes from a downtrend to a uptrend, you enter into a long position. The stop loss will be defined by the atr stop loss
The first profit will be of 0.75 risk/reward ratio where half position will be closed. When this happens, you move the stop loss to break even.
Now, just will be there two situations:
Once Supertrend changes from a uptrend to a downtrend, you close the other half of the initial long position.
If price goes againts the position, the position will be closed due to breakeven.
For short:
Once Supertrend changes from a uptrend to a downtrend, you enter into a short position. The stop loss will be defined by the atr stop loss
The first profit will be of 0.75 risk/reward ratio where half position will be closed. When this happens, you move the stop loss to break even.
Like in the long position, just will be there two situations:
Once Supertrend changes from a downtrend to a uptrend, you close the other half of the initial short position.
If price goes againts the position, the position will be closed due to breakeven.
Risk management
For calculate the amount of the position you will use just a small percent of your initial capital for the strategy and you will use the atr stop loss for this.
Example: You have 1000 usd and you just want to risk 2,5% of your account, there is a long signal at price of 20,000 usd. The stop loss price from atr stop loss is 19,000. You calculate the distance in percent between 20,000 and 19,000. In this case, that distance would be of 5,0%. Then, you calculate your position by this way: (initial or current capital * risk per trade of your account) / (stop loss distance).
Using these values on the formula: (1000*2,5%)/(5,0%) = 500usd. It means, you have to use 500 usd for risking 2.5% of your account.
We will use this risk management for apply compound interest.
Script functions
Inside of settings, you will find some utilities for display atr stop loss, supertrend or positions.
You will find the settings for risk management at the end of the script if you want to change something. But rebember, do not change values from indicators, the idea is to not over optimize the strategy.
If you want to change the initial capital for backtest the strategy, go to properties, and also enter the commisions of your exchange and slippage for more realistic results.
Signals meanings:
L for long position. CL for close long position.
S for short position. CS for close short position.
Tp for take profit (it also appears when the position is closed due to stop loss, this due to the script uses two kind of positions)
Exit due to break even or due to stop loss
Some things to consider
USE UNDER YOUR OWN RISK. PAST RESULTS DO NOT REPRESENT THE FUTURE.
DEPENDING OF % ACCOUNT RISK PER TRADE, YOU COULD REQUIRE LEVERAGE FOR OPEN SOME POSITIONS, SO PLEASE, BE CAREFULL AND USE CORRECTLY THE RISK MANAGEMENT
The amount of trades closed in the backtest are not exactly the real ones. If you want to know the real ones, go to settings and change % of trade for first take profit to 100 for getting the real ones. In the backtest, the real amount of opened trades was of 194.
Indicators used:
Supertrend
Atr stop loss by garethyeo
This is the fist strategy that I publish in tradingview, I will be glad with you for any suggestion, support or advice for future scripts. Do not doubt in make any question you have and if you liked this content, leave a boost. I plan to bring more strategies and useful content for you!
Adaptive Supertrend w/ Floating Levels [Loxx]Adaptive Supertrend w/ Floating Levels is a Supertrend indicator made adaptive by comparing the coefficient of determination / average of the least squares. The basic concept is this: use correlation with an r-squared line to adapt the period of the indicator, thereby resulting in a more versatile Supertrend. This adaptive formula makes the Supertrend more reactive to small fluctuation in the market while still doing what it's supposed to do: track trend. In addition, floating levels are drawn above or below the Supertrend which are calculated with percentage of the highest and lowest values of the Supertrend within the last “lookback” period. These floating levels act as filter to detect / prevent false trend reversals. T
What is the Supertrend?
Supertrend indicator was created by Olivier Seban to work on different time frames. It works for futures, forex, and equities. It is used in 15 minutes, hourly, weekly, and daily charts. Based on the parameters of multiplier and period, the indicator normally uses 3 for multiplier and 7 for the ATR period as default values. Average True Range is represented by the number of days while the multiplier is the value by which the range is multiplied.
Included
-Toggle on/off bar coloring
-Toggle on/off adaptivity
-Toggle on/off fill coloring
Close to SupertrendMany a times, we have seen that the price closing in towards supertrend reverses.
This indicator gives signal that identifies high / low of any candle if near the down / up supertrend line by a defined margin using arrow signals.
I've simply re-used readily available supertrend indicator source code and just modified it to these signals. So, almost all of the source code is not mine.
Enter the short / long position when arrow signal appears.
SL / trend reversal will be mandatorily at close of a candle above or below the supertrend line, and the supertrend changes direction.
Hope this indicator comes handy for you.
Adaptive Supertrend with Dynamic Optimization [EdgeTerminal]The Enhanced Adaptive Supertrend represents a significant evolution of the traditional Supertrend indicator, incorporating advanced mathematical optimization, dynamic volatility adjustment, intelligent signal filtering, reduced noise and false positives.
Key Features
Dynamic volatility-adjusted bands
Self-optimizing multiplier
Intelligent signal filtering system
Cooldown period to prevent signal clustering
Clear buy/sell signals with optimal positioning
Smooth trend visualization
RSI and MACD integration for confirmation
Performance-based optimization
Dynamic Band Calculation
Dynamic Band Calculation automatically adapts to market volatility, generates wider bands in volatile periods, reducing false signals. It also generates tighter bands in stable periods, capturing smaller moves and smooth transitions between different volatility regimes.
RSI Integration
The RSI and MACD play multiple crucial roles in the Adaptive Supertrend.
It first helps with momentum factor calculation. This dynamically adjusts band width based on momentum conditions. When the RSI is oversold, bands widen by 20% to prevent false signals during strong downtrends and provide more room for price movements in extreme conditions.
When the RSI is overbought, brands tighten by 20% and they become more sensitive to potential reversals to help catch trend changes earlier.
This reduces false signals in strong trends, helps detect potential reversals earlier than the usual, create adaptive band width based on market conditions and finally, better protection against whipsaws.
MACD Integration
The MACD in this supertrend indicator serves as a trend confirmation tool. The idea is to use MACD crossovers to confirm trend changes to reduce false trend change signals and enhance the signal quality.
For this to become a signal, MACD crossovers must align with price movement to help filter out weak or false signals, which acts as an additional layer of trend confirmation.
Additionally, MACD line position relative to signal line indicates trend strength, helps maintain positions in strong trends and assists in early detection of trend weakening.
Momentum Integration
Momentum Integration prevents false signals in extreme conditions, It adjusts dynamic bands based on market momentum, improves trend confirmation in strong moves and reduces whipsaws during consolidations.
Improved signals
There are a few systems to generate better signals, allowing for generally faster signals compared to original supertrend, such as:
Enforced cooldown period between signals
Prevents signal clustering
Clearer entry/exit points
Reduced false signals during choppy markets
Performance Optimization
This script implements a Sharpe ratio-inspired optimization algorithm to balance returns against risk, penalize large drawdowns, adapt parameters in real-time and improve risk-adjusted performance
Parameter Settings
ATR Period: 10 (default) - adjust based on timeframe
Initial Multiplier: 3.0 (default) - will self-optimize
Optimization Period: 50 (default) - longer periods for more stability
Smoothing Period: 3 (default) - adjust for signal smoothness
Best Practices
Use on multiple timeframes for confirmation
Allow the optimization process to run for at least 50 bars
Monitor the adaptive multiplier for trend strength indication
Consider RSI and MACD alignment for stronger signals
Adoptive Supertrend - BandsAnother adoption of supertrend. This time based on different channels - Bollinger Band, Keltner Channel, Donchian Channel and Pivot point based Donchian channel.
When price hits top of bands, it is considered as start or continuation of uptrend. When price hits bottom of the band it is considered as start or continuation of downtrend. Hence, supertrend is drawn based on these calculations. Use ATR Periods and ATR Multiplier to create stops certain ATR away from band's top and bottom.
Other supertrend adoptions published are here:
Pivot point based donchian channel is published here:
ZigZag SupertrendBack to my favourite supertrend. But, this time on the basis of zigzag pivots.
This is similar to forming supertrend based on pivot high lows - but instead of using pivot poitns, we are using zigzag pivots here.
Zigzag is derived using the same method as this script:
But, have removed labels and display options of zigzag. Older lines are also immediately deleted so that it can work well in lower timeframes without any error. Number of zigzaglines to be kept in memory depends on the parameter History
WaitForConfirmation option when selected only considers the confirmed zigzaglines and will ignore present zigzag line which is forming. This is not going to make much difference as the present zigzag line will be always opposite to low or high it formed and hence will not affect the stop loss levels or reversals.
WaitForClose is for supertrend determination. When checked uses close prices. If unchecked uses highs and lows for supertrend direction update.
ATR parameters allow you to set an adjustment below pivot high lows. This is required because support and resistence are often zones rather than single point. Hence, adds bit more wiggle room for trend continuation and delays frequent reversals on pullbacks.
Concept Dual SuperTrendSimple SuperTrend indicator giving you the option to display two SuperTrends on a single script plus additional customization features. Dual setup inspired by Income Sharks 🦈
Multi Supertrend with no-repaint and HTF optionThis indicator has 2 Supertrends to filter the trend.
The Default one uses the same timeframe as chart.
The additional Supertrend is non-repaint type and can run on higher timeframes.
It has an auto-higher timeframe selection option, thanks to LonesomeTheBlue, the original author.
It is accurate on current timeframe also.
SuperTrend Counter [racer8]SuperTrend Counter counts the number of signals SuperTrend has produced over a defined lookback period. It may be useful if you want to backtest SuperTrend. If so, this is the perfect indicator for you. Special thanks to everget, I used part of his SuperTrend indicator. Enjoy ;)
Triple Supertrend with EMA and ADX strategyPublishing a strategy that includes adx and ema filter as well
Entry: all three Supertrend turns positive. If a filter of ADX and EMA is applied, also check if ADX is above the selected level and close is above EMA
Exit: when the first supertrend turns negative
opposite for short entries
A FIlter is given to take or avoid re-enter on the same side. For example, After a long exit, if the entry condition is satisfied again for long before the short single is triggered it takes re-entry if selected.
Multilevel ZigZag SupertrendVery much similar to :
I have slightly changed code to accommodate multiple zigzags. Also removed possibility of external source to keep it simple.
Indicator shows 2 Level zigzag based supertrends. Second zigzag used is multi level zigzag and hence, this acts as higher timeframe filter and can be considered as overall trend bias.
3 SuperTrends + ATR SL + 3 EMAsHere I have assembled 3 indicators, SuperTrend + ATR + Ema, to make them fit into one indicator to make things more organized and to save space. Check Script for original Authors of the used scripts. The UI or the indicator is far from perfect as my programming skills are very low :D
[RS]Supertrend GridDynamic grid system based on supertrend.
note: the input nlines/nfractions are not locked so if values too high might start overlapping line objects.
Supertrend Crosses_AITSupertrend Crosser
Overview:
The "Supertrend Crosses" indicator is a technical analysis tool that combines two Supertrend lines with different parameters to generate buy and sell signals based on their crossovers. The indicator uses color coding to visualize the market trend and provides alerts for potential trade entries.
1. Settings and Inputs:
Supertrend A:
Factor: Multiplier for the ATR (Average True Range), which determines the sensitivity of Supertrend A.
ATR Period: Number of periods used to calculate the ATR for Supertrend A.
Supertrend B:
Factor: Multiplier for the ATR, which determines the sensitivity of Supertrend B.
ATR Period: Number of periods used to calculate the ATR for Supertrend B.
2. Indicator Components:
Supertrend A:
Plotted on the chart using dynamic coloring:
Green when Supertrend A is above Supertrend B.
Red when Supertrend A is below Supertrend B.
Supertrend B:
Plotted on the chart in white color to provide a visual reference for the crossover signals.
3. Crossover Signals:
Long Signal:
Triggered when Supertrend A crosses above Supertrend B.
A yellow upward triangle ("L") is displayed on the chart below the price bar.
Short Signal:
Triggered when Supertrend A crosses below Supertrend B.
A fuchsia downward triangle ("S") is displayed on the chart above the price bar.
4. How to Use the Indicator:
Identifying Trend Changes:
When Supertrend A crosses above Supertrend B, it indicates a potential upward trend, generating a buy signal.
Conversely, when Supertrend A crosses below Supertrend B, it suggests a potential downward trend, generating a sell signal.
Signal Visualization:
Yellow "L" markers indicate long entry points (buy signals).
Fuchsia "S" markers indicate short entry points (sell signals).
Alerts:
The indicator is equipped with alert conditions for both long and short signals. Users can set up alerts in TradingView to receive notifications when these signals occur.
5. Customization:
Supertrend Parameters:
The factors and ATR periods for Supertrend A and B can be adjusted in the settings to fit different market conditions and trading strategies.
Show Signals Option:
The user can toggle the display of the buy and sell signals on the chart through the "Show Signals?" checkbox in the settings.
6. Visual Representation:
Lines:
Supertrend A: Plotted with dynamic coloring based on its relation to Supertrend B.
Supertrend B: Plotted in white for a clear reference.
Markers:
"L" (yellow) for long signals and "S" (fuchsia) for short signals are plotted on the chart at the point of crossover.
7. Alerts Setup:
Buy Signal Alert: Alerts the user when Supertrend A crosses above Supertrend B.
Sell Signal Alert: Alerts the user when Supertrend A crosses below Supertrend B.
8. Advantages:
Simple and Effective: This indicator simplifies trend identification by using crossovers of two Supertrend lines.
Customizable: The indicator's parameters can be tailored to suit different trading styles and asset classes.
Alerts: Provides alert functionality to ensure traders do not miss trading opportunities.
9. Usage Tips:
Combine with Other Indicators: For more reliable signals, consider using this indicator in conjunction with other technical analysis tools like RSI, MACD, or support and resistance levels.
Risk Management: Always use appropriate risk management techniques, such as stop-loss orders, to protect your capital.
The "Supertrend Crosses" indicator offers a straightforward approach to identifying potential trend reversals and trade entries using the crossover of two Supertrend lines. It provides clear visual signals and alert notifications, making it a valuable tool for traders looking to incorporate trend-following strategies.