Supertrend 3 + DashboardSupertrend 3 + Dashboard (English and Japanese Explanation Below)
日本語解説は下記
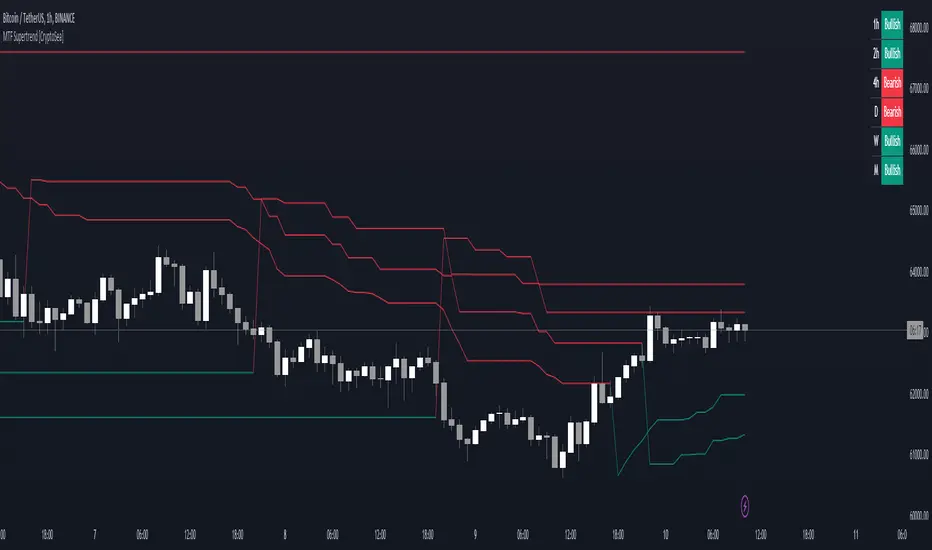
Supertrend 3 + Dashboard is an advanced indicator for traders who wish to monitor multiple time frames simultaneously, combining three Supertrend indicators to provide a customizable dashboard that displays trend direction across multiple time frames. This allows traders to easily identify trends and potential reversals across different time frames, making it a powerful tool in trend-following strategies.
Explanation:
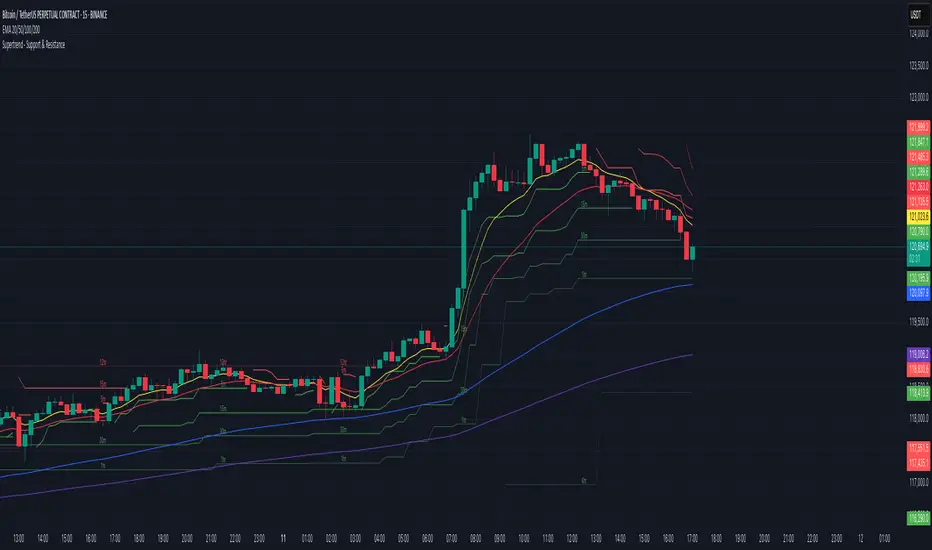
・Supertrend Calculation: The Supertrend indicator is calculated using the Average True Range (ATR) to determine the trend direction. In this indicator, three Supertrend calculations are used, each with customizable ATR lengths and multipliers, allowing traders to adjust the settings to fit their trading strategy.
・Multiple Timeframes: You can set different timeframes for each Supertrend, with default values of the current chart's timeframe for the first Supertrend, 5 minutes for the second, and 15 minutes for the third. These timeframes can be adjusted to fit the trader's preferences, enabling multi-timeframe trend analysis.
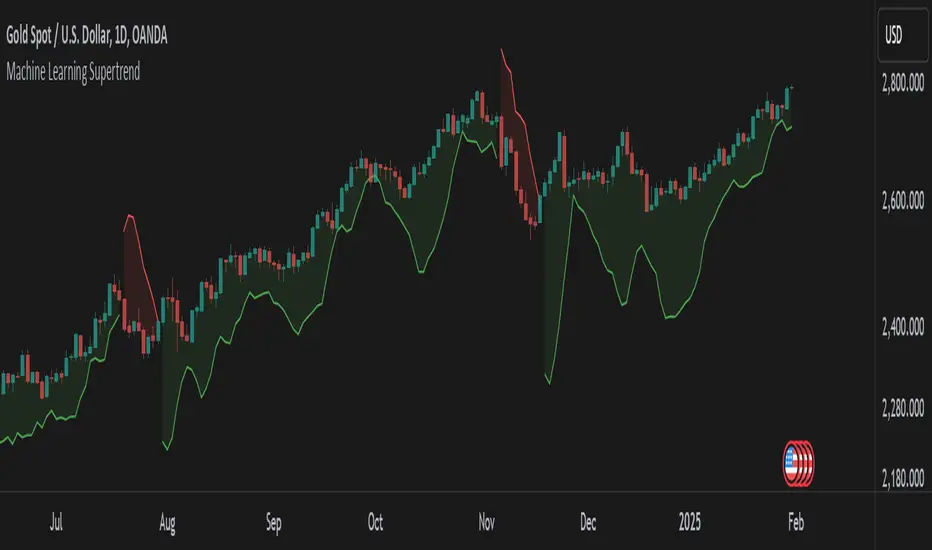
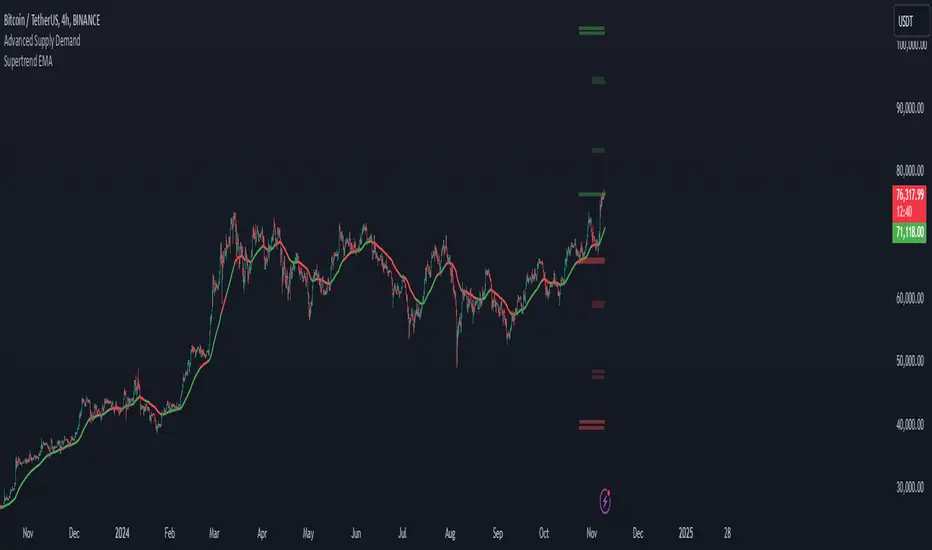
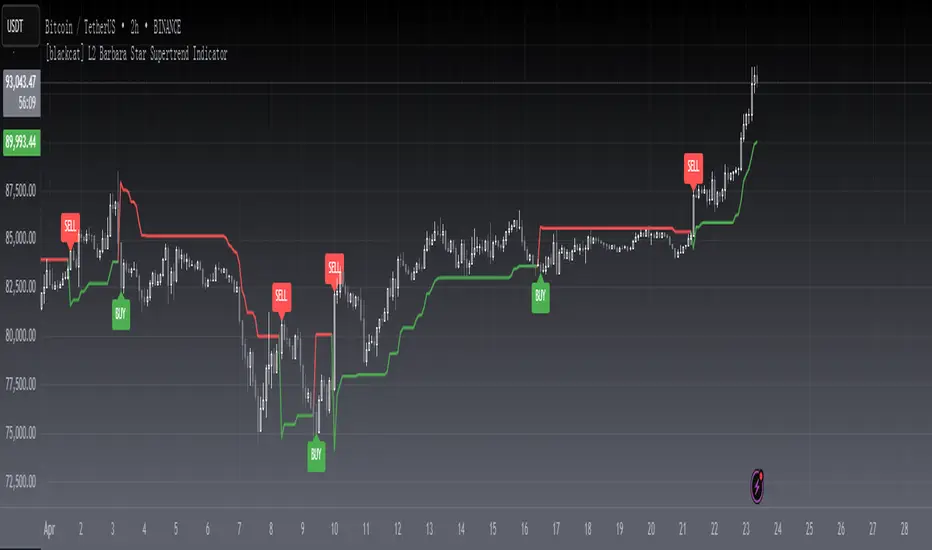
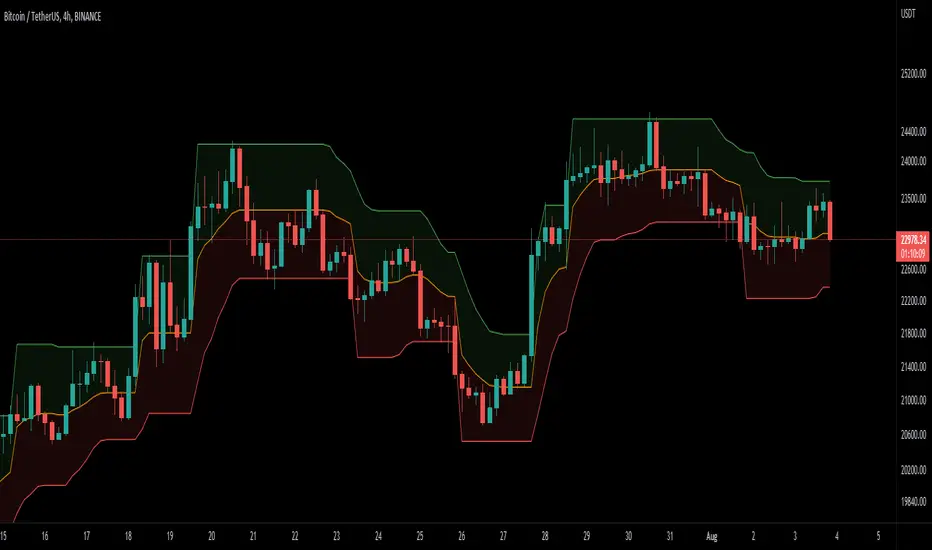
・Color Logic: Each Supertrend changes color based on the trend direction. Green indicates an uptrend, while red indicates a downtrend. The lines and filled areas are color-coded to visually differentiate between bullish and bearish trends across different timeframes.
・Dashboard Feature: The customizable dashboard displays trend signals for multiple timeframes (e.g., 1 minute, 5 minutes, 15 minutes, 1 hour, daily, weekly) in a tabular format. Each cell shows the trend direction with an arrow (▲ for uptrend, ▼ for downtrend), and the background color is adjusted accordingly. The dashboard can be positioned at different corners of the chart (top-left, top-right, bottom-left, bottom-right) based on user preference.
Notes:
Please note that this indicator may be subject to changes or removal without notice. The developer cannot be held responsible for any losses incurred from trading with this indicator, so please operate at your own risk.
Supertrend 3 + Dashboardは、複数の時間軸を同時に監視したいトレーダー向けの高度なインジケーターです。3つのSupertrendインジケーターを組み合わせ、複数の時間軸にわたるトレンド方向を表示するカスタマイズ可能なダッシュボードを提供します。これにより、トレーダーは異なる時間軸でのトレンドや反転の可能性を簡単に把握でき、トレンドフォロー戦略において強力なツールとなります。
・Supertrend計算方法: Supertrendインジケーターは、平均真の範囲(ATR)を使用してトレンド方向を決定します。このインジケーターでは、3つのSupertrend計算が使用され、それぞれにカスタマイズ可能なATRの期間と倍率が設定されており、トレーダーは戦略に合わせて設定を調整できます。
・複数時間軸: 各Supertrendに対して異なる時間軸を設定できます。デフォルトでは、第一のSupertrendは現在のチャートの時間軸、第二は5分、第三は15分に設定されています。これらの時間軸はトレーダーの好みに応じて調整可能で、複数時間軸でのトレンド分析が可能です。
・色のロジック: 各Supertrendは、トレンドの方向に応じて色が変わります。緑は上昇トレンド、赤は下降トレンドを示します。異なる時間軸での強気と弱気のトレンドを視覚的に区別するために、線や塗りつぶしの色が適用されています。
・ダッシュボード機能: カスタマイズ可能なダッシュボードは、1分、5分、15分、1時間、日足、週足など、複数の時間軸にわたるトレンド信号を表形式で表示します。各セルにはトレンド方向が矢印(▲は上昇、▼は下降)で表示され、背景色もそれに応じて調整されます。ダッシュボードの位置は、ユーザーの好みに応じて、チャートの四隅(左上、右上、左下、右下)に配置できます。
注意事項: このインジケーターは予告なく変更または削除される場合があります。このインジケーターを使用しての取引による損失について、開発者は責任を負いかねますので、自己責任でご利用ください。
Penunjuk Pine Script®