Bilateral Stochastic Oscillator StrategyIntroduction
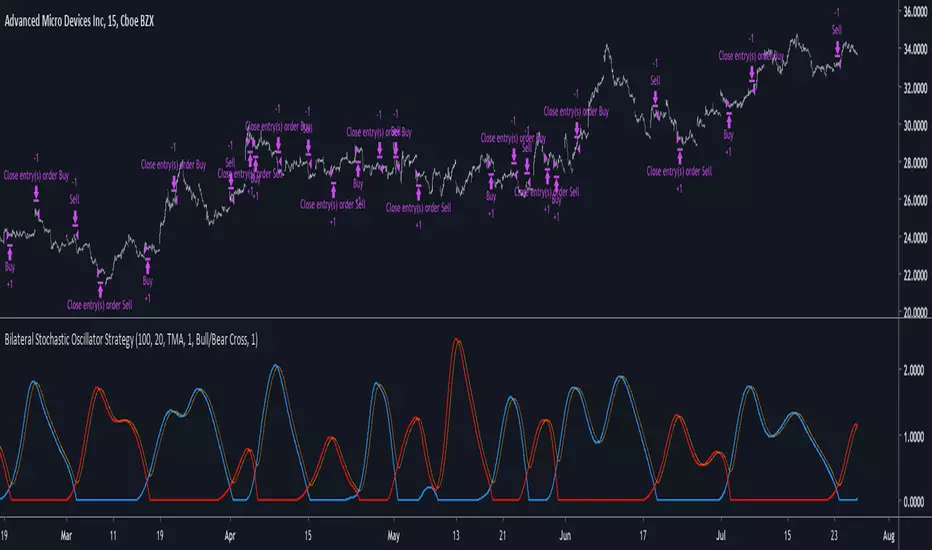
Strategy based on the bilateral stochastic oscillator, this oscillator aim to detect trends and possible reversal points of the current trend. The oscillator is composed of 1 bull line in blue and 1 bear line in red as well as a signal line in orange, the strategy have many options such as two different strategy framework and a martingale mode. If you require more information about the indicator go check it into my uploaded indicators.
Strategy Frameworks
There are two frameworks available that can be selected from the strategy settings window. Both have the same closing conditions, the "Bull/Bear Cross" entry conditions are :
Buy : when the bull line cross over the bear line
Sell : when the bear line cross over the bull line
The "Signal Cross" entry conditions are :
Buy : when the bull line cross over the signal line
Sell : when the bear line cross over the signal line
Both have the same close conditions that is : close when bull/bear cross under the signal line.
Introduction To Martingale
The martingale money management system consist to double the order size after a loosing trade and can be described as a 2^x where x is the current number of loosing trades since the last win trade, when we win a trade the order size return to the default order size. Therefore our order size function is based on exponential growth.
This system enable the trader to win back his previous losses plus a potential profit, martingales must always be used with stops and sometimes take profits in order to get control in a strategy.
It must always be taken into account that in a series of losses the balance can exponentially decay thus ending to 0 in a matter of trades, this is why it is not recommended to use such system. The strategy allow you to select a martingale multiplier that can be inferior to 2 thus limiting risks, a multiplied of 1 disable the martingale.
Results
Those are the some statistics of the strategy applied to some forex majors by using the default settings in a time frames of 15 minutes.
//-------------------------------------------------------
EURUSD - Order Size 1000 - Spread 0.0002
Profit : $ 21.08
Trades : 19
PP : 57.89 %
Profit Factor : 3.228
Max Drawdown : -$ 3.81
Average Trade : $ 1.11
//-------------------------------------------------------
GBPUSD - Order Size 1000 - Spread 0.0002
Profit : $ 2.31
Trades : 20
PP : 55 %
Profit Factor : 0.938
Max Drawdown : -$ 20.29
Average Trade : $ 0.12
//-------------------------------------------------------
EURAUD - Order Size 1000 - Spread 0.0002
Profit : -$ 9.22
Trades : 20
PP : 40 %
Profit Factor : 0.698
Max Drawdown : -$ 23.44
Average Trade : $ 0.46
//-------------------------------------------------------
EURCHF - Order Size 1000 - Spread 0.0002
Profit : $ 1.58
Trades : 24
PP : 54.17 %
Profit Factor : 1.103
Max Drawdown : -$ 7.23
Average Trade : $ 0.07
//-------------------------------------------------------
Conclusions
Based on the results the strategy does not posses the sufficient performance in order to apply a martingale or any other growth systems as order size. Parameters might be subject to drastic changes depending on the market/time-frame in order to return long-term positive results. I let you draw your conclusions.
Cari dalam skrip untuk "take profit"
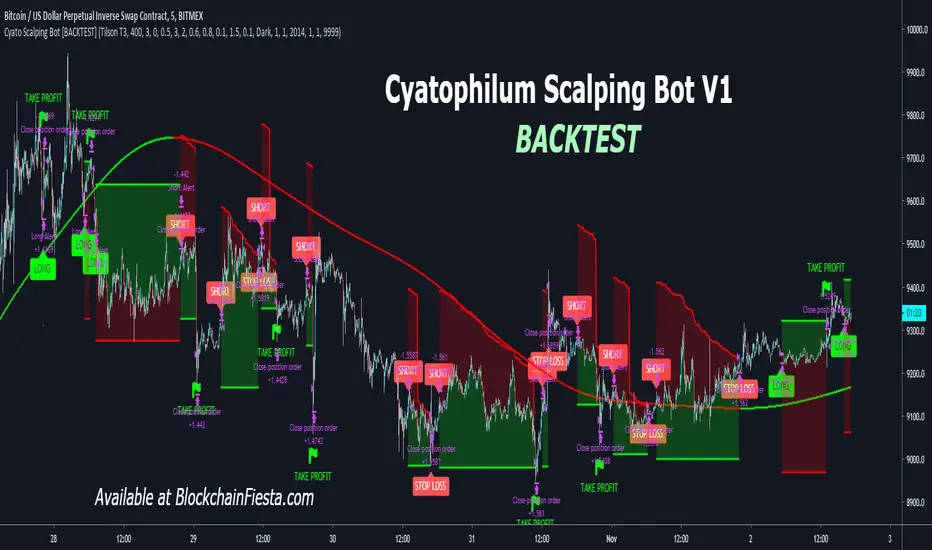
Cyatophilum Scalping Bot [BACKTEST]This indicator triggers Short or/and Long entries and exits.
Example with a Long trade:
The integrated stop loss will trigger an alert to exit the trade.
It is possible that a trend reverses during a trade.
In this case, the "LONG EXIT" alert will trigger at the same
time as the "SHORT ENTRY".
The Trend Detector feature, using EMA or Tilson T3 will filter trades that are against the main trend and thus increase profitability.
BONUS FEATURE
Trailing Take Profit with configurable % deviation.
SAMPLE USE CASES
ETH/BTC
ETH/USD
FOREX: GBP/USD
FOREX: XAU/USD
BTC/USDT
LTC/BTC
XRP/BTC
Read More
> Get access to the Cyatophilum Indicators <
MA cross strategyThis strategy uses simple moving average cross for entry signals, but it can be customized with 3 cases:
1- exit at take profit and stop loss;
2- exit when distance between close and moving average is above a user defined minimum;
3- use Renko candles to calculate the moving average without changing the graph candles.
The third case is the one with better results, but for non-pro users can be used only with daily time frame.
Look at profit factor and percent of winning trades.
You can test also on your favorite pair, but most important is setting correct brick size.
At request, I could share also a screener with alarms for finding which symbol statisfy entry rules.
Please use comment section for any feedback.
********************************** IMPORTANT*******************************
I have developed an expert advisor for metatrader4 (MT4): results of expert advisor form 2015-01-01 to today are very good with low drawdown and good profit.
********************************************************************************

Trend Hunter [BETA]This is in BETA now. Im reaching out to coders for some assistance on my "take profit" targets. As you can see, these are obviously plotshapes, How would I go about setting take profits for backtesting purposes? Thanks in advance

AutoTrendTrader Strategy"The Trend is your Friend" is a popular quote and Day-Traders, as well as long-term Investors, build their Strategies on top of this Mantra.
Leverage this Principle by using AutoTrendTrader to ride the Trend and let your Profits run!
Get Email-Alerts with your customized buy and sell signals, or use autoview to trigger and exit the trades.
Features:
Reliable Detection of Up- and Downtrends - this will enable you to enter strong Trends at the right time
Partial Profit Taking - Configure your perfect Mix of taking profits early vs. letting profits run
Reversing Signals - Limit your Draw-Down
Proprietary Algorithms combined with multiple Confirmations via other Technical Indicators
What's included:
AutoTrendTrader Study (generate Signals)
AutoTrendTrader Strategy (backtest your Settings)

SteveLeoStrat v275%+ accuracy on BTC/USD, IOTA/USD and a few others I have manually tested, only for 30M or 1H timeframe.
If you only take the strongest signals by using human judgement and other indicators, easily rises to 90% accuracy.
Backtested with 3 years of data and there is no repainting. You can use the replay data to check.
I also added an alert function so you can notify yourself when a long or short pops up.
Enter on long when entry is below the green line by at least 1%
Take profit when it reaches the green line or above.
Not all signals are equal. Use with MACD Crossover & Support + Resistance lines and you have a highly profitable system, plus there are other tricks I have discovered from fiddling with it for a long time.
Currently in beta testing for a paid educational program I am creating - can post below if you are interested and I will inform you when it launches.

nATR Reversal StrategyATR Reversal Strategy that has been extended to add an additional ATR based stoploss, trailing stop and take profit.
This script was developed as part of a professional development service. It is published for customer verification and acceptance.
For people interested in professional services, please visit the backtest-rookies (.com) website.
Features
nATR based Stop Loss added
nATR based Trailing stop added
nATR based Take profit added
Switches for each exit type to turn them on or off in the strategy
Plotting of all exit levels on the chart
Prevent reversing when using newly added exits.
Allow reversing when all exit switches are off and opposite long/short conditions are met.
The Always Winning Holy Grail Strategy - Not (by ChartArt)How to win all the time if 1+1 = 2
The most upvoted strategies on Tradingview are those which seemingly work 100%, but they actually don't at all because they are repainting and would not work in live trading reality. They are using the multi-time-frame strategy testing bug and thereby trade during the backtest on close prices before the bar has closed in reality.
Top list of these cheating repainting strategies:
1569 upvotes ANN Strategy
877 upvotes Vdub FX SniperVX3 Strategy
481 upvotes Get Trend Strategy
I guess there are much more strategies among the top upvoted strategies on Tradingview which cheat with a multi-time-frame close price, but three examples are enough. The ANN Strategy uses the daily close price as multi-time-frame and cheats with that. The Vdub FX SniperVX3 Strategy uses the half-day (720 minute) close price to cheat and the Get Trend Strategy uses the 160 minute bar close for repaint cheating (at least here the author of this strategy explains that his strategy is only demo and would not work, which might be the reason why it has 1000 less upvotes than the ANN Strategy. I already wrote months ago a comment underneat these strategies to explain this issue but it hasn't stopped these strategies from getting more and more upvotes and staying in the top list.
I thought this way of cheating is lame, so I invented a new way to cheat my way to seemingly reach 100% profitable trades all the time by going long if 1+1 is equal to 2. Welcome to super wide stop losses. Simply use a extreme unrealistic large stop loss and take profit after a realistic amount of pips and according to Tradingview's current backtest module you win 100% all the time. Yay! :)
My recommendation for the Tradingview team is to add a function to let the user define a stop out and margin call level and maybe set a realistic setting as default, like 100%.
Please don't trade with this strategy!

How to automate this strategy for free using a chrome extension.Hey everyone,
Recently we developed a chrome extension for automating TradingView strategies using the alerts they provide. Initially we were charging a monthly fee for the extension, but we have now decided to make it FREE for everyone. So to display the power of automating strategies via TradingView, we figured we would also provide a profitable strategy along with the custom alert script and commands for the alerts so you can easily cut and paste to begin trading for profit while you sleep.
Step 1:
You are going to need to download the Chrome Extension called AutoView. You can get the extension for free by following this link: bit.ly ( I had to shorten the link as it contains Google and TV automatically converts it to a symbol)
Step 2: Go to your chrome extension page, and under the new extension you'll see a "settings" button. In the setting you will have to connect and give permission to the exchange 1broker allowing the extension to place your orders automatically when triggered by an alert.
Step 3: Setup the strategy and custom script for the alerts in TradingView. The attached script is the strategy, you can play with the settings yourself to try and get better numbers/performance if you please.
This following script is for the custom alerts:
//@version=2
study("4All-Alert", shorttitle="Alerts")
src = close
len = input(4, minval=1, title="Length")
up = rma(max(change(src), 0), len)
down = rma(-min(change(src), 0), len)
rsi = down == 0 ? 100 : up == 0 ? 0 : 100 - (100 / (1 + up / down))
rsin = input(5)
sn = 100 - rsin
ln = 0 + rsin
short = crossover(rsi, sn) ? 1 : 0
long = crossunder(rsi, ln) ? 1 : 0
plot(long, "Long", color=green)
plot(short, "Short", color=red)
Now that you have the extension installed, the custom strategy and alert scripts in place, you simply need to create the alerts.
To get the alerts to communicate with the extension properly, there is a specific syntax that you will need to put in the message of the alert. You can find more details about the syntax here : gist.github.com
For this specific strategy, I use the Alerts script, long/short greater than 0.9 on close.
In the message for a long place this as your message:
Long
c=order b=short
c=position b=short l=200 t=market
b=long q=0.01 l=200 t=market tp=13 sl=25
and for the short...
Short
c=order b=long
c=position b=long l=200 t=market
b=short q=0.01 l=200 t=market tp=13 sl=25
If you'll notice in my above messages, compared to the strategy my tp and sl (take profit and stop loss) vary by a few pips. This is to cover the market opens and spread on 1broker. You can change the tp and sl in the strategy to the above and see that the overall profit will not vary much at all.
I hope this all makes sense and it is enough to not only make some people money, but to show the power of coming up with your own strategy and automating it using TradingView alerts and the free Chrome Extension AutoView.
ps. I highly recommend upgrading your TradingView account so you have access to back testing and multiple alerts.
There is really no reason you won't cover the cost and then some on a monthly basis using the tools provided.
Best of luck and happy trading.
Note: The extension currently allows for automation on 2 exchanges; 1broker and Okcoin. If you do not have accounts there, we'd appreciate you signing up using our referral links.
www.okcoin.com
1broker.com

VWolf – Slope GuardOVERVIEW
Slope Guard combines a momentum core (WaveTrend + RSI/MFI + QQE family) with a directional bias (EMA/DEMA and a DEMA-slope filter). Trade direction can be constrained by the Supertrend regime (Normal or Pivot). Risk is managed with ATR-based stops and targets, optional Supertrend-anchored dynamic levels, and a two-stage take-profit that can shift the stop to break-even after the first partial. The strategy supports explicit Backtest and Forward-test windows and adapts certain thresholds by market type (Forex vs. Stocks).
RECOMMENDED USE
Markets: Forex and equities; use Market Type to properly scale the DEMA-slope gate.
Timeframes: M15–H4 for intraday-swing and H1–D1 for slower swing; avoid ultra-low TFs without tightening ADX/QQE.
Assets: Instruments with persistent trends and orderly pullbacks; avoid flat ranges without sufficient ADX.
Strengths
Multi-layer confluence: trend bias + momentum + regime + strength.
Flexible risk engine: ATR vs. Supertrend anchoring, staged exits, and automatic break-even.
Clean research workflow: separated Backtest and Forward-test windows.
Precautions
Structural latency: Pivot-based constructs confirm with delay; validate with Forward-test.
Filter interaction: QQE Strict + ADX + WT zero-line can become overly selective; calibrate by asset/TF.
Overfitting risk: Prefer simple, portable parameter sets and validate across symbols/TFs.
CONCLUSION
Slope Guard is a “trend + momentum” framework with risk control at its core. By enforcing a baseline bias, validating momentum with the Vuman composite, and offering ATR or Supertrend-anchored exits—plus staged profits and break-even shifts—it seeks to capture the core of directional swings while compressing drawdowns. Keep testing windows isolated, start with moderate filters (QQE Normal, ADX ~20–25), and only add stricter gates (WT zero-line, DEMA slope) once they demonstrably improve stability without starving signals.
FOR MORE INFORMATION VISIT vwolftrading.com

VWolf - Shadow PulseOVERVIEW
The Trend Momentum Breakout Strategy is a rule-based trading system designed to identify high-probability entries in trending markets using a combination of trend confirmation, momentum filtering, and precise trigger conditions. The strategy is suitable for intermediate to advanced traders who prefer mechanical systems with clear entry/exit logic and configurable risk management options.
At its core, this strategy seeks to enter pullbacks within strong trends, capitalizing on momentum continuation after brief pauses in price movement. By integrating multiple moving averages (MAs) for trend validation, ADX (Average Directional Index) as a strength filter, and Stochastic RSI as an entry trigger, the strategy filters out weak trends and avoids overextended market conditions. Exit logic is based on a customizable fixed stop-loss (SL) and take-profit (TP) framework, with optional dynamic risk-reduction mechanisms powered by the Supertrend indicator.
This strategy is designed to perform best in clearly trending markets and is especially effective in avoiding false breakouts or choppy sideways action thanks to its ADX-based filtering. It can be deployed across a variety of asset classes, including forex, stocks, cryptocurrencies, and indices, and is optimized for intra-day to swing trading timeframes.
RECOMMENDED USE
This strategy is designed to be flexible across multiple markets, but it performs best under certain conditions:
Best Suited For:
Trending markets with clear directional momentum.
High-volume instruments that avoid erratic price action.
Assets with intraday volatility and swing patterns.
Recommended Asset Classes:
Forex pairs (e.g., EUR/USD, GBP/JPY)
Cryptocurrencies (e.g., BTC/USD, ETH/USDT)
Major indices (e.g., S&P 500, NASDAQ, DAX)
Large-cap stocks (especially those with consistent liquidity)
Suggested Timeframes:
15-minute to 1-hour charts for intraday setups.
4-hour and daily charts for swing trading.
Lower timeframes (1–5 min) may generate too much noise unless fine-tuned.
Market Conditions to Avoid:
Ranging or sideways markets with low ADX values.
Assets with irregular price structures or low liquidity.
News-heavy periods with unpredictable price spikes.
CONCLUSION
This strategy stands out for its robust and modular approach to trend-following trading, offering a high level of customization while maintaining clear logic and structural discipline in entries and exits. By combining three distinct layers of confirmation—trend identification (via configurable moving averages), trend strength validation (via the DMI filter), and timing (via the Stochastic RSI trigger)—it aims to reduce noise and increase the probability of entering trades with directional bias and momentum on its side.
Its flexibility is one of its strongest points: users can tailor the strategy to fit various trading styles and market conditions. Whether the trader prefers conservative setups using only the slowest moving average, or more aggressive entries requiring full alignment of fast, medium, and slow MAs, the system adjusts accordingly. Likewise, exit management offers both static and dynamic methods—such as ATR-based stop losses, Supertrend-based adaptive exits, and partial profit-taking mechanisms—allowing risk to be managed with precision.
This makes the strategy particularly suitable for trend-driven markets, such as major currency pairs, indices, or volatile stocks that demonstrate clear directional moves. It is not ideal for sideways or choppy markets, where multiple filters may reduce the number of trades or result in whipsaws.
From a practical standpoint, the strategy also incorporates real-world trading mechanics, like time-based filters and account risk control, which elevate it from a purely theoretical model to a more execution-ready system.
In summary, this is a well-structured, modular trend strategy ideal for intermediate to advanced traders who want to maintain control over their system parameters while still benefiting from layered signal confirmation. With proper calibration, it has the potential to become a reliable tool in any trader’s arsenal—particularly in markets where trends emerge clearly and sustainably.
FOR MORE INFORMATION VISIT vwolftrading.com

VWolf – Momentum TwinOVERVIEW
VWolf – Momentum Twin is designed to identify high-probability momentum reversals emerging from overbought or oversold market conditions. It employs a double confirmation from the Stochastic RSI oscillator, optionally filtered by trend and directional movement conditions, before executing trades.
The strategy emphasizes consistent risk management by scaling stop-loss and take-profit targets according to market volatility (ATR), and it provides advanced position management features such as partial profit-taking and automated stop-loss adjustments.
RECOMMENDED USE
Markets: Major FX pairs, index futures, large-cap stocks, and top-volume cryptocurrencies.
Timeframes: Best suited for M15–H4; adaptable for swing trading on daily charts.
Trader Profile: Traders who value structured, volatility-adjusted momentum reversal setups.
Strengths:
Double confirmation filters out many false signals.
Multiple filter options allow strategic flexibility.
ATR scaling maintains consistent risk across assets.
Trade management tools improve adaptability in dynamic markets.
Precautions:
May produce fewer trades in strong one-direction trends.
Over-filtering can reduce trade frequency.
Requires validation across instruments and timeframes before deployment.
CONCLUSION
The VWolf – Momentum Twin offers a disciplined framework for capturing momentum reversals while preserving flexibility through its customizable filters and risk controls. Its double confirmation logic filters out a significant portion of false reversals, while ATR-based scaling ensures consistency across varying market conditions. The optional trade management features, including partial profit-taking and automatic stop adjustments, allow the strategy to adapt to both trending and ranging environments. This makes it a versatile tool for traders who value structured entries, robust risk control, and adaptable management in a variety of markets and timeframes.

🔥 Ribas Waves Strategy PRO++📝 Strategy Description: Ribas Waves Strategy PRO++
The Ribas Waves Strategy PRO++ is a powerful trading system based on the identification of Wolfe Waves patterns, designed to capture high-probability reversal points with precise entries and smart risk management.
This advanced version is fully customizable, allowing traders to adapt entry confirmations, trend filters, and risk/reward ratios to their preferred trading style and market conditions.
⚙️ Key Features:
✅ Automatic detection of both Bullish and Bearish Wolfe Wave patterns
✅ Entry confirmation options:
No confirmation (pure Wolfe pattern)
Directional candle (bullish or bearish close)
Engulfing candle (bullish/bearish)
Inside bar + breakout
✅ Optional EMA trend filter
✅ Configurable take profit via:
Risk multiple (R-multiple: e.g., 3x risk)
Percentage of risk (e.g., 300% of stop-loss distance)
✅ Toggle to show or hide wave labels and structure on chart
✅ Entry cooldown to prevent overlapping trades
✅ Visual display of current strategy position: 📈 Long / 📉 Short / ⛔️ Flat
📌 How to Use:
Set pivot sensitivity based on the asset's volatility (default: 7)
Choose your preferred entry confirmation method
Enable or disable the EMA trend filter
Adjust your take profit logic (R-multiple or % of risk)
Run a backtest or use live alerts for execution
💡 Author Recommendations:
Best suited for volatile markets such as crypto, indices, and forex.
For more trades, disable confirmation filters or use “Directional Candle” mode.
Use higher timeframes or combine with volume/context filters for increased accuracy.
Regularly backtest different settings to optimize your edge on specific assets.

💻 RSI Dual-Band Reversal Strategy (Hacker Mode)This 💻 RSI Dual-Band Reversal Strategy (Hacker Mode) is a mean-reversion trading strategy built on the Relative Strength Index (RSI) indicator.
It identifies potential trend reversals when price momentum reaches extreme overbought or oversold levels — then enters trades expecting the price to revert.
OANDA:USDCNH OANDA:USDCNH OANDA:EURUSD OANDA:BTCUSD CITYINDEX:GBPMXN OANDA:XAUUSD
⚙️ Strategy Concept
The RSI measures market momentum on a scale of 0–100.
When RSI is too low, it signals an oversold market → potential buy.
When RSI is too high, it signals an overbought market → potential sell.
This strategy sets two reversal zones using dual RSI bands:
Zone RSI Range Meaning Action
Upper Band 80–90 Overbought Prepare to Sell
Lower Band 10–20 Oversold Prepare to Buy
🧩 Code Breakdown
1. Input Parameters
rsiLength = input.int(14)
upperBandHigh = input.float(90.0)
upperBandLow = input.float(80.0)
lowerBandLow = input.float(10.0)
lowerBandHigh = input.float(20.0)
You can adjust:
RSI Length (default 14) → sensitivity of the RSI.
Upper/Lower Bands → control when buy/sell triggers occur.
2. RSI Calculation
rsi = ta.rsi(close, rsiLength)
Calculates the RSI of the closing price over 14 periods.
3. Signal Logic
buySignal = ta.crossover(rsi, lowerBandHigh)
sellSignal = ta.crossunder(rsi, upperBandLow)
Buy Signal: RSI crosses up through 20 → market rebounding from oversold.
Sell Signal: RSI crosses down through 80 → market turning from overbought.
4. Plotting
RSI line (lime green)
Bands:
🔴 80–90 (Sell Zone)
🟢 10–20 (Buy Zone)
Gray midline at 50 for reference.
Triangle markers for signals:
🟢 “BUY” below chart
🔴 “SELL” above chart
5. Trading Logic
if (buySignal)
strategy.entry("Buy", strategy.long)
if (sellSignal)
strategy.entry("Sell",
BTCUSD
strategy.short
XAUUSD
)
Opens a long position on a buy signal.
Opens a short position on a sell signal.
No explicit stop loss or take profit — positions reverse when an opposite signal appears.
🧠 How It Works (Step-by-Step Example)
RSI drops below 20 → oversold → buy signal triggers.
RSI rises toward 80 → overbought → sell signal triggers.
Strategy flips position, always staying in the market (either long or short).
📈 Visual Summary
Imagine the RSI line oscillating between 0 and 100:
100 ────────────────────────────────
90 ───── Upper Band High (Sell Limit)
80 ───── Upper Band Low (Sell Trigger)
50 ───── Midline
20 ───── Lower Band High (Buy Trigger)
10 ───── Lower Band Low (Buy Limit)
0 ────────────────────────────────
When RSI moves above 80 → SELL
When RSI moves below 20 → BUY
⚡ Strategy Profile
Category Description
Type Mean Reversion
Entry Rule RSI crosses up 20 → Buy
Exit/Reverse Rule RSI crosses down 80 → Sell
Strengths Simple, effective in sideways/range markets, minimal lag
Weaknesses Weak in strong trends, no stop-loss or take-profit logic
💡 Suggested Improvements
You can enhance this script by adding:
Stop loss & take profit levels (e.g., % or ATR-based).
Trend filter (e.g., trade only in direction of 200 EMA).
RSI smoothing to reduce noise.

CLEVER V151. What it is
Type: Full strategy, not just a visual indicator.
Name: CLEVER v15.
Overlay: Plots directly on the price chart.
Core idea:
Generate long/short signals from either:
Heikin‑Ashi open/close cross, or
EMA cross on ATR‑based Renko bricks,
then manage trades with ATR‑based multi‑take‑profit / stop‑loss, plus rich dashboards.
2. Entry logic (two modes)
Controlled by setup Type:
OANDA:XAUUSD OANDA:BTCUSD OANDA:EURUSD OANDA:USDCNH TVC:USOIL
Open/Close mode (“Open/Close”)
Uses Heikin‑Ashi candles on a higher timeframe (my_time).
Buy condition BUYOC: Heikin‑Ashi close crosses above open (bullish body flip).
Sell condition SELLOC: Heikin‑Ashi close crosses below open (bearish body flip).
Signals must also pass the RSI/ATR filter (trendType, see section 3).
Renko mode (“Renko”)
Builds Renko bricks (ATR‑based by default).
Computes EMAs on Renko close:
EMA1 (fast, length 2),
EMA2 (slow, length 10).
Buy BUYR: EMA1 crosses over EMA2 on Renko close (bullish).
Sell SELLR: EMA1 crosses under EMA2 on Renko close (bearish).
Again, trades only fire when the RSI/ATR filter allows it.
Both modes create unified booleans:
buy_entry = either BUYOC or BUYR
sel_entry = either SELLOC or SELLR
These then drive all trade/TP/SL logic.
3. RSI & ATR “sideways / trend” filter
Configurable via typefilter (“Sideways Filtering Input”), using:
RSI: 7‑period RSI with:
toplimitrsi (default 45),
botlimitrsi (default 10).
ATR filter:
ATR length 5 on the symbol.
ATR MA (EMA or SMA, length 5).
It defines combinations like:
ATR “high vs MA” → trending vs quiet.
RSI “outside band” vs “inside band” → trending vs sideways.
Options:
Filter by ATR only.
Filter by RSI only.
ATR or RSI.
ATR and RSI.
No filtering.
Only enter in sideways market (by ATR/RSI or by both).
Result is trendType (boolean).
If trendType is false, no trades are allowed.
4. Trade types / management modes
Controlled by TPSType:
ATR mode (“ATR”) – full multi‑TP risk management
Uses ATR(20) to set three take‑profit levels and a stop:
TP1 ≈ 1×(factor×ATR)
TP2 ≈ 2×(factor×ATR)
TP3 ≈ 3×(factor×ATR)
SL roughly symmetric the other way.
On a valid long/short entry:
Opens one position ("Long" or "Short").
Scales out using three strategy.exit orders:
TP1: 50% of position.
TP2: 30%.
TP3: 20%.
Uses a persistent state variable condition to track which TP/SL has been hit.
Draws lines and labels for:
Entry, SL, TP1/TP2/TP3.
Fills between Entry–TP area (profit zone) and Entry–SL area (risk zone).
Fires alerts for:
Long/Short entries, exits.
TP1/2/3 hits.
SL hits.
Trailing mode (“Trailing”) – signal‑to‑signal reversals
On buy:
Closes existing "Short", opens "Long".
On sell:
Closes "Long", opens "Short".
No fixed ATR TP/SL here; exit is mainly via opposite signal.
Options mode (“Options”) – long‑only style
On buy:
Opens "Long"; does not automatically close shorts (those lines are commented out).
On sell:
Closes "Long"; does not open new shorts.
Useful if you only want long trades (e.g., options, long‑only instruments).
Backtesting date range is also restricted by fromDate and toDate.
5. Visual elements on the chart
Bar colors
One layer colors bars by trend (up / down) from Heikin‑Ashi or Renko context.
Another layer colors bars simply by close > open vs close < open.
Renko “ribbon” / cloud (almaRibbon)
When enabled, plots paired series (Renko or HA open/close) as circles and fills between them.
Cloud color switches with brick/candle trend.
EMA Cloud
Higher‑timeframe EMAs:
ema (48),
ema2 (2),
ema3 (21).
Uses either current TF or a higher TF (useHTF).
Plots EMAs and fills between them with different colors for uptrend vs downtrend using i_emaCloudColorUp/Down.
Gives a visual trend cloud around price.
DEMA ATR line (BackQuant module)
Computes a double‑EMA smoothed ATR‑based line (DemaAtr) from either HA close or standard close.
Constrains the line within ATR bands.
Colors green when rising, red when falling.
Optional visibility via showAtr.
Labels
Entry labels: “Long”, “Short”.
Exit labels: “Close”.
TP labels: “TP1”, “TP2”, “TP3”.
SL label: “SL”.
Line‑end labels showing numeric values and target pips for TP3/SL/Entry.
6. Dashboards / performance tables
All in the Dashboards group:
Strategy Performance panel
Shows after backtest completes:
Total trades, win rate.
Start/ending capital.
Average win/loss.
Profit factor.
Max run‑up.
Return % and max drawdown %.
Weekly Performance table
Day‑of‑week breakdown (Sun–Sat).
Per day:
Total trades,
Wins, losses,
Win rate %.
You choose whether to classify trades by open time or close time, and which timezone.
Monthly Performance table (QuantNomad style)
Month‑by‑month and year‑by‑year P&L (%).
Heatmap style table by year (rows) vs months (columns) + yearly column.
7. Alerts
The script fires TradingView alert() events for:
Any entry/exit (combined “Any Alert”).
Long Entry / Short Entry.
Long Exit / Short Exit.
Plus, when using TPSType == "ATR", the strategy.exit orders can each carry separate webhook messages for TP/SL.
Summary
This script is an advanced multi‑timeframe, Renko/Heikin‑Ashi EMA‑cross strategy with:
RSI + ATR‑based market‑state filter,
Three trade‑management modes (ATR multi‑TP, simple reversal, long‑only),
Rich visuals (Renko/EMA clouds, DEMA ATR, TP/SL areas),
And several performance dashboards (overall, weekly, monthly).

Options Scalper v2 - SPY/QQQHere's a comprehensive description of the Options Scalper v2 strategy:
---
## Options Scalper v2 - SPY/QQQ
### Overview
A multi-indicator confluence-based scalping strategy designed for trading SPY and QQQ options on short timeframes (1-5 minute charts). The strategy uses a scoring system to generate high-probability CALL and PUT signals by requiring alignment across multiple technical indicators before triggering entries.
---
### Core Logic
The strategy operates on a **scoring system (0-9 points)** where both bullish (CALL) and bearish (PUT) conditions are evaluated independently. A signal only fires when:
1. A recent EMA crossover occurred (within the last 3 bars)
2. The direction's score meets the minimum threshold (default: 4 points)
3. The signal's score is higher than the opposite direction
4. Enough bars have passed since the last signal (cooldown period)
5. Price action occurs during valid trading sessions
---
### Indicators Used
| Indicator | Purpose | CALL Condition | PUT Condition |
|-----------|---------|----------------|---------------|
| **9/21 EMA Cross** | Primary trigger | Fast EMA crosses above slow | Fast EMA crosses below slow |
| **200 EMA** | Trend filter | Price above 200 EMA | Price below 200 EMA |
| **RSI (14)** | Momentum filter | RSI between 45-65 | RSI between 35-55 |
| **VWAP** | Institutional level | Price above VWAP | Price below VWAP |
| **MACD (12,26,9)** | Momentum confirmation | MACD line > Signal line | MACD line < Signal line |
| **Stochastic (14,3)** | Overbought/Oversold | Oversold or K > D | Overbought or K < D |
| **Volume** | Participation confirmation | Spike on green candle | Spike on red candle |
| **Price Structure** | Breakout detection | Higher high formed | Lower low formed |
---
### Scoring Breakdown
**CALL Score (Max 9 points):**
- Recent EMA cross up: +2 pts
- EMA alignment (fast > slow): +1 pt
- RSI in bullish range: +1 pt
- Above VWAP: +1 pt
- MACD bullish: +1 pt
- Volume spike on green candle: +1 pt
- Stochastic setup: +1 pt
- Above 200 EMA: +1 pt
- Breaking higher high: +1 pt
**PUT Score (Max 9 points):**
- Recent EMA cross down: +2 pts
- EMA alignment (fast < slow): +1 pt
- RSI in bearish range: +1 pt
- Below VWAP: +1 pt
- MACD bearish: +1 pt
- Volume spike on red candle: +1 pt
- Stochastic setup: +1 pt
- Below 200 EMA: +1 pt
- Breaking lower low: +1 pt
---
### Risk Management
The strategy uses **ATR-based dynamic stops and targets**:
| Parameter | Default | Description |
|-----------|---------|-------------|
| Stop Loss | 1.5x ATR | Distance below entry for longs, above for shorts |
| Take Profit | 2.0x ATR | Creates a 1:1.33 risk-reward ratio |
Positions are also closed on:
- Opposite direction signal (flip trade)
- Take profit or stop loss hit
---
### Session Filtering
Trades are restricted to high-liquidity periods by default:
- **Morning Session:** 9:30 AM - 11:00 AM EST
- **Afternoon Session:** 2:30 PM - 3:55 PM EST
This avoids choppy midday price action and captures the highest volume periods.
---
### Input Parameters
| Parameter | Default | Description |
|-----------|---------|-------------|
| Fast EMA | 9 | Fast moving average period |
| Slow EMA | 21 | Slow moving average period |
| Trend EMA | 200 | Long-term trend filter |
| RSI Length | 14 | RSI calculation period |
| RSI Overbought | 65 | Upper RSI threshold |
| RSI Oversold | 35 | Lower RSI threshold |
| Volume Multiplier | 1.2x | Volume spike detection threshold |
| Min Signal Strength | 4 | Minimum score required to trigger |
| Crossover Lookback | 3 | Bars to consider crossover "recent" |
| Min Bars Between Signals | 5 | Cooldown period between signals |
---
### Visual Elements
**Chart Plots:**
- Green line: 9 EMA (fast)
- Red line: 21 EMA (slow)
- Gray line: 200 EMA (trend)
- Purple dots: VWAP
**Signal Markers:**
- Green triangle up + "CALL" label: Buy call signal
- Red triangle down + "PUT" label: Buy put signal
- Small circles: EMA crossover reference points
**Info Table (Top Right):**
- Real-time CALL and PUT scores
- RSI, MACD, Stochastic values
- VWAP and 200 EMA position
- Recent crossover status
- Current signal state
---
### Alerts
| Alert Name | Trigger |
|------------|---------|
| CALL Entry | Standard call signal fires |
| PUT Entry | Standard put signal fires |
| Strong CALL | Call signal with score ≥ 6 |
| Strong PUT | Put signal with score ≥ 6 |
---
### Recommended Usage
| Setting | 0DTE Scalping | Intraday Swings |
|---------|---------------|-----------------|
| Timeframe | 1-2 min | 5 min |
| Min Signal Strength | 5-6 | 4 |
| ATR Stop Mult | 1.0 | 1.5 |
| ATR TP Mult | 1.5 | 2.0 |
| Option Delta | 0.40-0.50 | 0.30-0.40 |
---
### Key Improvements Over v1
1. **Requires actual crossover** - Eliminates false signals from simple trend continuation
2. **Balanced scoring** - Both directions evaluated equally, highest score wins
3. **Signal cooldown** - Prevents overtrading with minimum bar spacing
4. **Multi-indicator confluence** - 8 factors must align for signal generation
5. **Volume-candle alignment** - Volume spikes only count when matching candle direction
---
### Disclaimer
This strategy is for educational purposes. Backtest thoroughly before live trading. Options trading involves significant risk of loss. Past performance does not guarantee future results.

XRP Non-Stop Strategy (TP 25% / SL 15%)This strategy performs continuous automated trading exclusively on XRP. It opens long positions during favorable trend conditions, using a fixed Take Profit target of 25% above the entry price and a fixed Stop Loss of 15% below the entry. Once a trade is closed (either TP or SL), the strategy automatically re-enters on the next valid signal, enabling uninterrupted trading.
The script includes:
Dynamic Take Profit & Stop Loss lines
Optional EMA trend filter
Visual BUY and EXIT markers
TradingView alerts for automation or notifications
This strategy is built for traders who want a simple, price-action-driven system without fixed price levels, relying only on percentage-based movement from each entry.

Long Only EMA Strategy (9/20 with 200 EMA Filter)Details:
This strategy is built around a very simple idea: follow the primary trend and enter only when momentum supports it.
It uses three EMAs on a standard candlestick chart:
1. 9‑period EMA – short‑term momentum
2. 20‑period EMA – medium‑term structure
3. 200‑period EMA – long‑term trend filter
The strategy is ** long‑only ** and is mainly designed for swing trading and positional trading.
It avoids counter‑trend trades by taking entries only when price is trading ** above the 200 EMA **, which is commonly used as a long‑term trend reference.
The rules are deliberately kept simple so that they are easy to understand, modify, and test on different markets and timeframes.
---
Key Features
1. **Trend‑Filtered Entries**
- Fresh long positions are considered only when:
- The 9 EMA crosses above the 20 EMA
- The closing price is **above** the 200 EMA
- This attempts to combine short‑term momentum with a higher‑timeframe trend filter.
2. **Clean Exit Logic**
- The long position is exited when the closing price crosses **below** the 20 EMA.
- This creates an objective, rule‑based way to trail the trade as long as the medium‑term structure remains intact.
3. **Long‑Only, No Short Selling**
- The script intentionally ignores short setups.
- This makes it suitable for markets or accounts where short selling is restricted, or for traders who prefer to participate only on the long side of the market.
4. **Simple Visuals**
- All three EMAs are plotted directly on the chart:
- 9 EMA (fast)
- 20 EMA (medium)
- 200 EMA (trend)
- Trade entries and exits are handled by TradingView’s strategy engine, so users can see results in the Strategy Tester as well as directly on the chart.
5. **Backtest‑Friendly Structure**
- Uses TradingView’s built‑in `strategy()` framework.
- Can be applied to different symbols, timeframes, and markets (equities, indices, crypto, etc.).
- Works on standard candlestick charts, which are supported by TradingView’s backtesting engine.
6. **Configurable in Code**
- The EMA periods are defined in the code and can be easily adjusted.
- Users can tailor the parameters to fit their own style (for example, faster EMAs for intraday trading, slower EMAs for positional trades).
---
How to Use
1. **Add the Strategy to Your Chart**
1. Open any symbol and select a **standard candlestick chart**.
2. Apply the strategy from your “My Scripts” section.
3. Make sure it is enabled so that the trades and results appear.
2. **Select Timeframe**
- The logic can be tested on various timeframes:
- Higher timeframes (1H, 4H, 1D) for swing and positional setups.
- Lower timeframes (5m, 15m) for more active trading, if desired.
- Users should experiment and see where the strategy behaves more consistently for their chosen market.
3. **Read the Signals**
- **Entry:**
- A long trade is opened when the 9 EMA crosses above the 20 EMA while the closing price is above the 200 EMA.
- **Exit:**
- The open long position is closed when the closing price crosses below the 20 EMA.
- All orders are generated automatically once the strategy is attached to the chart.
4. **Use the Strategy Tester**
- Go to the **Strategy Tester** tab in TradingView.
- Check:
- Net profit / drawdown
- Win rate and average trade
- List of trades and the equity curve
- Change the date range and timeframe to see how stable the results are over different periods.
5. **Adjust Parameters if Needed**
- Advanced users can open the code and experiment with:
- EMA lengths (for example 8/21 with 200, or 10/30 with 200)
- Risk sizing and capital settings within the `strategy()` call
- Any changes should be thoroughly re‑tested before considering real‑world application.
---
Practical Applications
1. **Swing Trading on Daily Charts**
- Can be applied to stocks, indices, or ETFs on the daily timeframe.
- The 200 EMA acts as a trend filter to stay aligned with the broad direction, while the 9/20 crossover helps catch medium‑term swings inside that trend.
2. **Positional Trades on Higher Timeframes**
- On 4H or 1D charts, this approach can help in holding trades for several days to weeks.
- The exit rule based on the 20 EMA crossing helps avoid emotional decisions and provides a rules‑based way to trail the trend.
3. **Trend‑Following Filter**
- Even if used purely as a filter, the 200 EMA condition can help traders:
- Avoid taking long trades when the market is in a clear downtrend.
- Focus only on instruments that are trading above their long‑term average.
4. **Educational Use**
- The script is intentionally kept straightforward so that newer users can:
- Learn how a moving average crossover strategy works.
- See how to combine a short‑term signal with a long‑term filter.
- Understand how TradingView’s strategy engine handles entries and exits.
5. **Basis for Further Development**
- This can serve as a starting point for more advanced systems.
- Traders can extend it by adding:
- Additional filters (RSI, volume, volatility filters, time‑of‑day filters, etc.)
- Risk management rules (fixed stop loss, take profit, trailing stops).
- The current version is kept minimal on purpose, so modifications are easy to implement and test.
---
Important Notes & Disclaimer
1. This strategy is provided **for testing, research, and educational purposes only**.
2. It is ** not ** a recommendation to buy or sell any financial instrument.
3. Past performance on historical data does not guarantee similar results in live markets.
4. Markets are risky and trading can lead to financial loss; users should always do their own research, manage risk appropriately, and consult a qualified financial professional if needed.
5. Before using any strategy with real capital, it is strongly advised to:
- Forward test it on a demo / paper trading account.
- Check how it behaves during different market phases (trending, sideways, high‑volatility conditions).
You are free to modify the parameters and logic to better align it with your own trading style and risk tolerance.

Triple Screen Scalper [Pro] + Dynamic Risk Engine + Smart DCA🚀 Strategy Concept
This algorithm utilizes a Triple Screen methodology to filter market noise and align trades with the path of least resistance. Instead of relying on a single timeframe, it analyzes market structure across three distinct "horizons" to ensure high-probability execution:
The Tide (Long-Term): Analyzes the dominant directional flow and market bias on higher timeframes.
The Wave (Medium-Term): Measures the strength of the current momentum and pauses trading during weak or "choppy" market phases.
The Ripple (Short-Term): Pinpoints precise entry zones by detecting over-extended price action and mean-reversion opportunities within the larger trend.
The system is fortified with a Smart DCA (Dollar Cost Averaging) Engine that adapts to volatility. It does not blindly add to positions; it calculates "Risk Room" and "Trend Stability" before every additional entry, ensuring capital is deployed efficiently rather than recklessly.
⚙️ Configuration Guide (Variable Explanations)
💰 Position & Leverage
Trade Direction: Choose between Long, Short, or Auto. In "Auto," the system trades both directions based on the dominant trend.
Target Entry Leverage (x): The desired leverage for your initial entry.
Base Order Size (% of Equity): How much of your account balance is allocated to the very first trade of a sequence.
DCA Size Multiplier: Controls how much larger each subsequent order is compared to the previous one. A value of 1.0 means flat sizing; values above 1.0 increase the size of recovery orders.
KILL SWITCH: Max Effective Lev: A safety ceiling. If your total position's effective leverage exceeds this value, the strategy will force-close the position to prevent liquidation.
🚀 Profit Settings (Dynamic Exits)
Use Dynamic Profit?: If enabled, the take-profit target acts like a breathing lung—expanding during high volatility (to catch bigger moves) and contracting during quiet periods.
Gain Volatility Length: The lookback period used to measure recent market volatility.
Gain Multiplier: Scales the profit target. Higher numbers require a larger price move to hit profit; lower numbers take profit sooner.
Minimum Profit Floor %: A hard limit ensuring the target never drops below this percentage, even in extremely low-volatility markets.
📉 Trend & Momentum Filters
Trend Strength Threshold: Defines the minimum "velocity" required to trade. This filters out flat, ranging markets where trends are not established.
Momentum Sensitivity (K/D/Smooth): These variables tune the sensitivity of the entry trigger.
Lower numbers = Faster entries (more trades, potentially more noise).
Higher numbers = Slower, more confirmed entries.
Overbought / Oversold Levels: The specific zones (0-100) where price is considered statistically over-extended, triggering a reversal signal.
🛡️ Risk & DCA Settings
Enable Hard Stop Loss: A traditional safety stop based on a fixed percentage.
Max DCA Orders: The maximum number of times the strategy is allowed to "average down" on a position.
Require Trend for DCA?: If TRUE, the strategy will only add to a losing position if the broader market trend is still valid. If the trend breaks, it stops buying.
DCA Volatility Length/Multiplier: Controls the spacing between buy orders.
High Multiplier = Orders are spread far apart (safer for crashes).
Low Multiplier = Orders are closer together (faster recovery in normal dips).
Risk Scaling: A unique feature that pushes DCA orders further away as your leverage increases, protecting you from adding too much risk too quickly.
Base DCA %: The minimum distance required between orders, regardless of volatility.
⏱️ Timers & Cooldowns
Fast / Slow Cooldown: The minimum time (in seconds) the strategy must wait between realizing a profit and opening a new trade. This prevents "revenge trading" or entering twice on the same candle.
Position Cooldown: A specific timer applied after a large position is closed to let the market settle.
🎯 Daily S/R Targets
Enable Daily S/R: If enabled, the strategy will attempt to "snipe" exits at calculated daily support and resistance pivots.
Proximity Threshold: How close the price must get to a daily level to trigger an early exit.
⚠️ Risk Disclaimer
This script is an automated tool for analysis and execution assistance. It employs averaging techniques (DCA) which involve calculated risk. While the "Kill Switch" and "Risk Scaling" features are designed to mitigate exposure, users should thoroughly backtest and understand the "Multiplier" settings before deploying real capital. Past market structure is not a guarantee of future performance.

Ghost Robo Plus [Bit2Billions]Ghost Robo Plus — Rule-Based Trade Management System
*An advanced, rule-based trading strategy for structured entries, exits, and complete trade management using Heikin-Ashi logic.*
Ghost Robo Plus simplifies trade execution by automating entry, stop-loss, and multiple take-profit levels, all visualized cleanly on your chart. It supports position sizing, backtesting, alerts, and real-time trade tracking, making it easy for traders to test strategies, validate ideas, and follow trades without chart clutter.
Key Features
1. Heikin-Ashi Entry System
* Generates clear long/short signals based on Heikin-Ashi candle crossovers.
* Structured entry logic ensures precise timing aligned with trend direction.
2. Multiple Exit Modes (Switch Anytime)
* ATR Mode: TP1/TP2/TP3 and SL based on ATR distance calculations.
* Trailing Mode: Dynamic trailing logic for trend-following continuation.
* Options Mode: Original options-style behavior preserved for flexible testing.
3. Multi–Take-Profit Structure
* Three configurable take-profit levels (TP1, TP2, TP3) with adjustable percentage splits.
* Enables partial profit-taking with structured scaling.
4. ATR-Based Calculations
* All TP and SL levels are derived from ATR length, profit factors, and stop factors.
* Volatility-adjusted trade placement ensures adaptive risk/reward.
5. Visual Trade Manager
* Automatically draws Entry, Stop Loss, and TP lines directly on chart.
* Includes on-chart labels for Entry, SL, TP, and mini entry/exit markers.
* Visuals update automatically per trade, removing clutter or leftover objects.
6. Alerts
* Built-in alerts for:
* Long entry
* Short entry
* TP/SL exits
* Any trade event (unified alert option)
7. Position Sizing & Commission Support
* Percent-of-equity sizing (10% default, fully adjustable).
* Supports TradingView strategy commission settings for realistic backtesting.
What Ghost Robo Plus Solves
* Automates TP/SL drawings and scaling for faster analysis.
* Lets traders test multiple exit styles without rewriting logic.
* Ensures clear, consistent on-chart visualization for every trade.
* Provides a structured workflow for backtesting and strategy validation.
* Eliminates chart clutter with synchronized, auto-updating visual elements.
Inputs & High-Level Settings
* TPS Mode: ATR / Trailing / Options
* Risk Settings: ATR length, profit factor, stop factor
* TP Splits: Adjustable TP1/TP2/TP3 percentages
* Position Sizing: Percent of equity (default 10%)
* Visual Controls: Auto-managed lines & labels
* Alerts: Entry/exit event triggers
Recommended Timeframes & Markets
* Recommended starting timeframes: 15m and higher (15m, 1H, 4H, Daily). Works on intraday but benefits from cleaner HTF structure.
* Suitable for liquid FX pairs, major crypto, indices and liquid equities.
* On illiquid or low-volume instruments, the volume-split and total-volume filters should be tightened, or higher timeframes should be used.
What Ghost Suite Solves
* Helps reduce manual charting work
* Speeds up analysis with automated visual tools
* Cuts through chart noise for improved clarity
* Provides consistent, rule-based visualization for workflows
Inputs & Settings
* Default settings pre-configured
* Simple Show/Hide toggles for modules
* Minimal exposed fields for ease of use
Recommended Timeframes & Markets
* Works best on 15M, 1H, 4H, Daily, and higher
* Suitable across forex, crypto, indices, and liquid equities
* Pivot-based modules may show noise on illiquid assets
Performance & Limitations
* May draw many objects → disable unused modules for speed
* Refresh the chart if historical buffer issues occur
* TradingView platform limitations handled internally
License & Legal
* Proprietary © 2025
* Redistribution, resale, or disclosure prohibited
* Independently developed with proprietary extensions
* Any resemblance to other tools may result from public-domain concepts
Respect & Transparency
* Built on widely recognized public trading concepts.
* Developed with respect for the TradingView community.
* Any overlaps or similarities can be addressed constructively.
Disclaimer
* Educational purposes only
* Not financial advice
* Trading carries risk — always use paper testing and proper risk management
FAQs
* Source code is not public
* Works best on 15m, 1H, 4H, Daily, Weekly charts
* Modules can be hidden/shown with toggles
* Alerts can be set up manually by users
* Supports multiple markets: forex, crypto, indices, and equities
About Ghost Trading Suite
Author: BIT2BILLIONS
Project: Ghost Trading Suite © 2025
Indicators: Ghost Matrix, Ghost Protocol, Ghost Cipher, Ghost Shadow
Strategies: Ghost Robo, Ghost Robo Plus
Pine Version: V6
The Ghost Trading Suite is designed to simplify and automate many aspects of chart analysis. It helps traders identify market structure, divergences, support and resistance levels, and momentum efficiently, reducing manual charting time.
The suite includes several integrated tools — such as Ghost Matrix, Ghost Protocol, Ghost Cipher, Ghost Shadow, Ghost Robo, and Ghost Robo Plus — each combining analytical modules for enhanced clarity in trend direction, volatility, pivot detection, and momentum tracking.
Together, these tools form a cohesive framework that assists in visualizing market behavior, measuring momentum, detecting pivots, and analyzing price structure effectively.
This project focuses on providing adaptable and professional-grade tools that turn complex market data into clear, actionable insights for technical analysis.
Crafted with 💖 by BIT2BILLIONS for Traders. That's All Folks!
Changelog
v1.0 — Initial Release
* Added Heikin-Ashi–based long/short entry system.
* Introduced three exit modes: ATR, Trailing, and Options.
* Added full multi-TP support with configurable TP1/TP2/TP3 quantities.
* Implemented ATR-based TP/SL calculations for ATR mode.
* Added on-chart visuals for Entry, SL, and TP levels with dynamic cleanup.
* Introduced queue-safe line/label manager to avoid object clutter.
* Added alerts for entries, exits, and general signals.
* Enabled position sizing, backtesting, and commission settings.
* Polished internal logic with a clean, auditable structure for reliability.

Session Opening Range Breakout (ORBO)This strategy automates a classic Opening Range Breakout (ORBO) approach: it builds a price range for the first minutes after the market opens, then looks for strong breakouts above or below that range to catch early directional moves.
Concept
The idea behind ORBO is simple:
The first minutes after the session open are often highly informative.
Price forms an “opening range” that acts as a mini support/resistance zone.
A clean breakout beyond this zone can lead to high-momentum moves.
This script turns that logic into a fully backtestable strategy in TradingView.
How the strategy works
Opening Range Session
Default session: 09:30–09:50 (exchange time)
During this window, the script tracks:
orHigh → highest high within the session
orLow → lowest low within the session
This forms your Opening Range for the day.
Breakout Logic (after the window ends)
Once the defined session ends:
Long Entry:
If the close crosses above the Opening Range High (orHigh),
→ strategy.entry("OR Long", strategy.long) is triggered.
Short Entry:
If the close crosses below the Opening Range Low (orLow),
→ strategy.entry("OR Short", strategy.short) is triggered.
Only one opening range per day is considered, which keeps the logic clean and easy to interpret.
Daily Reset
At the start of a new trading day, the script resets:
orHigh := na
orLow := na
A fresh Opening Range is then built using the next session’s 09:30–09:50 candles.
This ensures entries are always based on today’s structure, not yesterday’s.
Visuals & Inputs
Inputs:
Opening range session → default: "0930-0950"
Show OR levels → toggle visibility of OR High / Low lines
Fill range body → optional shaded zone between OR High and OR Low
Chart visuals:
A green line marks the Opening Range High.
A red line marks the Opening Range Low.
Optional yellow fill highlights the entire OR zone.
Background shading during the session shows when the range is currently being built.
These visuals make it easy to see:
Where the OR sits relative to current price
How clean / noisy the breakout was
How often price respects or rejects the opening zone
Backtesting & Optimization
Because this is written as a strategy():
You can use TradingView’s Strategy Tester to view:
Win rate
Net profit
Drawdown
Profit factor
Equity curve
Ideas to experiment with:
Change the session window (e.g., 09:15–09:45, 10:00–10:30)
Apply to different:
Markets: indices, FX, crypto, stocks
Timeframes: 1m / 5m / 15m
Add your own:
Stop Loss & Take Profit levels
Time filters (only trade certain days / times)
Volatility filters (e.g., ATR, range size thresholds)
Higher-timeframe trend filter (e.g., only take longs above 200 EMA)

AB=CD Fibonacci Strategy (One Trade at a Time)
AB=CD Fibonacci Strategy - Harmonic Pattern Trading Bot
Description
An automated trading strategy that identifies and trades the classic AB=CD harmonic pattern, one of the most reliable geometric price formations in technical analysis. This strategy detects perfectly proportioned Fibonacci retracement setups and executes trades with precise risk-reward management.
How It Works
The indicator scans for the AB=CD pattern structure:
Leg AB: Initial swing from pivot point A to pivot point B
Leg BC: Retracement to point C (customizable Fibonacci levels)
Leg CD: Mirror projection equal to the AB leg length
When price touches point D, the strategy automatically enters a position with predefined take-profit and stop-loss levels based on your risk-reward ratio.
Key Features
One Trade at a Time: Ensures disciplined position management by allowing only one active trade per pattern
Customizable Fibonacci Retracement: Set your preferred retracement range for point C (default 50% - 78.6%)
Risk-Reward Control: Adjust stop-loss and take-profit multiples to match your trading plan
Visual Pattern Display: Clear labeling of A, B, C, D points with pattern lines for easy identification
Both Directions: Identifies bullish and bearish AB=CD patterns automatically
Ideal For
Swing traders on higher timeframes (4H, Daily, Weekly)
Harmonic pattern traders seeking automation
Traders wanting precise entry and exit rules based on Fibonacci geometry
Those looking to reduce emotional trading and increase consistency
Default Settings Optimized For
NASDAQ futures and currency pairs
Medium timeframe analysis
Conservative risk management (10% position size per trade)

Fibot X: GALA Auto StrategyFibot X — GALA Optimized is an algorithmic trading system designed specifically for the GALA/USDT asset.
The algorithm manages trades automatically through a structured multi-target exit model and a predefined stop-loss risk control.
It operates fully autonomously — no external indicators, no manual decisions.
This version is the result of extensive analysis of real market conditions for GALA and comes fully configured.
Users are not required to modify any parameters: the system is pre-calibrated to provide optimal performance while minimizing complexity.
⚠️ Critical Operational Requirements
🔹 Timeframe: 30 minutes only.
All trend detection, entry logic and management layers were engineered and validated exclusively on the 30m timeframe.
Using any other timeframe breaks the model.
🔹 Leverage: strictly x1.
Higher leverage disrupts the internal balance of the strategy and significantly increases risk exposure beyond its intended design.
🔹 Capital Use: 100% allocation.
The take-profit architecture and drawdown control are designed around full equity usage — not partial positions, scaling, or incremental sizing.
Consistency Through System Design
Fibot X does not chase micro-fluctuations, noise or aggressive scalping.
Its purpose is to capture meaningful market swings and convert them into structured profits through intelligent partial exits, avoiding overexposure and premature re-entries.
For long-term stability, the most effective approach is to use multiple Fibot X bots across different assets simultaneously.
Diversifying execution distributes volatility, smooths equity curves and increases system consistency over time — without requiring user intervention.
Philosophy
The strategy’s internal parameters are continuously updated based on performance metrics, ensuring alignment with evolving market conditions and maximizing efficiency within a controlled risk framework.
Fibot X requires no external indicators and no constant monitoring.
Its design is simple: automation, discipline, and consistent execution.
