COMET_Scanner_Library_FINALLibrary "COMET_Scanner_Library"
- A Trader's Edge (ATE)_Library was created to assist in constructing COM Scanners
TickerIDs(_string)
TickerIDs: You must form this single tickerID input string exactly as described in the scripts info panel (little gray 'i' that
is circled at the end of the settings in the settings/input panel that you can hover your cursor over this 'i' to read the
details of that particular input). IF the string is formed correctly then it will break up this single string parameter into
a total of 40 separate strings which will be all of the tickerIDs that the script is using in your COM Scanner.
Parameters:
_string (simple string) : (string)
A maximum of 40 Tickers (ALL joined as 1 string for the input parameter) that is formulated EXACTLY as described
within the tooltips of the TickerID inputs in my COM Scanner scripts:
assets = input.text_area(tIDs, title="TickerIDs (MUST READ TOOLTIP)", group=g2, tooltip="Accepts 40 TICKERID's
for each copy of the script on the chart. \n\n*** MUST FORMAT THIS WAY ***\n\n Each FULL tickerID
(ie 'Exchange:ticker') must be separated by A SINGLE BLANK SPACE for correct formatting. The blank space tells
the script where to break off the ticker to assign it to a variable to be used later in the script. So this input
will be a single string constructed from up to 40 tickerID's with a space between each tickerID
(ie. 'BINANCE:BTCUSDT BINANCE:SXPUSDT BINANCE:XRPUSDT').", display=display.none)
Returns: Returns 40 output variables in the tuple (ie. between the ' ') with the separated TickerIDs,
Locations(_firstLocation)
Locations: This function is used when there's a desire to print an assets ALERT LABELS. A set Location on the scale is assigned to each asset.
This is created so that if a lot of alerts are triggered, they will stay relatively visible and not overlap each other.
If you set your '_firstLocation' parameter as 1, since there are a max of 40 assets that can be scanned, the 1st asset's location
is assigned the value in the '_firstLocation' parameter, the 2nd asset's location is the (1st asset's location+1)...and so on.
Parameters:
_firstLocation (simple int) : (simple int)
Optional (starts at 1 if no parameter added).
Location that you want the first asset to print its label if is triggered to do so.
ie. loc2=loc1+1, loc3=loc2+1, etc.
Returns: Returns 40 variables for the locations for alert labels
LabelSize(_barCnt, _lblSzRfrnce)
INVALID TICKERIDs: This is to add a table in the middle right of your chart that prints all the TickerID's that were either not formulated
correctly in the '_source' input or that is not a valid symbol and should be changed.
LABEL SIZES: This function sizes your Alert Trigger Labels according to the amount of Printed Bars the chart has printed within
a set time period, while also keeping in mind the smallest relative reference size you input in the 'lblSzRfrnceInput'
parameter of this function. A HIGHER % of Printed Bars(aka...more trades occurring for that asset on the exchange),
the LARGER the Name Label will print, potentially showing you the better opportunities on the exchange to avoid
exchange manipulation liquidations.
*** SHOULD NOT be used as size of labels that are your asset Name Labels next to each asset's Line Plot...
if your COM Scanner includes these as you want these to be the same size for every asset so the larger ones dont cover the
smaller ones if the plots are all close to each other ***
Parameters:
_barCnt (float) : (float)
Get the 1st variable('barCnt') from the Security function's tuple and input it as this functions 1st input
parameter which will directly affect the size of the 2nd output variable ('alertTrigLabel') that is also outputted by this function.
_lblSzRfrnce (string) : (string)
Optional (if parameter not included, it defaults to size.small). This will be the size of the variable outputted
by this function named 'assetNameLabel' BUT also affects the size of the output variable 'alertTrigLabel' as it uses this parameter's size
as the smallest size for 'alertTrigLabel' then uses the '_barCnt' parameter to determine the next sizes up depending on the "_barCnt" value.
Returns: ( )
Returns 2 variables:
1st output variable ('AssetNameLabel') is assigned to the size of the 'lblSzRfrnceInput' parameter.
2nd output variable('alertTrigLabel') can be of variying sizes depending on the 'barCnt' parameter...BUT the smallest
size possible for the 2nd output variable ('alertTrigLabel') will be the size set in the 'lblSzRfrnceInput' parameter.
InvalidTickerIDs(_close, _securityTickerid, _invalidArray, _tablePosition, _stackVertical)
Parameters:
_close (float)
_securityTickerid (string)
_invalidArray (array)
_tablePosition (simple string)
_stackVertical (simple bool)
PrintedBarCount(_time, _barCntLength, _barCntPercentMin)
The Printed BarCount Filter looks back a User Defined amount of minutes and calculates the % of bars that have printed
out of the TOTAL amount of bars that COULD HAVE been printed within the same amount of time.
Parameters:
_time (int) : (int)
The time associated with the chart of the particular asset that is being screened at that point.
_barCntLength (int) : (int)
The amount of time (IN MINUTES) that you want the logic to look back at to calculate the % of bars that have actually
printed in the span of time you input into this parameter.
_barCntPercentMin (int) : (int)
The minimum % of Printed Bars of the asset being screened has to be GREATER than the value set in this parameter
for the output variable 'bc_gtg' to be true.
Returns: ( )
Returns 2 outputs:
1st is the % of Printed Bars that have printed within the within the span of time you input in the '_barCntLength' parameter.
2nd is true/false according to if the Printed BarCount % is above the threshold that you input into the '_barCntPercentMin' parameter.
Cari dalam skrip untuk "the script"

COM_Scanner_LibraryLibrary "COM_Scanner_Library"
- A Trader's Edge (ATE)_Library was created to assist in constructing COM Scanners
TickerIDs(_string)
TickerIDs: You must form this single tickerID input string exactly as described in the scripts info panel (little gray 'i' that
is circled at the end of the settings in the settings/input panel that you can hover your cursor over this 'i' to read the
details of that particular input). IF the string is formed correctly then it will break up this single string parameter into
a total of 40 separate strings which will be all of the tickerIDs that the script is using in your COM Scanner.
Parameters:
_string (simple string) : (string)
A maximum of 40 Tickers (ALL joined as 1 string for the input parameter) that is formulated EXACTLY as described
within the tooltips of the TickerID inputs in my COM Scanner scripts:
assets = input.text_area(tIDs, title="TickerIDs (MUST READ TOOLTIP)", group=g2, tooltip="Accepts 40 TICKERID's
for each copy of the script on the chart. \n\n*** MUST FORMAT THIS WAY ***\n\n Each FULL tickerID
(ie 'Exchange:ticker') must be separated by A SINGLE BLANK SPACE for correct formatting. The blank space tells
the script where to break off the ticker to assign it to a variable to be used later in the script. So this input
will be a single string constructed from up to 40 tickerID's with a space between each tickerID
(ie. 'BINANCE:BTCUSDT BINANCE:SXPUSDT BINANCE:XRPUSDT').", display=display.none)
Returns: Returns 40 output variables in the tuple (ie. between the ' ') with the separated TickerIDs,
Locations(_firstLocation)
Locations: This function is used when there's a desire to print an assets ALERT LABELS. A set Location on the scale is assigned to each asset.
This is created so that if a lot of alerts are triggered, they will stay relatively visible and not overlap each other.
If you set your '_firstLocation' parameter as 1, since there are a max of 40 assets that can be scanned, the 1st asset's location
is assigned the value in the '_firstLocation' parameter, the 2nd asset's location is the (1st asset's location+1)...and so on.
Parameters:
_firstLocation (simple int) : (simple int)
Optional (starts at 1 if no parameter added).
Location that you want the first asset to print its label if is triggered to do so.
ie. loc2=loc1+1, loc3=loc2+1, etc.
Returns: Returns 40 variables for the locations for alert labels
LabelSize(_barCnt, _lblSzRfrnce)
INVALID TICKERIDs: This is to add a table in the middle right of your chart that prints all the TickerID's that were either not formulated
correctly in the '_source' input or that is not a valid symbol and should be changed.
LABEL SIZES: This function sizes your Alert Trigger Labels according to the amount of Printed Bars the chart has printed within
a set time period, while also keeping in mind the smallest relative reference size you input in the 'lblSzRfrnceInput'
parameter of this function. A HIGHER % of Printed Bars(aka...more trades occurring for that asset on the exchange),
the LARGER the Name Label will print, potentially showing you the better opportunities on the exchange to avoid
exchange manipulation liquidations.
*** SHOULD NOT be used as size of labels that are your asset Name Labels next to each asset's Line Plot...
if your COM Scanner includes these as you want these to be the same size for every asset so the larger ones dont cover the
smaller ones if the plots are all close to each other ***
Parameters:
_barCnt (float) : (float)
Get the 1st variable('barCnt') from the Security function's tuple and input it as this functions 1st input
parameter which will directly affect the size of the 2nd output variable ('alertTrigLabel') that is also outputted by this function.
_lblSzRfrnce (string) : (string)
Optional (if parameter not included, it defaults to size.small). This will be the size of the variable outputted
by this function named 'assetNameLabel' BUT also affects the size of the output variable 'alertTrigLabel' as it uses this parameter's size
as the smallest size for 'alertTrigLabel' then uses the '_barCnt' parameter to determine the next sizes up depending on the "_barCnt" value.
Returns: ( )
Returns 2 variables:
1st output variable ('AssetNameLabel') is assigned to the size of the 'lblSzRfrnceInput' parameter.
2nd output variable('alertTrigLabel') can be of variying sizes depending on the 'barCnt' parameter...BUT the smallest
size possible for the 2nd output variable ('alertTrigLabel') will be the size set in the 'lblSzRfrnceInput' parameter.
InvalidTickerIDs(_close, _securityTickerid, _invalidArray, _tablePosition, _stackVertical)
Parameters:
_close (float)
_securityTickerid (string)
_invalidArray (array)
_tablePosition (simple string)
_stackVertical (simple bool)
PrintedBarCount(_time, _barCntLength, _barCntPercentMin)
The Printed BarCount Filter looks back a User Defined amount of minutes and calculates the % of bars that have printed
out of the TOTAL amount of bars that COULD HAVE been printed within the same amount of time.
Parameters:
_time (int) : (int)
The time associated with the chart of the particular asset that is being screened at that point.
_barCntLength (int) : (int)
The amount of time (IN MINUTES) that you want the logic to look back at to calculate the % of bars that have actually
printed in the span of time you input into this parameter.
_barCntPercentMin (int) : (int)
The minimum % of Printed Bars of the asset being screened has to be GREATER than the value set in this parameter
for the output variable 'bc_gtg' to be true.
Returns: ( )
Returns 2 outputs:
1st is the % of Printed Bars that have printed within the within the span of time you input in the '_barCntLength' parameter.
2nd is true/false according to if the Printed BarCount % is above the threshold that you input into the '_barCntPercentMin' parameter.
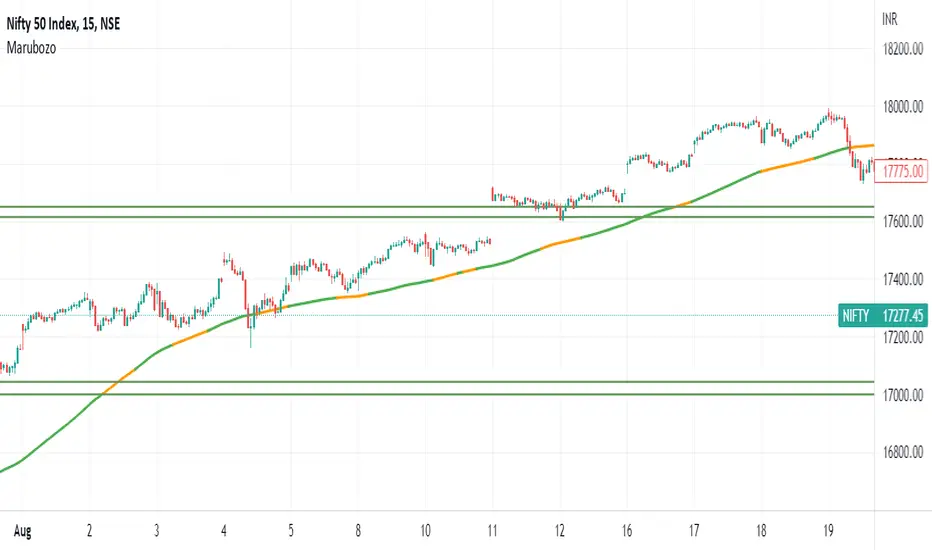
MarubozuMarubozu:
This code is written to identify the Marubozu candles in three different timeframe (30, 45, 60) - and there is an option given to the user for modifying the timeframe according to their wish.
Step to work with this script:
1. The three timeframe will work like this, If you select in chart 15mins - the three levels that you can select are 30, 45, 60, but if you select higher value like 30mins in the chart - you cannot select 45mins as there is a restriction on the code as it will display on the script of divisible by the timeframe selected in the chart.
2. Moving Average 100 is used along with the trend to see whether the immediate trend of the script is negative or positive which will help in taking the script for long or short.
Rules:
1. Always select the timeframe as 15mins in the chart and get the levels from the script.. Mark them in your chart as permanent levels and you can hide the script for further use, and don't reduce the timeframe to 5mins as the level gets changed.
2. The script will identify the High and low of the Marubozu and draws the horizontal line to help the users to see the support and resistance for the script.
3. Always try to trade above the 100sma and marubozu levels at the bottom - and don't look out for the trade where the SMA is very near to resistance or support (when you are short)
CVD - Cumulative Volume Delta (Chart)█ OVERVIEW
This indicator displays cumulative volume delta (CVD) as an on-chart oscillator. It uses intrabar analysis to obtain more precise volume delta information compared to methods that only use the chart's timeframe.
The core concepts in this script come from our first CVD indicator , which displays CVD values as plot candles in a separate indicator pane. In this script, CVD values are scaled according to price ranges and represented on the main chart pane.
█ CONCEPTS
Bar polarity
Bar polarity refers to the position of the close price relative to the open price. In other words, bar polarity is the direction of price change.
Intrabars
Intrabars are chart bars at a lower timeframe than the chart's. Each 1H chart bar of a 24x7 market will, for example, usually contain 60 bars at the lower timeframe of 1min, provided there was market activity during each minute of the hour. Mining information from intrabars can be useful in that it offers traders visibility on the activity inside a chart bar.
Lower timeframes (LTFs)
A lower timeframe is a timeframe that is smaller than the chart's timeframe. This script utilizes a LTF to analyze intrabars, or price changes within a chart bar. The lower the LTF, the more intrabars are analyzed, but the less chart bars can display information due to the limited number of intrabars that can be analyzed.
Volume delta
Volume delta is a measure that separates volume into "up" and "down" parts, then takes the difference to estimate the net demand for the asset. This approach gives traders a more detailed insight when analyzing volume and market sentiment. There are several methods for determining whether an asset's volume belongs in the "up" or "down" category. Some indicators, such as On Balance Volume and the Klinger Oscillator , use the change in price between bars to assign volume values to the appropriate category. Others, such as Chaikin Money Flow , make assumptions based on open, high, low, and close prices. The most accurate method involves using tick data to determine whether each transaction occurred at the bid or ask price and assigning the volume value to the appropriate category accordingly. However, this method requires a large amount of data on historical bars, which can limit the historical depth of charts and the number of symbols for which tick data is available.
In the context where historical tick data is not yet available on TradingView, intrabar analysis is the most precise technique to calculate volume delta on historical bars on our charts. This indicator uses intrabar analysis to achieve a compromise between simplicity and accuracy in calculating volume delta on historical bars. Our Volume Profile indicators use it as well. Other volume delta indicators in our Community Scripts , such as the Realtime 5D Profile , use real-time chart updates to achieve more precise volume delta calculations. However, these indicators aren't suitable for analyzing historical bars since they only work for real-time analysis.
This is the logic we use to assign intrabar volume to the "up" or "down" category:
• If the intrabar's open and close values are different, their relative position is used.
• If the intrabar's open and close values are the same, the difference between the intrabar's close and the previous intrabar's close is used.
• As a last resort, when there is no movement during an intrabar and it closes at the same price as the previous intrabar, the last known polarity is used.
Once all intrabars comprising a chart bar are analyzed, we calculate the net difference between "up" and "down" intrabar volume to produce the volume delta for the chart bar.
█ FEATURES
CVD resets
The "cumulative" part of the indicator's name stems from the fact that calculations accumulate during a period of time. By periodically resetting the volume delta accumulation, we can analyze the progression of volume delta across manageable chunks, which is often more useful than looking at volume delta accumulated from the beginning of a chart's history.
You can configure the reset period using the "CVD Resets" input, which offers the following selections:
• None : Calculations do not reset.
• On a fixed higher timeframe : Calculations reset on the higher timeframe you select in the "Fixed higher timeframe" field.
• At a fixed time that you specify.
• At the beginning of the regular session .
• On trend changes : Calculations reset on the direction change of either the Aroon indicator, Parabolic SAR , or Supertrend .
• On a stepped higher timeframe : Calculations reset on a higher timeframe automatically stepped using the chart's timeframe and following these rules:
Chart TF HTF
< 1min 1H
< 3H 1D
<= 12H 1W
< 1W 1M
>= 1W 1Y
Specifying intrabar precision
Ten options are included in the script to control the number of intrabars used per chart bar for calculations. The greater the number of intrabars per chart bar, the fewer chart bars can be analyzed.
The first five options allow users to specify the approximate amount of chart bars to be covered:
• Least Precise (Most chart bars) : Covers all chart bars by dividing the current timeframe by four.
This ensures the highest level of intrabar precision while achieving complete coverage for the dataset.
• Less Precise (Some chart bars) & More Precise (Less chart bars) : These options calculate a stepped LTF in relation to the current chart's timeframe.
• Very precise (2min intrabars) : Uses the second highest quantity of intrabars possible with the 2min LTF.
• Most precise (1min intrabars) : Uses the maximum quantity of intrabars possible with the 1min LTF.
The stepped lower timeframe for "Less Precise" and "More Precise" options is calculated from the current chart's timeframe as follows:
Chart Timeframe Lower Timeframe
Less Precise More Precise
< 1hr 1min 1min
< 1D 15min 1min
< 1W 2hr 30min
> 1W 1D 60min
The last five options allow users to specify an approximate fixed number of intrabars to analyze per chart bar. The available choices are 12, 24, 50, 100, and 250. The script will calculate the LTF which most closely approximates the specified number of intrabars per chart bar. Keep in mind that due to factors such as the length of a ticker's sessions and rounding of the LTF, it is not always possible to produce the exact number specified. However, the script will do its best to get as close to the value as possible.
As there is a limit to the number of intrabars that can be analyzed by a script, a tradeoff occurs between the number of intrabars analyzed per chart bar and the chart bars for which calculations are possible.
Display
This script displays raw or cumulative volume delta values on the chart as either line or histogram oscillator zones scaled according to the price chart, allowing traders to visualize volume activity on each bar or cumulatively over time. The indicator's background shows where CVD resets occur, demarcating the beginning of new zones. The vertical axis of each oscillator zone is scaled relative to the one with the highest price range, and the oscillator values are scaled relative to the highest volume delta. A vertical offset is applied to each oscillator zone so that the highest oscillator value aligns with the lowest price. This method ensures an accurate, intuitive visual comparison of volume activity within zones, as the scale is consistent across the chart, and oscillator values sit below prices. The vertical scale of oscillator zones can be adjusted using the "Zone Height" input in the script settings.
This script displays labels at the highest and lowest oscillator values in each zone, which can be enabled using the "Hi/Lo Labels" input in the "Visuals" section of the script settings. Additionally, the oscillator's value on a chart bar is displayed as a tooltip when a user hovers over the bar, which can be enabled using the "Value Tooltips" input.
Divergences occur when the polarity of volume delta does not match that of the chart bar. The script displays divergences as bar colors and background colors that can be enabled using the "Color bars on divergences" and "Color background on divergences" inputs.
An information box in the lower-left corner of the indicator displays the HTF used for resets, the LTF used for intrabars, the average quantity of intrabars per chart bar, and the number of chart bars for which there is LTF data. This is enabled using the "Show information box" input in the "Visuals" section of the script settings.
FOR Pine Script™ CODERS
• This script utilizes `ltf()` and `ltfStats()` from the lower_tf library.
The `ltf()` function determines the appropriate lower timeframe from the selected calculation mode and chart timeframe, and returns it in a format that can be used with request.security_lower_tf() .
The `ltfStats()` function, on the other hand, is used to compute and display statistical information about the lower timeframe in an information box.
• The script utilizes display.data_window and display.status_line to restrict the display of certain plots.
These new built-ins allow coders to fine-tune where a script’s plot values are displayed.
• The newly added session.isfirstbar_regular built-in allows for resetting the CVD segments at the start of the regular session.
• The VisibleChart library developed by our resident PineCoders team leverages the chart.left_visible_bar_time and chart.right_visible_bar_time variables to optimize the performance of this script.
These variables identify the opening time of the leftmost and rightmost visible bars on the chart, allowing the script to recalculate and draw objects only within the range of visible bars as the user scrolls.
This functionality also enables the scaling of the oscillator zones.
These variables are just a couple of the many new built-ins available in the chart.* namespace.
For more information, check out this blog post or look them up by typing "chart." in the Pine Script™ Reference Manual .
• Our ta library has undergone significant updates recently, including the incorporation of the `aroon()` indicator used as a method for resetting CVD segments within this script.
Revisit the library to see more of the newly added content!
Look first. Then leap.

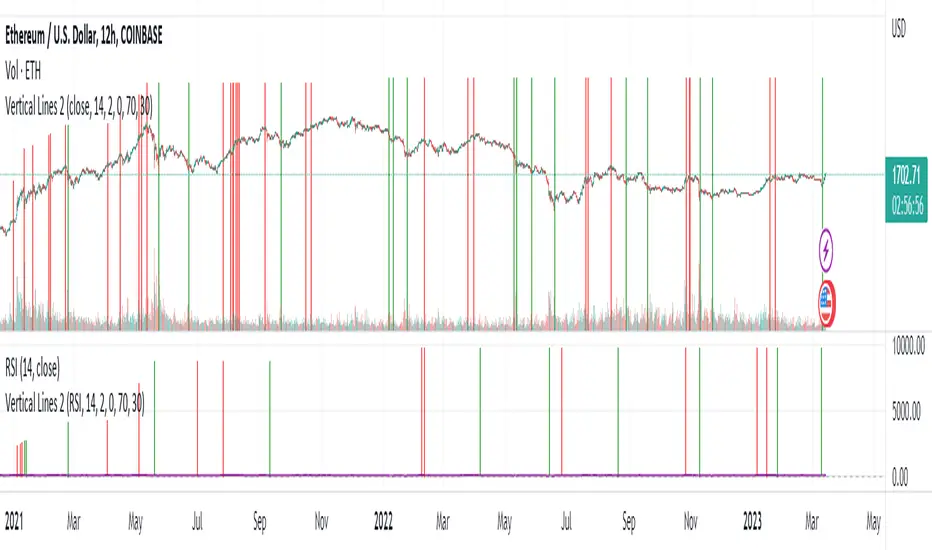
Vertical LinesThis script plots vertical lines on charts or indicators. Unfortunately pinescript is lacking a vertical line plotting function. Vertical lines are useful to mark events, such as crossover of levels, indicators signals or as a time marker.
After searching the internet for a long time and trying different scripts, this script is the simplest and visually the best. You would think that plotting a vertical line would be relatively easy, it is not! I thank the unknow author for sharing this solution and now I will share it on tradingview to make it readily available to anybody that needs it.
RSI crossover signals are used as an example in this script. When the RSI crosses over 70 or below 30, the script plots a red or green vertical line.
The script plots a vertical line as a histogram bar. The histogram bar must have a height.
Setting the height near infinity like 1e20 will cover all the ranges from top to bottom in most charts, but doesn't work all the time. If the chart range is small in values, the line is not plotted or the chart is visually compressed because the top of the bar is also a data point in the chart. Another solution is to find the highest point in the chart and multiply it by a number from 2 to 10 to set the top of the histogram bar. But this solution doesn't work if the line is drawn in the indicator window. additionally if the chart or indicator includes negative values, a histogram bar with a negative height must be concatenated to the histogram bar with a positive height to cover the positive and negative range.
It would seem intuitive to include a vertical plot function since it is very useful and pinescript already has a horizontal line plot function called Hline. But pinescript is becoming less intuitive, and redundant. A case in point is Version 4 variable declaration and naming, it less intuitive and more redundant than previous versions. I beg Tradingview to adopt a more refined scripting language such as Matlab or Python for charting purposes. These languages can be easily ported to other analysis programs for AI or statistical analysis.
Realtime Delta Volume Action [LucF]█ OVERVIEW
This indicator displays on-chart, realtime, delta volume and delta ticks information for each bar. It aims to provide traders who trade price action on small timeframes with volume and tick information gathered as updates come in the chart's feed. It builds its own candles, which are optimized to display volume delta information. It only works in realtime.
█ WARNING
This script is intended for traders who can already profitably trade discretionary on small timeframes. The high cost in fees and the excitement of trading at small timeframes have ruined many newcomers to trading. While trading at small timeframes can work magic for adrenaline junkies in search of thrills rather than profits, I DO NOT recommend it to most traders. Only seasoned discretionary traders able to factor in the relatively high cost of such a trading practice can ever hope to take money out of markets in that type of environment, and I would venture they account for an infinitesimal percentage of traders. If you are a newcomer to trading, AVOID THIS TOOL AT ALL COSTS — unless you are interested in experimenting with the interpretation of volume delta combined with price action. No tool currently available on TradingView provides this type of close monitoring of volume delta information, but if you are not already trading small timeframes profitably, please do not let yourself become convinced that it is the missing piece you needed. Avoid becoming a sucker who only contributes by providing liquidity to markets.
The information calculated by the indicator cannot be saved on charts, nor can it be recalculated from historical bars.
If you refresh the chart or restart the script, the accumulated information will be lost.
█ FEATURES
Key values
The script displays the following key values:
• Above the bar: ticks delta (DT), the total ticks for the bar, the percentage of total ticks that DT represents (DT%)
• Below the bar: volume delta (DV), the total volume for the bar, the percentage of total volume that DV represents (DV%).
Candles
Candles are composed of four components:
1. A top shaped like this: ┴, and a bottom shaped like this: ┬ (picture a normal Japanese candle without a body outline; the values used are the same).
2. The candle bodies are filled with the bull/bear color representing the polarity of DV. The intensity of the body's color is determined by the DV% value.
When DV% is 100, the intensity of the fill is brightest. This plays well in interpreting the body colors, as the smaller, less significant DV% values will produce less vivid colors.
3. The bright-colored borders of the candle bodies occur on "strong bars", i.e., bars meeting the criteria selected in the script's inputs, which you can configure.
4. The POC line is a small horizontal line that appears to the left of the candle. It is the volume-weighted average of all price updates during the bar.
Calculations
This script monitors each realtime update of the chart's feed. It first determines if price has moved up or down since the last update. The polarity of the price change, in turn, determines the polarity of the volume and tick for that specific update. If price does not move between consecutive updates, then the last known polarity is used. Using this method, we can calculate a running volume delta and ticks delta for the bar, which becomes the bar's final delta values when the bar closes (you can inspect values of elapsed realtime bars in the Data Window or the indicator's values). Note that these values will all reset if the script re-executes because of a change in inputs or a chart refresh.
While this method of calculating is not perfect, it is by far the most precise way of calculating volume delta available on TradingView at the moment. Calculating more precise results would require scripts to have access to tick data from any chart timeframe. Charts at seconds timeframes do use exchange/broker ticks when the feeds you are using allow for it, and this indicator will run on them, but tick data is not yet available from higher timeframes. Also, note that the method used in this script is far superior to the intrabar inspection technique used on historical bars in my other "Delta Volume" indicators. This is because volume and ticks delta here are calculated from many more realtime updates than the available intrabars in history. Unfortunately, the calculation method used here cannot be used on historical bars, where intrabar inspection remains, in my opinion, the optimal method.
Inputs
The script's inputs provide many ways to personalize all the components: what is displayed, the colors used to display the information, and the marker conditions. Tooltips provide details for many of the inputs; I leave their exploration to you.
Markers
Markers provide a way for you to identify the points of interest of your choice on the chart. You control the set of conditions that trigger each of the five available markers.
You select conditions by entering, in the field for each marker, the number of each condition you want to include, separated by a comma. The conditions are:
1 — The bar's polarity is up/dn.
2 — `close` rises/falls ("rises" means it is higher than its value on the previous bar).
3 — DV's polarity is +/–.
4 — DV% rises (↕).
5 — POC rises/falls.
6 — The quantity of realtime updates rises (↕).
7 — DV > limit (You specify the limit in the inputs. Since DV can be +/–, DV– must be less than `–limit` for a short marker).
8 — DV% > limit (↕).
9 — DV+ rises for a long marker, DV– falls for a short.
10 — Consecutive DV+/DV– on two bars.
11 — Total volume rises (↕).
12 — DT's polarity is +/–.
13 — DT% rises (↕).
14 — DT+ rises for a long marker, DT– falls for a short.
Conditions showing the (↕) symbol do not have symmetrical states; they act more like filters. If you only include condition 4 in a marker's setup, for example, both long and short markers will trigger on bars where DV% rises. To trigger only long or short markers, you must add a condition providing directional differentiation, such as conditions 1 or 2. Accordingly, you would enter "1,4" or "2,4".
For a marker to trigger, ALL the conditions you specified for it must be met. Long markers appear on the chart as "Mx▲" signs under the values displayed below candles. Short markers display "Mx▼" over the number of updates displayed above candles. The marker's number will replace the "x" in "Mx▲". The script loads with five markers that will not trigger because no conditions are associated with them. To activate markers, you will need to select and enter the set of conditions you require for each one.
Alerts
You can configure alerts on this script. They will trigger whenever one of the configured markers triggers. Alerts do not repaint, so they trigger at the bar's close—which is also when the markers will appear.
█ HOW TO USE IT
As a rule, I do not prescribe expected use of my indicators, as traders have proved to be much more creative than me in using them. Additionally, I tend to think that if you expect detailed recommendations from me to be able to use my indicators, it's a sign you are in a precarious situation and should go back to the drawing board and master the necessary basics that will allow you to explore and decide for yourself if my indicators can be useful to you, and how you will use them. I will make an exception for this thing, as it presents fairly novel information. I will use simple logic to surmise potential uses, as contrary to most of my other indicators, I have NOT used this one to actually trade. Markets have a way of throwing wrenches in our seemingly bullet-proof rationalizing, so drive cautiously and please forgive me if the pointers I share here don't pan out.
The first thing to do is to disable your normal bars. You can do this by clicking on the eye icon that appears when you hover over the symbol's name in the upper-left corner of your chart.
The absolute value and polarity of DV mean little without perspective; that's why I include both total volume for the bar and the percentage that DV represents of that total volume. I interpret a low DV% value as indecision. If you share that opinion, you could, let's say, configure one of the markers on "DV% > 80%", for example (to do so you would enter "8" in the condition field of any marker, and "80" in the limit field for condition 8, below the marker conditions).
I also like to analyze price action on the bar with DV%. Small DV% values should often produce small candle bodies. If a small DV% value occurs on a bar with much movement and high volume, I'm thinking "tough battle with potential explosive power when one side wins". Conversely, large bodies with high DV% mean that large volume is breaching through multiple levels, or that nobody is suddenly willing to take the other side of a normal volume of trades.
I find the POC lines really interesting. First, they tell us the price point where the most significant action (taking into account both price occurrences AND volume) during the bar occurred. Second, they can be useful when compared against past values. Third, their color helps us in figuring out which ones are the most significant. Unsurprisingly, bunches of orange POCs tend to appear in consolidation zones, in pauses, and before reversals. It may be useful to often focus more on POC progression than on `close` values. This is not to say that OHLC values are not useful; looking, as is customary, for higher highs or lower lows, or for repeated tests of precise levels can of course still be useful. I do like how POCs add another dimension to chart readings.
What should you do with the ticks delta above bars? Old-time ticker tape readers paid attention to the sounds coming from it (the "ticker" moniker actually comes from the sound they made). They knew activity was picking up when the frequency of the "ticks" increased. My thinking is that the total number of ticks will help you in the same way, since increasing updates usually mean growing interest—and thus perhaps price movement, as increasing volatility or volume would lead us to surmise. Ticks delta can help you figure out when proportionally large, random orders come in from traders with other perspectives than the short-term price action you are typically working with when you use this tool. Just as volume delta, ticks delta are one more informational component that can help you confirm convergence when building your opinions on price action.
What are strong bars? They are an attempt to identify significance. They are like a default marker, except that instead of displaying "Mx▲/▼" below/above the bar, the candle's body is outlined in bright bull/bear color when one is detected. Strong bars require a respectable amount of conditions to be met (you can see and re-configure them in the inputs). Think of them as pushes rather than indications of an upcoming, strong and multi-bar move. Pushes do, for sure, often occur at the beginning of strong trends. You will often see a few strong bars occur at 2-3 bar intervals at the beginning or middle of trends. But they also tend to occur at tops/bottoms, which makes their interpretation problematic. Another pattern that you will see quite frequently is a final strong bar in the direction of the trend, followed a few bars later by another strong bar in the reverse direction. My summary analyses seemed to indicate these were perhaps good points where one could make a bet on an early, risky reversal entry.
The last piece of information displayed by the indicator is the color of the candle bodies. Three possible colors are used. Bull/bear is determined by the polarity of DV, but only when the bar's polarity matches that of DV. When it doesn't, the color is the divergence color (orange, by default). Whichever color is used for the body, its intensity is determined by the DV% value. Maximum intensity occurs when DV%=100, so the more significant DV% values generate more noticeable colors. Body colors can be useful when looking to confirm the convergence of other components. The visual effect this creates hopefully makes it easier to detect patterns on the chart.
One obvious methodology that comes to mind to trade with this tool would be to use another indicator like Technical Ratings at a higher timeframe to identify the larger context's trend, and then use this tool to identify entries for short-term trades in that direction.
█ NOTES AND RAMBLINGS
Instant Calculations
This indicator uses instant values calculated on the bar only. No moving averages or calculations involving historical periods are used. The only exception to this rule is in some of the marker conditions like "Two consecutive DV+ values", where information from the previous bar is used.
Trading Small vs Long Timeframes
I never trade discretionary at the 5sec–5min timeframes this indicator was designed to be used with; I trade discretionary at 1D, 1W and 1M timeframes, and let systems trade at smaller timeframes. The higher the timeframe you trade at, the fewer fees you will pay because you trade less and are not churning trading volume, as is inevitable at smaller timeframes. Trading at higher timeframes is also a good way to gain an instant edge on most of the trading crowd that has its nose to the ground and often tends to forget the big picture. It also makes for a much less demanding trading practice, where you have lots of time to research and build your long-term opinions on potential future outcomes. While the future is always uncertain, I believe trades riding on long-term trends have stronger underlying support from the reality outside markets.
To traders who will ask why I publish an indicator designed for small timeframes, let me say that my main purpose here is to showcase what can be done with Pine. I often see comments by coders who are obviously not aware of what Pine is capable of in 2021. Since its humble beginnings seven years ago, Pine has grown and become a serious programming language. TradingView's growing popularity and its ongoing commitment to keep Pine accessible to newcomers to programming is gradually making Pine more and more of a standard in indicator and strategy programming. The technical barriers to entry for traders interested in owning their trading practice by developing their personal tools to trade have never been so low. I am also publishing this script because I value volume delta information, and I present here what I think is an original way of analyzing it.
Performance
The script puts a heavy load on the Pine runtime and the charting engine. After running the script for a while, you will often notice your chart becoming less responsive, and your chart tab can take longer to activate when you go back to it after using other tabs. That is the reason I encourage you to set the number of historical values displayed on bars to the minimum that meets your needs. When your chart becomes less responsive because the script has been running on it for many hours, refreshing the browser tab will restart everything and bring the chart's speed back up. You will then lose the information displayed on elapsed bars.
Neutral Volume
This script represents a departure from the way I have previously calculated volume delta in my scripts. I used the notion of "neutral volume" when inspecting intrabar timeframes, for bars where price did not move. No longer. While this had little impact when using intrabar inspection because the minimum usable timeframe was 1min (where bars with zero movement are relatively infrequent), a more precise way was required to handle realtime updates, where multiple consecutive prices often have the same value. This will usually happen whenever orders are unable to move across the bid/ask levels, either because of slow action or because a large-volume bid/ask level is taking time to breach. In either case, the proper way to calculate the polarity of volume delta for those updates is to use the last known polarity, which is how I calculate now.
The Order Book
Without access to the order book's levels (the depth of market), we are limited to analyzing transactions that come in the TradingView feed for the chart. That does not mean the volume delta information calculated this way is irrelevant; on the contrary, much of the information calculated here is not available in trading consoles supplied by exchanges/brokers. Yet it's important to realize that without access to the order book, you are forfeiting the valuable information that can be gleaned from it. The order book's levels are always in movement, of course, and some of the information they contain is mere posturing, i.e., attempts to influence the behavior of other players in the market by traders/systems who will often remove their orders when price comes near their order levels. Nonetheless, the order book is an essential tool for serious traders operating at intraday timeframes. It can be used to time entries/exits, to explain the causes of particular price movements, to determine optimal stop levels, to get to know the traders/systems you are betting against (they tend to exhibit behavioral patterns only recognizable through the order book), etc. This tool in no way makes the order book less useful; I encourage all intraday traders to become familiar with it and avoid trading without one.

Delta Volume Columns Pro [LucF]█ OVERVIEW
This indicator displays volume delta information calculated with intrabar inspection on historical bars, and feed updates when running in realtime. It is designed to run in a pane and can display either stacked buy/sell volume columns or a signal line which can be calculated and displayed in many different ways.
Five different models are offered to reveal different characteristics of the calculated volume delta information. Many options are offered to visualize the calculations, giving you much leeway in morphing the indicator's visuals to suit your needs. If you value delta volume information, I hope you will find the time required to master Delta Volume Columns Pro well worth the investment. I am confident that if you combine a proper understanding of the indicator's information with an intimate knowledge of the volume idiosyncrasies on the markets you trade, you can extract useful market intelligence using this tool.
█ WARNINGS
1. The indicator only works on markets where volume information is available,
Please validate that your symbol's feed carries volume information before asking me why the indicator doesn't plot values.
2. When you refresh your chart or re-execute the script on the chart, the indicator will repaint because elapsed realtime bars will then recalculate as historical bars.
3. Because the indicator uses different modes of calculation on historical and realtime bars, it's critical that you understand the differences between them. Details are provided further down.
4. Calculations using intrabar inspection on historical bars can only be done from some chart timeframes. See further down for a list of supported timeframes.
If the chart's timeframe is not supported, no historical volume delta will display.
█ CONCEPTS
Chart bars
Three different types of bars are used in charts:
1. Historical bars are bars that have already closed when the script executes on them.
2. The realtime bar is the current, incomplete bar where a script is running on an open market. There is only one active realtime bar on your chart at any given time.
The realtime bar is where alerts trigger.
3. Elapsed realtime bars are bars that were calculated when they were realtime bars but have since closed.
When a script re-executes on a chart because the browser tab is refreshed or some of its inputs are changed, elapsed realtime bars are recalculated as historical bars.
Why does this indicator use two modes of calculation?
Historical bars on TradingView charts contain OHLCV data only, which is insufficient to calculate volume delta on them with any level of precision. To mine more detailed information from those bars we look at intrabars , i.e., bars from a smaller timeframe (we call it the intrabar timeframe ) that are contained in one chart bar. If your chart Is running at 1D on a 24x7 market for example, most 1D chart bars will contain 24 underlying 1H bars in their dilation. On historical bars, this indicator looks at those intrabars to amass volume delta information. If the intrabar is up, its volume goes in the Buy bin, and inversely for the Sell bin. When price does not move on an intrabar, the polarity of the last known movement is used to determine in which bin its volume goes.
In realtime, we have access to price and volume change for each update of the chart. Because a 1D chart bar can be updated tens of thousands of times during the day, volume delta calculations on those updates is much more precise. This precision, however, comes at a price:
— The script must be running on the chart for it to keep calculating in realtime.
— If you refresh your chart you will lose all accumulated realtime calculations on elapsed realtime bars, and the realtime bar.
Elapsed realtime bars will recalculate as historical bars, i.e., using intrabar inspection, and the realtime bar's calculations will reset.
When the script recalculates elapsed realtime bars as historical bars, the values on those bars will change, which means the script repaints in those conditions.
— When the indicator first calculates on a chart containing an incomplete realtime bar, it will count ALL the existing volume on the bar as Buy or Sell volume,
depending on the polarity of the bar at that point. This will skew calculations for that first bar. Scripts have no access to the history of a realtime bar's previous updates,
and intrabar inspection cannot be used on realtime bars, so this is the only to go about this.
— Even if alerts only trigger upon confirmation of their conditions after the realtime bar closes, they are repainting alerts
because they would perhaps not have calculated the same way using intrabar inspection.
— On markets like stocks that often have different EOD and intraday feeds and volume information,
the volume's scale may not be the same for the realtime bar if your chart is at 1D, for example,
and the indicator is using an intraday timeframe to calculate on historical bars.
— Any chart timeframe can be used in realtime mode, but plots that include moving averages in their calculations may require many elapsed realtime bars before they can calculate.
You might prefer drastically reducing the periods of the moving averages, or using the volume columns mode, which displays instant values, instead of the line.
Volume Delta Balances
This indicator uses a variety of methods to evaluate five volume delta balances and derive other values from those balances. The five balances are:
1 — On Bar Balance : This is the only balance using instant values; it is simply the subtraction of the Sell volume from the Buy volume on the bar.
2 — Average Balance : Calculates a distinct EMA for both the Buy and Sell volumes, and subtracts the Sell EMA from the Buy EMA.
3 — Momentum Balance : Starts by calculating, separately for both Buy and Sell volumes, the difference between the same EMAs used in "Average Balance" and
an SMA of double the period used for the "Average Balance" EMAs. The difference for the Sell side is subtracted from the difference for the Buy side,
and an RSI of that value is calculated and brought over the −50/+50 scale.
4 — Relative Balance : The reference values used in the calculation are the Buy and Sell EMAs used in the "Average Balance".
From those, we calculate two intermediate values using how much the instant Buy and Sell volumes on the bar exceed their respective EMA — but with a twist.
If the bar's Buy volume does not exceed the EMA of Buy volume, a zero value is used. The same goes for the Sell volume with the EMA of Sell volume.
Once we have our two intermediate values for the Buy and Sell volumes exceeding their respective MA, we subtract them. The final "Relative Balance" value is an ALMA of that subtraction.
The rationale behind using zero values when the bar's Buy/Sell volume does not exceed its EMA is to only take into account the more significant volume.
If both instant volume values exceed their MA, then the difference between the two is the signal's value.
The signal is called "relative" because the intermediate values are the difference between the instant Buy/Sell volumes and their respective MA.
This balance flatlines when the bar's Buy/Sell volumes do not exceed their EMAs, which makes it useful to spot areas where trader interest dwindles, such as consolidations.
The smaller the period of the final value's ALMA, the more easily you will see the balance flatline. These flat zones should be considered no-trade zones.
5 — Percent Balance : This balance is the ALMA of the ratio of the "On Bar Balance" value, i.e., the volume delta balance on the bar (which can be positive or negative),
over the total volume for that bar.
From the balances and marker conditions, two more values are calculated:
1 — Marker Bias : It sums the up/down (+1/‒1) occurrences of the markers 1 to 4 over a period you define, so it ranges from −4 to +4, times the period.
Its calculation will depend on the modes used to calculate markers 3 and 4.
2 — Combined Balances : This is the sum of the bull/bear (+1/−1) states of each of the five balances, so it ranges from −5 to +5.
█ FEATURES
The indicator has two main modes of operation: Columns and Line .
Columns
• In Columns mode you can display stacked Buy/Sell volume columns.
• The buy section always appears above the centerline, the sell section below.
• The top and bottom sections can be colored independently using eight different methods.
• The EMAs of the Buy/Sell values can be displayed (these are the same EMAs used to calculate the "Average Balance").
Line
• Displays one of seven signals: the five balances or one of two complementary values, i.e., the "Marker Bias" or the "Combined Balances".
• You can color the line and its fill using independent calculation modes to pack more information in the display.
You can thus appraise the state of 3 different values using the line itself, its color and the color of its fill.
• A "Divergence Levels" feature will use the line to automatically draw expanding levels on divergence events.
Default settings
Using the indicator's default settings, this is the information displayed:
• The line is calculated on the "Average Balance".
• The line's color is determined by the bull/bear state of the "Percent Balance".
• The line's fill gradient is determined by the advances/declines of the "Momentum Balance".
• The orange divergence dots are calculated using discrepancies between the polarity of the "On Bar Balance" and the chart's bar.
• The divergence levels are determined using the line's level when a divergence occurs.
• The background's fill gradient is calculated on advances/declines of the "Marker Bias".
• The chart bars are colored using advances/declines of the "Relative Balance". Divergences are shown in orange.
• The intrabar timeframe is automatically determined from the chart's timeframe so that a minimum of 50 intrabars are used to calculate volume delta on historical bars.
Alerts
The configuration of the marker conditions explained further is what determines the conditions that will trigger alerts created from this script. Note that simply selecting the display of markers does not create alerts. To create an alert on this script, you must use ALT-A from the chart. You can create multiple alerts triggering on different conditions from this same script; simply configure the markers so they define the trigger conditions for each alert before creating the alert. The configuration of the script's inputs is saved with the alert, so from then on you can change them without affecting the alert. Alert messages will mention the marker(s) that triggered the specific alert event. Keep in mind, when creating alerts on small chart timeframes, that discrepancies between alert triggers and markers displayed on your chart are to be expected. This is because the alert and your chart are running two distinct instances of the indicator on different servers and different feeds. Also keep in mind that while alerts only trigger on confirmed conditions, they are calculated using realtime calculation mode, which entails that if you refresh your chart and elapsed realtime bars recalculate as historical bars using intrabar inspection, markers will not appear in the same places they appeared in realtime. So it's important to understand that even though the alert conditions are confirmed when they trigger, these alerts will repaint.
Let's go through the sections of the script's inputs.
Columns
The size of the Buy/Sell columns always represents their respective importance on the bar, but the coloring mode for tops and bottoms is independent. The default setup uses a standard coloring mode where the Buy/Sell columns are always in the bull/bear color with a higher intensity for the winning side. Seven other coloring modes allow you to pack more information in the columns. When choosing to color the top columns using a bull/bear gradient on "Average Balance", for example, you will have bull/bear colored tops. In order for the color of the bottom columns to continue to show the instant bar balance, you can then choose the "On Bar Balance — Dual Solid Colors" coloring mode to make those bars the color of the winning side for that bar. You can display the averages of the Buy and Sell columns. If you do, its coloring is controlled through the "Line" and "Line fill" sections below.
Line and Line fill
You can select the calculation mode and the thickness of the line, and independent calculations to determine the line's color and fill.
Zero Line
The zero line can display dots when all five balances are bull/bear.
Divergences
You first select the detection mode. Divergences occur whenever the up/down direction of the signal does not match the up/down polarity of the bar. Divergences are used in three components of the indicator's visuals: the orange dot, colored chart bars, and to calculate the divergence levels on the line. The divergence levels are dynamic levels that automatically build from the line's values on divergence events. On consecutive divergences, the levels will expand, creating a channel. This implementation of the divergence levels corresponds to my view that divergences indicate anomalies, hesitations, points of uncertainty if you will. It precludes any attempt to identify a directional bias to divergences. Accordingly, the levels merely take note of divergence events and mark those points in time with levels. Traders then have a reference point from which they can evaluate further movement. The bull/bear/neutral colors used to plot the levels are also congruent with this view in that they are determined by the line's position relative to the levels, which is how I think divergences can be put to the most effective use. One of the coloring modes for the line's fill uses advances/declines in the line after divergence events.
Background
The background can show a bull/bear gradient on six different calculations. As with other gradients, you can adjust its brightness to make its importance proportional to how you use it in your analysis.
Chart bars
Chart bars can be colored using seven different methods. You have the option of emptying the body of bars where volume does not increase, as does my TLD indicator, and you can choose whether you want to show divergences.
Intrabar Timeframe
This is the intrabar timeframe that will be used to calculate volume delta using intrabar inspection on historical bars. You can choose between four modes. The three "Auto-steps" modes calculate, from the chart's timeframe, the intrabar timeframe where the said number of intrabars will make up the dilation of chart bars. Adjustments are made for non-24x7 markets. "Fixed" mode allows you to select the intrabar timeframe you want. Checking the "Show TF" box will display in the lower-right corner the intrabar timeframe used at any given moment. The proper selection of the intrabar timeframe is important. It must achieve maximal granularity to produce precise results while not unduly slowing down calculations, or worse, causing runtime errors. Note that historical depth will vary with the intrabar timeframe. The smaller the timeframe, the shallower historical plots you will be.
Markers
Markers appear when the required condition has been confirmed on a closed bar. The configuration of the markers when you create an alert is what determines when the alert will trigger. Five markers are available:
• Balances Agreement : All five balances are either bullish or bearish.
• Double Bumps : A double bump is two consecutive up/down bars with +/‒ volume delta, and rising Buy/Sell volume above its average.
• Divergence confirmations : A divergence is confirmed up/down when the chosen balance is up/down on the previous bar when that bar was down/up, and this bar is up/down.
• Balance Shifts : These are bull/bear transitions of the selected signal.
• Marker Bias Shifts : Marker bias shifts occur when it crosses into bull/bear territory.
Periods
Allows control over the periods of the different moving averages used to calculate the balances.
Volume Discrepancies
Stock exchanges do not report the same volume for intraday and daily (or higher) resolutions. Other variations in how volume information is reported can also occur in other markets, namely Forex, where volume irregularities can even occur between different intraday timeframes. This will cause discrepancies between the total volume on the bar at the chart's timeframe, and the total volume calculated by adding the volume of the intrabars in that bar's dilation. This does not necessarily invalidate the volume delta information calculated from intrabars, but it tells us that we are using partial volume data. A mechanism to detect chart vs intrabar timeframe volume discrepancies is provided. It allows you to define a threshold percentage above which the background will indicate a difference has been detected.
Other Settings
You can control here the display of the gray dot reminder on realtime bars, and the display of error messages if you are using a chart timeframe that is not greater than the fixed intrabar timeframe, when you use that mode. Disabling the message can be useful if you only use realtime mode at chart timeframes that do not support intrabar inspection.
█ RAMBLINGS
On Volume Delta
Volume is arguably the best complement to interpret price action, and I consider volume delta to be the most effective way of processing volume information. In periods of low-volatility price consolidations, volume will typically also be lower than normal, but slight imbalances in the trend of the buy/sell volume balance can sometimes help put early odds on the direction of the break from consolidation. Additionally, the progression of the volume imbalance can help determine the proximity of the breakout. I also find volume delta and the number of divergences very useful to evaluate the strength of trends. In trends, I am looking for "slow and steady", i.e., relatively low volatility and pauses where price action doesn't look like world affairs are being reassessed. In my personal mythology, this type of trend is often more resilient than high-volatility breakouts, especially when volume balance confirms the general agreement of traders signaled by the low-volatility usually accompanying this type of trend. The volume action on pauses will often help me decide between aggressively taking profits, tightening a stop or going for a longer-term movement. As for reversals, they generally occur in high-volatility areas where entering trades is more expensive and riskier. While the identification of counter-trend reversals fascinates many traders to no end, they represent poor opportunities in my view. Volume imbalances often precede reversals, but I prefer to use volume delta information to identify the areas following reversals where I can confirm them and make relatively low-cost entries with better odds.
On "Buy/Sell" Volume
Buying or selling volume are misnomers, as every unit of volume transacted is both bought and sold by two different traders. While this does not keep me from using the terms, there is no such thing as “buy only” or “sell only” volume. Trader lingo is riddled with peculiarities.
Divergences
The divergence detection method used here relies on a difference between the direction of a signal and the polarity (up/down) of a chart bar. When using the default "On Bar Balance" to detect divergences, however, only the bar's volume delta is used. You may wonder how there can be divergences between buying/selling volume information and price movement on one bar. This will sometimes be due to the calculation's shortcomings, but divergences may also occur in instances where because of order book structure, it takes less volume to increase the price of an asset than it takes to decrease it. As usual, divergences are points of interest because they reveal imbalances, which may or may not become turning points. To your pattern-hungry brain, the divergences displayed by this indicator will — as they do on other indicators — appear to often indicate turnarounds. My opinion is that reality is generally quite sobering and I have no reliable information that would tend to prove otherwise. Exercise caution when using them. Consequently, I do not share the overwhelming enthusiasm of traders in identifying bullish/bearish divergences. For me, the best course of action when a divergence occurs is to wait and see what happens from there. That is the rationale underlying how my divergence levels work; they take note of a signal's level when a divergence occurs, and it's the signal's behavior from that point on that determines if the post-divergence action is bullish/bearish.
Superfluity
In "The Bed of Procrustes", Nassim Nicholas Taleb writes: To bankrupt a fool, give him information . This indicator can display lots of information. While learning to use a new indicator inevitably requires an adaptation period where we put it through its paces and try out all its options, once you have become used to it and decide to adopt it, rigorously eliminate the components you don't use and configure the remaining ones so their visual prominence reflects their relative importance in your analysis. I tried to provide flexible options for traders to control this indicator's visuals for that exact reason — not for window dressing.
█ LIMITATIONS
• This script uses a special characteristic of the `security()` function allowing the inspection of intrabars — which is not officially supported by TradingView.
It has the advantage of permitting a more robust calculation of volume delta than other methods on historical bars, but also has its limits.
• Intrabar inspection only works on some chart timeframes: 3, 5, 10, 15 and 30 minutes, 1, 2, 3, 4, 6, and 12 hours, 1 day, 1 week and 1 month.
The script’s code can be modified to run on other resolutions.
• When the difference between the chart’s timeframe and the intrabar timeframe is too great, runtime errors will occur. The Auto-Steps selection mechanisms should avoid this.
• All volume is not created equally. Its source, components, quality and reliability will vary considerably with sectors and instruments.
The higher the quality, the more reliably volume delta information can be used to guide your decisions.
You should make it your responsibility to understand the volume information provided in the data feeds you use. It will help you make the most of volume delta.
█ NOTES
For traders
• The Data Window shows key values for the indicator.
• While this indicator displays some of the same information calculated in my Delta Volume Columns ,
I have elected to make it a separate publication so that traders continue to have a simpler alternative available to them. Both code bases will continue to evolve separately.
• All gradients used in this indicator determine their brightness intensities using advances/declines in the signal—not their relative position in a pre-determined scale.
• Volume delta being relative, by nature, it is particularly well-suited to Forex markets, as it filters out quite elegantly the cyclical volume data characterizing the sector.
If you are interested in volume delta, consider having a look at my other "Delta Volume" indicators:
• Delta Volume Realtime Action displays realtime volume delta and tick information on the chart.
• Delta Volume Candles builds volume delta candles on the chart.
• Delta Volume Columns is a simpler version of this indicator.
For coders
• I use the `f_c_gradientRelativePro()` from the PineCoders Color Gradient Framework to build my gradients.
This function has the advantage of allowing begin/end colors for both the bull and bear colors. It also allows us to define the number of steps allowed for each gradient.
I use this to modulate the gradients so they perform optimally on the combination of the signal used to calculate advances/declines,
but also the nature of the visual component the gradient applies to. I use fewer steps for choppy signals and when the gradient is used on discrete visual components
such as volume columns or chart bars.
• I use the PineCoders Coding Conventions for Pine to write my scripts.
• I used functions modified from the PineCoders MTF Selection Framework for the selection of timeframes.
█ THANKS TO:
— The devs from TradingView's Pine and other teams, and the PineCoders who collaborate with them. They are doing amazing work,
and much of what this indicator does could not be done without their recent improvements to Pine.
— A guy called Kuan who commented on a Backtest Rookies presentation of their Volume Profile indicator using a `for` loop.
This indicator started from the intrabar inspection technique illustrated in Kuan's snippet.
— theheirophant , my partner in the exploration of the sometimes weird abysses of `security()`’s behavior at intrabar timeframes.
— midtownsk8rguy , my brilliant companion in mining the depths of Pine graphics.

DateTimeLibrary with enums that can be used as script inputs to allow users to set their preferred date and/or time formats. The user-selected formats can be passed to the library functions (which use 𝚜𝚝𝚛.𝚏𝚘𝚛𝚖𝚊𝚝_𝚝𝚒𝚖𝚎() under the hood) to get formatted date and time strings from a UNIX time.
PREFACE
The target audience of this publication is users creating their own indicators/strategies.
Sometimes a date and/or time needs to be displayed to the user. As a Pine Coder, it is natural to focus our initial attention on the primary calculations or functions of a script, which can lead to the display format of dates and times being an afterthought. While it may not be crucial for the main use case of a script, increased customizability can help push indicators/strategies to the next level in the eyes of the user.
The purpose of this library is to provide an easy-to-use mechanism for allowing script users to choose the formats of dates and times that are displayed to them. Not only is this helpful for users from around the world who may be accustomed to different date/time formats, but it also makes it easier for the script author because it offloads the date/time formatting decision from the author to the user.
HOW TO USE
Step 1
Import the library. Replace with the latest available version number for this library.
//@version=6
indicator("Example")
import n00btraders/DateTime/ as dt
Step 2
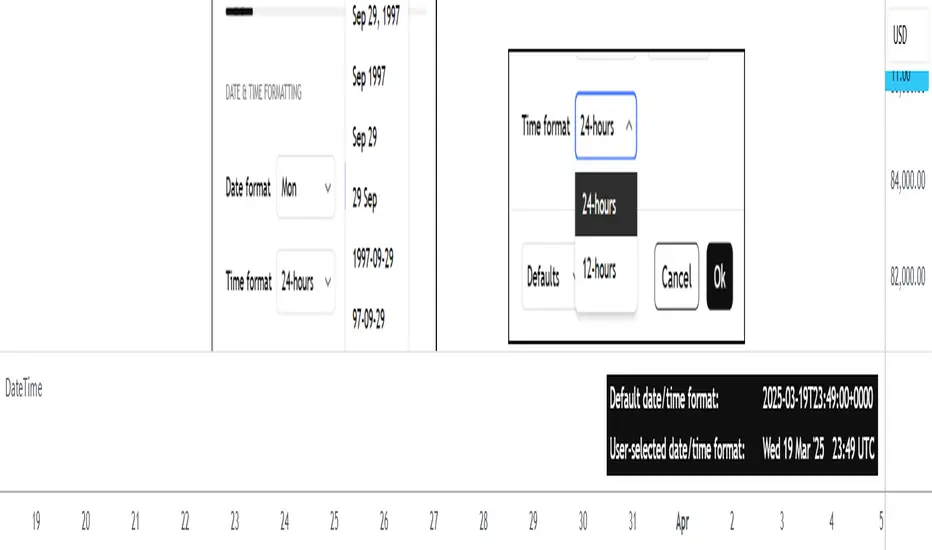
Select a date format and/or time format enum to be used as an input.
dateFormatInput = input.enum(dt.DateFormat.FORMAT_3, "Date format")
timeFormatInput = input.enum(dt.TimeFormat.TWENTY_FOUR_HOURS, "Time hours format")
Step 3
Pass the user's selection as the `format` parameter in the formatting functions from this library. The `timestamp` & `timezone` parameters can be any value that would otherwise be used in 𝚜𝚝𝚛.𝚏𝚘𝚛𝚖𝚊𝚝_𝚝𝚒𝚖𝚎(𝚝𝚒𝚖𝚎, 𝚏𝚘𝚛𝚖𝚊𝚝, 𝚝𝚒𝚖𝚎𝚣𝚘𝚗𝚎).
string formattedDate = dt.formatDate(timestamp, dateFormatInput, timezone)
string formattedTime = dt.formatTime(timestamp, timeFormatInput, timezone)
LIMITATIONS
The library's ease-of-use comes at a few costs:
Fixed date/time formats.
Using the library's pre-defined date & time formats means that additional custom formats cannot be utilized. For example, this library does not include seconds or fractional seconds in formatted time strings. If a script's use case requires displaying the 'seconds' from a time of day, then 𝚜𝚝𝚛.𝚏𝚘𝚛𝚖𝚊𝚝_𝚝𝚒𝚖𝚎() must be used directly.
Fixed time zone offset format.
The `formatTime()` function of this library can optionally add the time zone offset at the end of the time string, but the format of the offset cannot be specified. Note: if the default format for time zone offset is not sufficient, the Timezone library can be imported directly to get the time zone offset string in a preferred format.
ADVANTAGES
There are benefits to utilizing this library instead of directly using 𝚜𝚝𝚛.𝚏𝚘𝚛𝚖𝚊𝚝_𝚝𝚒𝚖𝚎():
Easy to use from the user's perspective.
The date & time format enums provide a similar look and feel to the "Date format" and "Time hours format" options that already exist in the TradingView chart settings.
Easy to use from the author's perspective.
The exported functions from this library are modeled to behave similarly to the 𝚜𝚝𝚛.𝚏𝚘𝚛𝚖𝚊𝚝_𝚝𝚒𝚖𝚎(𝚝𝚒𝚖𝚎, 𝚏𝚘𝚛𝚖𝚊𝚝, 𝚝𝚒𝚖𝚎𝚣𝚘𝚗𝚎) built-in function from Pine Script.
Format quarter of the year.
The date formatting function from this library can display a fiscal quarter if it's included in the user-selected format. This is currently not possible with the built-in 𝚜𝚝𝚛.𝚏𝚘𝚛𝚖𝚊𝚝_𝚝𝚒𝚖𝚎().
EXPORTED ENUM TYPES
This section will list the available date/time formats that can be used as a script input. Each enum type has a detailed //@𝚏𝚞𝚗𝚌𝚝𝚒𝚘𝚗 description in the source code to help determine the best choice for your scripts.
Date Format Enums:
𝙳𝚊𝚝𝚎𝙵𝚘𝚛𝚖𝚊𝚝
𝙳𝚊𝚝𝚎𝙵𝚘𝚛𝚖𝚊𝚝𝙳𝚊𝚢𝙾𝚏𝚆𝚎𝚎𝚔𝙰𝚋𝚋𝚛
𝙳𝚊𝚝𝚎𝙵𝚘𝚛𝚖𝚊𝚝𝙳𝚊𝚢𝙾𝚏𝚆𝚎𝚎𝚔𝙵𝚞𝚕𝚕
𝙲𝚞𝚜𝚝𝚘𝚖𝙳𝚊𝚝𝚎𝙵𝚘𝚛𝚖𝚊𝚝
Supporting Date Enums:
𝙳𝚊𝚝𝚎𝙿𝚛𝚎𝚏𝚒𝚡
Time Format Enums:
𝚃𝚒𝚖𝚎𝙵𝚘𝚛𝚖𝚊𝚝
Supporting Time Enums:
𝚃𝚒𝚖𝚎𝙰𝚋𝚋𝚛𝚎𝚟𝚒𝚊𝚝𝚒𝚘𝚗
𝚃𝚒𝚖𝚎𝚂𝚎𝚙𝚊𝚛𝚊𝚝𝚘𝚛
𝚃𝚒𝚖𝚎𝙿𝚘𝚜𝚝𝚏𝚒𝚡
Note: all exported enums have custom titles for each field. This means that the supporting enums could also be exposed to the end-user as script inputs if necessary. The supporting enums are used as optional parameters in this library's formatting functions to allow further customizability.
EXPORTED FUNCTIONS
formatDate(timestamp, format, timezone, prefix, trim)
Converts a UNIX time into a date string formatted according to the selected `format`.
Parameters:
timestamp (series int) : A UNIX time.
format (series DateFormat) : A date format.
timezone (series string) : A UTC/GMT offset or IANA time zone identifier.
prefix (series DatePrefix) : Optional day of week prefix.
trim (series bool) : Optional truncation of numeric month / day.
Returns: Calendar date string using the selected format.
⸻⸻⸻⸻⸻⸻⸻⸻
Required parameters: `timestamp`, `format`.
Note: there is a version of this function for each Date Format enum type. The only difference is the type of the `format` parameter.
Tip: hover over the `formatDate()` function in the Pine Editor to display useful details:
Function description
Parameter descriptions + default values
Example function usage
formatTime(timestamp, format, timezone, trim, separator, postfix, space, offset)
Converts a UNIX time into a formatted time string using the 24-hour clock or 12-hour clock.
Parameters:
timestamp (series int) : A UNIX time.
format (series TimeFormat) : A time format.
timezone (series string) : A UTC/GMT offset or IANA time zone identifier.
trim (series TimeAbbreviation) : Optional truncation of the hour and minute portion.
separator (series TimeSeparator) : Optional time separator.
postfix (series TimePostfix) : Optional format for the AM/PM postfix.
space (series bool) : Optional space between the time and the postfix.
offset (series bool) : Optional UTC offset as a suffix.
Returns: Time of day string using the selected format.
⸻⸻⸻⸻⸻⸻⸻⸻
Required parameters: `timestamp`, `format`.
Note: the `trim`, `postfix`, and `space` optional parameters are not applicable and will be ignored when using the 24-hour clock (`format` = TimeFormat.TWENTY_FOUR_HOURS).
Tip: hover over the `formatTime()` function in the Pine Editor to display useful details:
Function description
Parameter descriptions + default values
Example function usage
Example outputs for combinations of TimeFormat.* enum values & optional parameters
NOTES
This library can be used in conjunction with the Timezone library to increase the usability of scripts that can benefit from allowing the user to input their preferred time zone.
Credits to HoanGhetti for publishing an informative Markdown resource which I referenced to create the formatted function descriptions that pop up when hovering over `formatDate()` and `formatTime()` function calls in the Pine Editor.
Session Bar/Candle ColoringChange the color of candles within a user-defined trading session. Borders and wicks can be changed as well, not just the body color.
PREFACE
This script can be used an educational resource for those who are interested in learning Pine Script. Therefore, the script is published open source and is organized in a manner that follows the recommended Style Guide .
While the main premise of the indicator is rather simple, the script showcases various things that can be achieved such as conditional plotting, alignment of indicator settings, user input validation, script optimization, and more. The script also has examples of taking into consideration the chart timeframe and/or different chart types (Heikin Ashi, Renko, etc.) that a user might be running it on. Note: for complete beginners, I strongly suggest going through the Pine Script User Manual (possibly more than once).
FEATURES
Besides being able to select a specific time window, the indicator also provides additional color settings for changing the background color or changing the colors of neutral/indecisive candles, as shown in the image below.
This allows for a higher level of customization beyond the TradingView chart settings or other similar scripts that are currently available.
HOW TO USE
First, define the intraday trading session that will contain the candles to modify. The session can be limited to specific days of the week.
Next, select the parts of the candles that should be modified: Body, Borders, Wick, and/or Background.
For each of the candle parts that were enabled, you can select the colors that will be used depending on whether a candle is bullish (⇧), bearish (⇩), or neutral (⇆).
All other indicator settings will have a detailed tooltip to describe its usage and/or effect.
LIMITATIONS
The indicator is not intended to function on Daily or higher timeframes due to the intraday nature of session time windows.
The indicator cannot always automatically detect the chart type being used, therefore the user is requested to manually input the chart type via the " Chart Style " setting.
Depending on the available historical data and the selected choice for the " Portion of bar in session " setting, the indicator may not be able to update very old candles on the chart.
EXAMPLE USAGE
This section will show examples of different scenarios that the indicator can be used for.
Emphasizing a main trading session.
Defining a "Pre/post market hours background" like is available for some symbols (e.g., NASDAQ:AAPL ).
Highlighting in which bar the midnight candle occurs.
Hiding indecision bars (neutral candles).
Showing only "Regular Trading Hours" for a chart that does not have the option to toggle ETH/RTH. To achieve this, the actual chart data is hidden, and only the indicator is visible; alternatively, a 2nd instance of the indicator could change colors to match the chart background.
Using a combination of Bars and Japanese Candlesticks. Alternatively, this could be done by hiding the main chart data and using 2 instances of the indicator (one with " Chart Style " setting as Bars , and the other set to Candles ).
Using a combination of thin and thick bars on Range charts. Note: requires disabling the "Thin Bars" setting for Bar charts in the TradingView chart settings.
NOTES
If using more than one instance of this indicator on the same chart, you can use the TradingView "Save Indicator Template" feature to avoid having to re-configure the multiple indicators at a later time.
This indicator is intended to work "out-of-the-box" thanks to the behind_chart option introduced to Pine Script in October 2024. But you can always manually bring the indicator to the front just in case the color changes are not being seen (using the "More" option in the indicator status line: More > Visual Order > Bring to front ).
Many thanks to fikira for their help and inspiring me to create open source scripts.
Any feedback including bug reports or suggestions for improving the indicator (or source code itself) are always welcome in the comments section.

MTFT Patterns Noob, TheStrat Suite (1of5)Multi Time Frame Tools
Multi Time Frame Tools (MTFT) is a suite of scripts aimed to establish a standard timeframe-based color scheme. This can be utilized to overlay different timeframes calculations/values over a single timeframe. As one example, this would allow to observe the 5-month moving average, 5-week moving average, and 5-day moving average overlaid over each other. This would allow to study a chart, get accustomed to the color scheme and study all these at the same time much easier.
All indicators calculated using the below specific timeframes as input, will always use the color scheme outlined below. This is to get you in habit of recognizing the different timeframes overlaid in top of each other. These can be personalized.
Longer TF analysis.
Yearly - Black
Semi-Annual - Yellow
Quarterly - White
Monthly - Maroon
Weekly - Royal Blue
Daily - Lime
Shorter TF analysis.
4 hour - Fuchsia
1 hour - Orange
30 min - Red
15 min - Brown
10 min - Purple
5 min - Lilac
All color coordination is able to be modified in either the “Inputs” or “Style” section. If you need to make changes, make sure to select “Save as Default” on the bottom right of the settings menu.
Recommended Chart Color Layout
I played around with color coordination a lot. The final product was what worked best for me. I personally use the following chart settings to accent all available TF colors.
-> Click on the settings wheel on your chart. -> Click on “Appearance”.
Background - Solid -> On the top row pick the 6th color from the left.
Vert Grid Lines and Horz Grid Lines -> On the top row pick the 7th color from the left.
You may of course change these and the indicator line colors as you like.
Adding indicator to Chart
-> Open the TradingView “Indicators & Strategies” library, the icon has “ƒx”. -> All premium scripts will be located under “Invite-Only Scripts” -> Click indicator to add to your chart.
MTFT TheStrat Suite (5 Scripts)
Rob Smith is the creator of ‘TheStrat’ trading strategy. For ‘TheStrat’ I have put together a suite of 5 premium scripts that combined will offer people interested in learning ‘TheStrat’ a cleaner learning process. For 2 of the 5 scripts specifically, the MTFT approach of overlaying multiple longer timeframes(TF) over a shorter TF selected as a display cannot be utilized. The other 2 scripts will have full MTFT functionality and they are my personal favorite. I will be providing very basic info to utilize this script; it is up to you to dive deep into learning this strategy. I am not an expert with the tool or a financial advisor. As with all aspects of life, I recommend you research, learn, discern and practice extensively in order to become a master.
*1. MTFT Patterns Pro/Noob
2. MTFT Full Time Frame Continuity Table
3. MTFT Last HML wOpen
4. MTFT Actionable Signal Targets
5. MTFT Reversal Lines
MTFT Patterns Pro/Noob, TheStrat Suite (1of5)
Features includes:
1.) Absolute Truth #. This setting will provide the candlesticks absolute truth # below the CS.
2.) Color bars based on Absolute Truth. This setting will color all inside candlesticks yellow, all Green Outside Candlesticks White and all Red Outside Candlesticks Fuchsia. Scenario 2 candlesticks are left as is and will color based on the color of the original candlestick. This setting is default enabled and needs to be disabled in the “Style” tab under the indicator settings wheel. I found this more practical in getting used to the 3 absolute truth scenarios.
3.) Reversals. This setting will mark when reversal patterns as discussed by Rob are posted. Noob version will also include the description of the reversal pattern, while the Pro version will only plot an ‘R’ without the text description. Note: There should never be back-to-back green Rs or red Rs. I found this issue a lot on many of the other ‘TheStrat’ scripts out there. TradingView development team note: The plotchar function does not allow dynamic text so this is the only reason on why there needs to be two separate versions of the script. ‘Pro’ is important for experienced users that already identify the patterns without the text and ‘Noob’ is important for beginner users that still need the text description of the pattern.
4. Continuations. This setting will mark when continuation patterns as discussed by Rob are posted. Noob version will also include the description of the continuation pattern, while the Pro version will only plot a ‘C’ without the text description.
TradingView Admin note: The plotchar function does not allow dynamic text so this is the only reason why there needs to be two separate versions of the script. ‘Pro’ is important for experienced users that already identify the patterns without the text and ‘Noob’ is important for beginner users that still need the text description of the pattern.
5. Actionable Signals and Complex Actionable Signals (CAS). This has several objective parameters as defined by Rob’s course. ‘Complex Actionable Signals’ is a name I used when speaking of actionable signals that require a combination of 2 or more candlesticks.
Actionable Signals.
• All inside candlesticks(Absolute Truth #1)
• Hammers
• Shooting Stars
Complex Actionable Signals.
• (Absolute Truth Combo 1-3-1 )Inside Outside Inside
• Outside -> Hammer
• Outside -> Shooting Star
• Inside -> Hammer
• Inside -> Shooting Star
• Momentum Inside
• Momentum Hammer
• Momentum Shooting Star
• Hammer -> Shooting Star
• Shooting Star -> Hammer
5a. Example CAS 1-3G-1. I am including only one example of several of the CAS that are included in this script. The star is utilized for all CAS, the color and location designate the direction that the CAS would have you act on. Note the “Entry” and “Target” line were added manually and are not part of the script. This is one successful setup; don’t get excited thinking this is how it always works. I will let you discover and learn for yourself that there is many failed setups and many setups that never trigger the actionable signal. This is where setting alerts is very handy.
6. Alerts. Press on the “Create Alert” Icon for TradingView. When the prompt opens select the preferred script either “TheStrat Pro” or “TheStrat Noob” under “Condition” and then under the sub-menu select any of the following scenarios.
• C ▲/ ▼ = If the active CS shows a continuation up/down pattern, remember this CS is active and can still change direction and trigger a reversal in the other direction.
• R ▲/▼ = If the active CS shows a reversal up/down pattern, remember this CS is active and can still change direction and trigger a continuation in the previous trend direction.
• HM Trigger(Last High Cross) = Alert when the active CS breaks the high of the previous CS. As a new CS opens, it re-adjusts its values and is just constantly waiting for the active CS break through the previous CS high.
• SS Trigger(Last Low Cross) = Alert when the active CS breaks the low of the previous CS. As a new CS opens, it re-adjusts its values and is just constantly waiting for the active CS break through the previous CS low.
• Inside Trigger (Last High/Low Cross) = Alert when the active CS breaks the low or the high of the previous CS. As a new CS opens, it re-adjusts its values and is just constantly waiting for the active CS break through either the previous CS low or the high.
• Last CS Inside
• Last CS H
• Last CS S
• Last CS Actionable Signal (inside, H or S)
• Last CS Complex Actionable Signal
• Last CS Any Actionable Signal

MTFT Patterns Pro, TheStrat Suite (1of5)Multi Time Frame Tools
Multi Time Frame Tools (MTFT) is a suite of scripts aimed to establish a standard timeframe-based color scheme. This can be utilized to overlay different timeframes calculations/values over a single timeframe. As one example, this would allow to observe the 5-month moving average, 5-week moving average, and 5-day moving average overlaid over each other. This would allow to study a chart, get accustomed to the color scheme and study all these at the same time much easier.
All indicators calculated using the below specific timeframes as input, will always use the color scheme outlined below. This is to get you in habit of recognizing the different timeframes overlaid in top of each other. These can be personalized.
Longer TF analysis.
Yearly - Black
Semi-Annual - Yellow
Quarterly - White
Monthly - Maroon
Weekly - Royal Blue
Daily - Lime
Shorter TF analysis.
4 hour - Fuchsia
1 hour - Orange
30 min - Red
15 min - Brown
10 min - Purple
5 min - Lilac
All color coordination is able to be modified in either the “Inputs” or “Style” section. If you need to make changes, make sure to select “Save as Default” on the bottom right of the settings menu.
Recommended Chart Color Layout
I played around with color coordination a lot. The final product was what worked best for me. I personally use the following chart settings to accent all available TF colors.
-> Click on the settings wheel on your chart. -> Click on “Appearance”.
Background - Solid -> On the top row pick the 6th color from the left.
Vert Grid Lines and Horz Grid Lines -> On the top row pick the 7th color from the left.
You may of course change these and the indicator line colors as you like.
Adding indicator to Chart
-> Open the TradingView “Indicators & Strategies” library, the icon has “ƒx”. -> All premium scripts will be located under “Invite-Only Scripts” -> Click indicator to add to your chart.
MTFT TheStrat Suite (5 Scripts)
Rob Smith is the creator of ‘TheStrat’ trading strategy. For ‘TheStrat’ I have put together a suite of 5 premium scripts that combined will offer people interested in learning ‘TheStrat’ a cleaner learning process. For 2 of the 5 scripts specifically, the MTFT approach of overlaying multiple longer timeframes(TF) over a shorter TF selected as a display cannot be utilized. The other 2 scripts will have full MTFT functionality and they are my personal favorite. I will be providing very basic info to utilize this script; it is up to you to dive deep into learning this strategy. I am not an expert with the tool or a financial advisor. As with all aspects of life, I recommend you research, learn, discern and practice extensively in order to become a master.
*1. MTFT Patterns Pro/Noob
2. MTFT Full Time Frame Continuity Table
3. MTFT Last HML wOpen
4. MTFT Actionable Signal Targets
5. MTFT Reversal Lines
MTFT Patterns Pro/Noob, TheStrat Suite (1of5)
Features includes:
1.) Absolute Truth #. This setting will provide the candlesticks absolute truth # below the CS.
2.) Color bars based on Absolute Truth. This setting will color all inside candlesticks yellow, all Green Outside Candlesticks White and all Red Outside Candlesticks Fuchsia. Scenario 2 candlesticks are left as is and will color based on the color of the original candlestick. This setting is default enabled and needs to be disabled in the “Style” tab under the indicator settings wheel. I found this more practical in getting used to the 3 absolute truth scenarios.
3.) Reversals. This setting will mark when reversal patterns as discussed by Rob are posted. Noob version will also include the description of the reversal pattern, while the Pro version will only plot an ‘R’ without the text description. Note: There should never be back-to-back green Rs or red Rs. I found this issue a lot on many of the other ‘TheStrat’ scripts out there. TradingView development team note: The plotchar function does not allow dynamic text so this is the only reason on why there needs to be two separate versions of the script. ‘Pro’ is important for experienced users that already identify the patterns without the text and ‘Noob’ is important for beginner users that still need the text description of the pattern.
4. Continuations. This setting will mark when continuation patterns as discussed by Rob are posted. Noob version will also include the description of the continuation pattern, while the Pro version will only plot a ‘C’ without the text description.
TradingView Admin note: The plotchar function does not allow dynamic text so this is the only reason why there needs to be two separate versions of the script. ‘Pro’ is important for experienced users that already identify the patterns without the text and ‘Noob’ is important for beginner users that still need the text description of the pattern.
5. Actionable Signals and Complex Actionable Signals (CAS). This has several objective parameters as defined by Rob’s course. ‘Complex Actionable Signals’ is a name I used when speaking of actionable signals that require a combination of 2 or more candlesticks.
Actionable Signals.
• All inside candlesticks(Absolute Truth #1)
• Hammers
• Shooting Stars
Complex Actionable Signals.
• (Absolute Truth Combo 1-3-1 )Inside Outside Inside
• Outside -> Hammer
• Outside -> Shooting Star
• Inside -> Hammer
• Inside -> Shooting Star
• Momentum Inside
• Momentum Hammer
• Momentum Shooting Star
• Hammer -> Shooting Star
• Shooting Star -> Hammer
5a. Example CAS 1-3G-1. I am including only one example of several of the CAS that are included in this script. The star is utilized for all CAS, the color and location designate the direction that the CAS would have you act on. Note the “Entry” and “Target” line were added manually and are not part of the script. This is one successful setup; don’t get excited thinking this is how it always works. I will let you discover and learn for yourself that there is many failed setups and many setups that never trigger the actionable signal. This is where setting alerts is very handy.
6. Alerts. Press on the “Create Alert” Icon for TradingView. When the prompt opens select the preferred script either “TheStrat Pro” or “TheStrat Noob” under “Condition” and then under the sub-menu select any of the following scenarios.
• C ▲/ ▼ = If the active CS shows a continuation up/down pattern, remember this CS is active and can still change direction and trigger a reversal in the other direction.
• R ▲/▼ = If the active CS shows a reversal up/down pattern, remember this CS is active and can still change direction and trigger a continuation in the previous trend direction.
• HM Trigger(Last High Cross) = Alert when the active CS breaks the high of the previous CS. As a new CS opens, it re-adjusts its values and is just constantly waiting for the active CS break through the previous CS high.
• SS Trigger(Last Low Cross) = Alert when the active CS breaks the low of the previous CS. As a new CS opens, it re-adjusts its values and is just constantly waiting for the active CS break through the previous CS low.
• Inside Trigger (Last High/Low Cross) = Alert when the active CS breaks the low or the high of the previous CS. As a new CS opens, it re-adjusts its values and is just constantly waiting for the active CS break through either the previous CS low or the high.
• Last CS Inside
• Last CS H
• Last CS S
• Last CS Actionable Signal (inside, H or S)
• Last CS Complex Actionable Signal
• Last CS Any Actionable Signal
PriceCatch-SubPriceCatch Trading System consists of two scripts. PriceCatch-Main and PriceCatch-Sub.
This is a long trades (buy trades) only system. No short signals are included in this system.
PriceCatch-Sub is a helper script that works in conjunction with the main script and is plotted on a separate pane.
This script plots Heikin-Ashi Candles on the Chart. By observing the price action on the main script and comparing the same with the Heikin-Ashi Candles plotted on the bottom pane, buy trades are taken. This script helps traders to enter, manage and exit trades as it removes noise generally associated with Japanese candles and should be used along with main script.
When the main script signals that an upward price movement is probable, then the Heikin-Ashi candles are observed and buy trades are initiated only when both the scripts give confirmation signals.
While using this script and before initiating a buy trade, Traders must observe for red Heikin-Ashi candles with upper wick that gets rejected at the Macro Wave for an entry signal.
For exits from a trade, Traders must observe the highs of the Heikin-Ashi candles. Whenever the close of current Heikin-Ashi candle is lower than the earlier candle and current high is less than previous high, then prepare for price slow down or slipping down. When the Heikin-Ashi candles begin to close inside the Blue (Macro Wave) buy trades are not taken.
Traders must use PriceCatch-Main along with this helper script PriceCatch-Sub in their trading strategy as they work in tandem to help you identify entries, manage your trades and plan your exits. Remember, that the main script is the one that does the heavy lifting.
The PriceCatch Trading System attempts to hide complexity and presents actionable signals in a clean manner that makes it easy for traders of all levels to understand and benefit from.
This is a comprehensive system and support is provided to help you learn and to use it effectively.
Use the link below or PM us for trial access to this System.
Thank you.

Strength Analyzer [DW]This is an experimental hybrid between relative strength and spectrum analysis methods aimed to deliver useful insights about cyclical dominance and momentum.
This study utilizes a modified RSI formula and a modified Goertzel algorithm to determine relative strength and spectral dominance for periods 8 through 50.
These periods are theorized by many analysts to be the main cyclical components of market movement.
In this study, you are given the option to apply equalization (EQ) to the dataset before estimating strength.
This enables you to transform your data and observe how strength estimates changes as well.
Whether you want to give emphasis to some frequencies, isolate specific bands, or completely alter the shape of your waveform, EQ filtration makes for an interesting experience.
The default EQ preset in this script cuts low end presence, dampens high frequency oscillations, and cleanly passes main cyclic components.
There are many ways to use EQ to transform your dataset, so play around with the settings and find the presets that work best for your analysis setup.
After EQ processing, the data is then passed through the modified RSI algorithm to generate momentum information
The modified RSI in this script is rescaled to oscillate between -1 and 1, and has the option to pass through a 2 pole Butterworth low pass filter before and after processing for a smoother output.
The strength thresholds are determined by the threshold value, which quantifies distance above and below 0.
The threshold value can also be thought of as conventional RSI distance from 50 rescaled so that an increment of 0.1 is equivalent to an increment of 5 on a conventional RSI.
A threshold value of 0.4 is equivalent to thresholds of 70 and 30 on a conventional RSI, so this is the default. The maximum threshold value is 1, which is equivalent to thresholds of 100 and 0.
This script plots colored sections for each period value using a gradient color scheme based on their respective strength estimates.
The color scheme in this script is a multicolored gradient that shows green scaled colors for bullish strength and red scaled colors for bearish strength.
Darker, less vibrant colors indicate lower strength. Brighter, more vibrant colors indicate higher strength.
Strength values near 0 will show the darkest colors, and values near the positive or negative threshold value will show the brightest.
The data is fed parallel through the modified Goertzel algorithm to obtain cyclic power information and to estimate the dominant cycle.
Gerald Goertzel's algorithm is a unique Fourier related transform that identifies tonal properties by quantifying resonance in a set of second order IIR filters with direct-form structure.
It is computationally more efficient than typical DFT or FFT algorithms, and yields decent spectral resolution.
In this variation of the algorithm, data is first passed through a 2 pole high pass filter to attenuate spectral dilation, then passed through a Hamming Window to tidy up the frequency range.
The clean windowed data is then passed through a recursive resonance loop over the frequency block to calculate filter coefficients, which are then used to identify real and imaginary magnitude components.
From there, the magnitude components are used to calculate cyclic power.
The power outputs of each period are then compared for dominant cycle estimation, which is plotted over the gradient.
The dominant cycle can also be optionally smoothed or halved based on your preferences.
Bar colors are included in this script. The color scheme is a gradient based on dominant cycle momentum.
Signals and alert conditions are included in this script as well, and can be customized to your liking.
The two main signal types in this script are:
-> Dominant Cycle - Signals based on dominant cycle or half dominant cycle changes from positive to negative strength or vice versa.
-> Confluence - Signals based on confluence emergence. Based on the majority of measured cycles or all measured cycles showing positive or negative strength.
The signals in this are also externally accessible by other scripts.
The output format is 1 for long signals, and -1 for short signals.
To integrate these signals with your own system, use a source input in your script and assign it to this script's "Direction Signals" output variable from the dropdown tab.
In addition, I included two external output variables that show dominant cycle strength and average cycle strength.
They can be integrated into your own scripts by using a source input and selecting the proper output variable, just like the signals.
The Strength Analyzer is a versatile and powerful analytical tool to have in the arsenal for generating unique insights about momentum and cycle dominance.
By analyzing strength on a spectral basis, we can look at relative price movements on a deeper level and gain insights that aren't necessarily obvious from simply looking at a price chart.
------------------------------------------------
This is a premium script, and access is provided on an invite-only basis.
To gain access, get a copy of the script overview, or for any other inquiries, send me a direct message!
I look forward to hearing from you!
------------------------------------------------
General Disclaimer:
Trading stocks, futures, Forex, options, ETFs, cryptocurrencies or any other financial instrument has large potential rewards, but also large potential risk.
You must be aware of the risks and be willing to accept them in order to invest in stocks, futures, Forex, options, ETFs or cryptocurrencies.
Don’t trade with money you can’t afford to lose.
This is neither a solicitation nor an offer to Buy/Sell stocks, futures, Forex, options, ETFs, cryptocurrencies or any other financial instrument.
No representation is being made that any account will or is likely to achieve profits or losses of any kind.
The past performance of any trading system or methodology is not necessarily indicative of future results.
------------------------------------------------
Note:
Because TV's UI can't handle displaying style options for 43 fills with 42 colors, the color scheme of the analyzer is currently not editable.
However, no other sacrifices to functionality or quality were made in this project.
As the TV team performs updates on the platform, the ability to customize this color scheme will likely come as well.
Also, it's important to note that this script uses a heavy amount of calculations to generate this output.
At times (very infrequently), TV will throw an error message saying "Calculation Takes Too Long", likely due to a momentary lull in available server space.
If you receive this error, simply hide then unhide the indicator, and everything should function as expected.
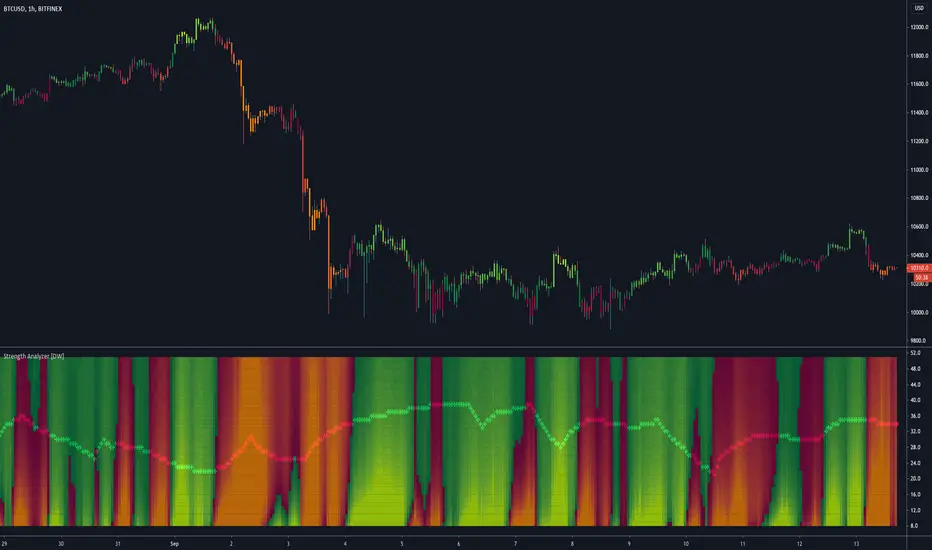
Script Stopwatch - PineCoders FAQ█ WARNING
The publication of our LibraryStopwatch has deprecated this publication.
█ ORIGINAL DESCRIPTION
This script calculates the run time of a Pine script. While its numbers are not very precise and it doesn’t work on all scripts, it will help developers calculate run times more precisely than by hand, and so provides Pine coders with an additional profiling tool to help them optimize their code.
How to use the code
• Place the code included between the up/down arrows after your script’s input() calls.
• Comment out the display modes you don’t want to use.
• Save your script, wait and look at the results.
• Results show in different colors, depending on the average time per bar:
- green for < 5 ms
- dark red for < 50 ms
- bright red for > 50 ms (the maximum allowed is 200).
How the code works
The code in this script starts by saving the value of the timenow variable on the first bar. While the time variable returns the time at the beginning of the bar, timenow returns the current time. The code then follows the progression of timenow during the script’s execution. The variable only updates every second, so in between updates the script makes an estimate of the total time elapsed by adding the last average time per bar calculated to each bar that passes until timenow increases by another 1000 because one more second has elapsed since its last update. At that point a new, current average time per bar is calculated and the cycle repeats.
The code only calculates elapsed time for the initial run. Once the realtime bar is hit, timing stops so that time spent in the realtime bar does not affect the numbers once they have been calculated on the script’s initial pass over the dataset.
Notes
• If results show zero elapsed time, it’s most probably because your script executes in less than one second, which is very good. In that case timenow hasn’t changed, so no timing can be calculated.
• The code is quirky and doesn’t work on all scripts.
• It doesn’t properly time execution of security() calls.
• The average time per bar will sometimes vary quite a bit with changes in chart resolution.
Look first. Then leap.
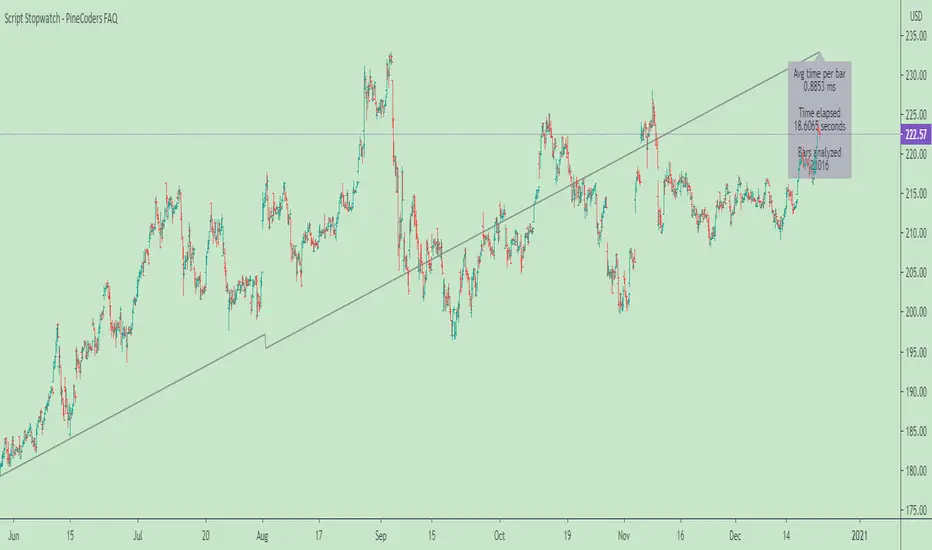
Chanlun ZSLX pen czsc Channel Chan Theory🏆 Chanzhongshuochan (CZSC) ZSLX Recursive Version Indicator - Flagship Edition
Background
A Decade of Craftsmanship, a Major Upgrade
This Chanzhongshuochan (Chan Theory) indicator has undergone nearly 10 years of meticulous refinement and continuous optimization. Since its initial design in 2015, it has been validated through real trading practice. Now, it makes its debut on TradingView with a brand-new upgrade, featuring more comprehensive functions and superior performance.
It truly implements all core theories from the original Chan Theory texts, including a complete system covering candlestick containment processing, fractal identification, pen-segment analysis, pivot zone theory, trading signal (buy/sell point) positioning, and divergence analysis. It serves as a professional and all-encompassing technical analysis tool for Chan Theory enthusiasts in the industry.
🎯 Chinese Translation for User Indicator Interface:
● 顶背离: Top Divergence
● 底背离: Bottom Divergence
● 顶背驰: Top Divergence Including Trend Structure
● 底背驰: Bottom Divergence Including Trend Structure
● 趋势: Trend
● 盘整: Consolidation
● 扩张: Expansion
● 大级别盘整: Higher-Timeframe Consolidation
● 一买: First Buy Signal
● 二买: Second Buy Signal
● 类二买:Quasi-Second Buy Signal
● 三买: Third Buy Signal
● 一卖: First Sell Signal
● 二卖: Second Sell Signal
● 类二卖:Quasi-Second Sell Signal
● 三卖: Third Sell Signal
📦 Parameter Settings
● Number of Candlesticks for Calculation: Up to 5,000 candlesticks. Even free TradingView users are limited to this data volume.
● Pen Detail Parameters: Adjustable options include "Old Pen", "New Pen", "Pen Based on Secondary High/Low", "Pen Based on Absolute High/Low", and "Strict Pen". Select via numerical options corresponding to each type.
● MA (Moving Average) and Bollinger Bands Display Parameters: Check the box to enable display; uncheck to hide (configure as needed).
● Pivot Zone Price & Pen-Segment Price Display: Check the box to enable display; uncheck to hide (configure as needed).
● MACD Parameters: Adjustable according to personal needs (set the periods for fast EMA, slow EMA, and signal line).
● MA Parameters: Default values can be manually adjusted.
● Pen Divergence, Segment Divergence, & Pen-Segment Divergence Display: Check the box to enable display; uncheck to hide (configure as needed).
● Pen-Segment Divergence Alert: Disabled by default. Enable by checking the box. To set up alerts:
a. Go to TradingView’s "Alerts" interface.
b. Under "Condition", select this indicator.
c. Choose "Any alert() function call".
d. Set the notification type, then create the alert to receive notifications.
🔥 Integration of Other Common Indicators & Rationale
● ✅ Moving Average (MA): Chan Theory inherently uses MA overlay for analysis. Adding MA here allows users to analyze price trends from multiple perspectives, making it an essential inclusion.
● ✅ Bollinger Bands: Combining Bollinger Bands (a price channel tool) with Chan Theory provides additional perspectives for trend analysis and improves accuracy, hence its integration.
● ✅ MACD: A 不可或缺 (indispensable) indicator for analyzing trend strength in Chan Theory. It is integrated to facilitate seamless analysis.
● ✅ Rationale for Integrating Shared Core Code between Two Scripts:
The scripts Chanlun ZSLX pen czsc Channel Chan Theory and Chanlun FBFD pen czsc Channel Chan Theory share some underlying code. Here’s why integration is necessary:
○ The core logics of the original Chan Theory — including candlestick containment processing, MACD divergence analysis, candlestick objects, and pen-related calculations — are identical in both scripts.
○ However, significant differences exist in the top-level logics for segment division, trend recursion, display effects, and functions.
○ Additionally, TradingView imposes limits on script code size, making it impossible to fully integrate the two versions’ line-drawing features into one.
○ Therefore, this indicator reuses shared code components, including:
■ The Start_kxian() function (returns candlestick objects),
■ The Start_bi() function (returns pen objects),
■ The showKxianzsfunc() function (draws candlestick-based pivot zones),
■ MACD divergence judgment code.
🎯 Technical Principles
🔥 1. Comprehensive Coverage of Original Chan Theory Functions
● ✅ Real-Time Candlestick Containment Processing – Intelligent Recognition of Containment Relationships
○ In uptrends: Select the higher high and higher low values (prioritize higher extremes).
○ In downtrends: Select the lower high and lower low values (prioritize lower extremes).
● ✅ Accurate Fractal Marking – Automatic Identification of Top/Bottom Fractals
○ When the "Old/New Pen" parameter is set to 2, the high/low points of each top/bottom fractal are plotted.
○ Top Fractal: Among three consecutive candlesticks, the middle candlestick has a higher high and a higher low than the adjacent two.
○ Bottom Fractal: Among three consecutive candlesticks, the middle candlestick has a lower low and a lower high than the adjacent two.
● ✅ Multi-Dimensional Pen-Segment Analysis – Complete System for Pens & Segments
○ Pens:
■ Old Pen: Strictly follows the traditional Chan Theory definition of "pen".
■ New Pen: Adheres to the more flexible "new pen" definition from the original Chan Theory.
■ Fractal Pen: Forms a pen directly from top/bottom fractals (responds to price changes; many peers misclassify this as a "sub-timeframe pen").
○ Segments: This version adopts a recursive logic. While some single pens are treated as segments (differing from pure segment division), most segment-drawing results align with standard methods — the core difference lies in the line-drawing logic.
● ✅ Multi-Level Pivot Zone Integration – Candlestick-, Pen-, & Segment-Based Pivot Zones
○ Candlestick Pivot Zone: The smallest-level pivot zone in Chan Theory.
○ Pen Pivot Zone: Follows the original Chan Theory for division — the zone’s high is the lowest high of overlapping pens; the zone’s low is the highest low of overlapping pens.
○ Segment Pivot Zone: Follows the original Chan Theory for division — the zone’s high is the lowest high of overlapping segments; the zone’s low is the highest low of overlapping segments.
● ✅ Intelligent Trading Signals – Accurate Positioning of Three Types of Buy/Sell Points
○ Type 1 Buy/Sell Signal
■ Principle: Based on Chan Theory’s "trend divergence" — momentum weakens when a trend structure forms.
■ Analysis Method: Identify bottom divergence (for buys) or top divergence (for sells) in the final pivot zone of a trend structure.
■ Application: For reference only. Comprehensive analysis requires combining momentum decay across multiple timeframes.
○ Type 2 Buy/Sell Signal
■ Principle: The first pullback low (for buys) or rebound high (for sells) after a Type 1 signal concludes.
■ Analysis Method: After a Type 1 structure forms, prices may occasionally break previous lows/highs.
■ Application: For reference only. Comprehensive analysis requires combining momentum decay across multiple timeframes.
○ Type 3 Buy/Sell Signal
■ Principle: A standard Type 3 buy signal occurs when prices break above the first pivot zone after a Type 1 buy, then pull back to test the zone. For ease of monitoring, all "breakout + pullback" patterns are marked as Type 3 signals here.
■ Identification Method: Beginners are advised to trade standard Type 3 structures (post-Type 1 signals), though such structures are relatively rare.
■ Application: For reference only. Comprehensive analysis requires combining momentum decay across multiple timeframes.
● ✅ Divergence Alert – Exclusive Divergence Algorithm
○ Principle: Uses MACD momentum statistics from the original Chan Theory to distinguish between "pen-structure divergence" and "segment-structure divergence". Specific values are labeled on the chart to differentiate MACD momentum for pens vs. segments. More complex statistical features will be added in future updates. For reference on the current timeframe only — multi-timeframe momentum analysis is still required.
● ✅ Trend Structure Recursion – Exclusive Trend Recursion Function
○ Principle: This is a "same-timeframe decomposition" version of trend types. Trends end as close to absolute highs/lows as possible. Some single pens may be treated as segments, resulting in more natural-looking trend structures.
⚙️ Indicator Features
🌟 1. Diverse Pen-Segment Algorithm Engines
● 🎨 Three Pen Algorithms: "Traditional Old Pen", "New Pen", "Top/Bottom Fractal Pen".
● 🔧 Extensive Parameter Adjustments: Fine-grained control over "secondary high/low pens", "fractal range judgment", etc.
● 📊 Dual Recursive Division: Recursion starting from pens + higher-timeframe recursion.
● 🎯 Customizable Parameters: Adapts to different Chan Theory interpretations and trading styles.
🌟 2. Multi-Level Intelligent Integration System
● 📈 Synchronized Calculation & Display: Linked analysis of pens, segments, and advanced recursive segments.
● 🏗️ Exclusive Recursion Algorithm: Accurate identification of advanced recursive segments.
● 🎪 Multi-Level Pivot Zone System: Full coverage of three pivot zone levels (candlestick, pen, segment).
● 📊 Holistic Market Analysis: Provides comprehensive insights into real-time market dynamics.
🎨 3. Professional Visual Customization
● 🌈 Custom Color Schemes: Perfectly matches personal chart styles.
● 💰 Price Label Display: Marks key prices for pens, segments, and pivot zones.
● 📐 Professional Auxiliary Tools: Practical features like MA and Bollinger Bands.
● 🎁 Included MACD: A supporting indicator for the sub-chart.
⏰ 4. Seamless Candlestick Replay Support
● 🔄 Historical Data Review: Fully compatible with TradingView’s replay function.
● 📚 Powerful Market Research Tool: Enhances the ability to analyze historical price trends.
● 🧠 Improved Decision-Making: Deepens market insights and judgment.
📦 Feature & Interface Showcase by Product Version
Advanced Recursive Version ⭐ Exclusive Algorithm
Suitable for: Advanced Chan Theory users seeking precise trend analysis.
Exclusive Features:
● 🚀 Rare Algorithm: A pure recursive version (most competitors only reach segment-level analysis, which is their limit).
● 🎯 Optimized High/Low Points: Trend endpoints are accurately positioned at absolute highs/lows.
● 🏆 Natural Trend Structures: More natural and rational distribution of high/low points.
● 💎 Complete Chan Theory Elements: Covers all core components of Chan Theory.
● ⚡ Rich Pen Details: Extremely detailed processing of pen structures.
User Feedback: The preferred version among many senior Chan Theory users, with excellent real-trading performance.
Screenshot:
---
🎊 Experience Now & Start Your Professional Chan Theory Analysis Journey!
Pre-Purchase Notes
Chanzhongshuochan (Chan Theory) is relatively complex. While this software strives to implement all functions from the original texts, minor imperfections or unaddressed details may exist — these will be gradually improved in future updates.
● Users with concerns are advised to test the indicator for a few days first. Purchase only if it meets your needs; otherwise, treat the test as a trial.
● Feedback on issues or bugs is welcome. The developer will update, modify, and optimize the indicator in their spare time.
Key Function Screenshots
1. Multi-Level Recursion
2. Candlestick Containment Processing
3. Area Statistics + Pivot Zone High/Low Price Display
4. Multi-Level Consolidation Divergence
5. Overlaid Practical Moving Averages
6. Fractal Pens
7. Candlestick-Based Pivot Zones
8. Dozens of Adjustable Parameters
9. Optional Alert Functions (More to be Added in Future Updates)
10. Trend Structure Markers
🏆 缠中说禅ZSLX 递归版指标 - 旗舰版
背景
十年匠心,重磅升级
这套缠中说禅指标历经近10年的精心打磨与持续优化,从2015年初版设计至今,已经过实战验证。现全新升级登陆TradingView,功能更加完善,性能更加卓越。
真正实现了缠论原文中的所有核心理论,包括K线包含、分型识别、笔段分析、中枢理论、买卖点定位、背离背驰等完整体系,为缠论爱好者提供业界专业、全面的技术分析工具。
📦参数设置
- 计算K线数量:最多计算5000根,免费tradingview用户也只能这么多数据
- 笔细节参数:新旧笔、次高低点笔、最高低点笔、严格笔 可以调整可按标的数字选
- 显示均线和布林线参数:根据需要设置打钩就是显示,取消打钩就是隐藏
- 显示中枢价格和笔段价格:根据需要设置打钩就是显示,取消打钩就是隐藏
- macd参数:可以根据自己需要调整参数 快 慢 信号线周期设置
- 均线参数:默认参数可以自己手动调整
- 显示笔背离、段背离、笔段背驰:根据需要设置打钩就是显示,取消打钩就是隐藏
- 笔段背离背驰报警:默认关闭可以设置打钩开启,然后在tradingview的警报界面,条件里选择指标,设置:任何alert()函数调用,再设置通知类型,然后创建报警就可以收到报警
🔥整合其他常用指标和原因:
✅均线:因为缠论里是有使用均线叠加分析,这种更方便用户从不同视角分析走势,所以必须增加
✅布林线:布林线通道,结合缠论,也可以更多的视角分析走势,提高准确度,所以也增加了
✅macd:这个是缠论分析理论里必不可少的分析走势力度的指标,所以也必须整合进来方便分析
✅Chanlun ZSLX pen czsc Channel Chan Theory这个脚本和Chanlun FBFD pen czsc Channel Chan Theory这个脚本有些底层的源码是一样的必须整合原因:
因为缠论原文底层的K线包含、macd背离背驰、K线对象和笔部分都是一样的,但是顶层的线段和走势递归两种划分原理和显示效果和功能是有很大区别,并且tradingview社区的源码量有限制,导致也无法两个版本划线完全整合成一个,所以,这个脚本里的Start_kxian函数返回的kxian对象、 Start_bi函数返回的bi 对象 、showKxianzsfunc画K线中枢部分的源码、macd背离背驰判断部分代码,会有一样的整合部分源码
🎯 技术原理
🔥 1. 全方位缠论原文功能覆盖
● ✅ 实时K线包含处理 - 智能识别包含关系
○ - 上涨K线中取高点高值、低点高值,高高取高
- 下跌K线中取高点低值、低点低值,低低取低
● ✅ 精准分型标记 - 顶底分型自动识别
○ - 通过新旧笔参数设置2,会画出每个顶底分型高低点
○ - 顶分型:三根k线中,中间K线高点高于两侧K线,低点也高于两侧
- 底分型:三根k线中,中间K线低点低于两侧K线,高点也低于两侧
● ✅ 多维笔段分析 - 笔、线段完整体系
○ - 老笔:传统缠论严格笔定义,符合原文
- 新笔:传统缠论新笔定义,符合原文宽松笔条件
- 分型笔:顶底分型就成笔,价格反应比较敏锐(同行很多人把本周期分型笔标成次级别)
○ - 线段:这个版本采用递归思路,有的地方一笔处理成段,大部分地方跟纯分段一样,但是划线原理不同
● ✅ 多级中枢联立 - K线中枢、笔中枢、线段中枢
○ - K线中枢:最小级别的缠论中枢
- 笔中枢:采用原文的笔中枢划分区间,高点取重叠部分的最低点,低点取重叠部分最高点
- 线段中枢:采用原文的线段中枢划分区间,高点取线段重叠部分的最低点,低点取线段重叠部分最高点
● ✅ 智能买卖点 - 三类买卖点精准定位
○ 1类买卖点
- 原理:基于缠论趋势背驰原理,形成趋势结构时候,力度减弱
- 分析方法:通过判断趋势结构中最后中枢形成底背驰
- 应用:只是参考,具体分析需要多周期力度衰减结合判断
2类买卖点
- 原理:基于1类买卖点结束后,第一个回调低点
- 分析方法:在形成一类结构后,有时候也会破低点
- 应用:只是参考,具体分析需要多周期力度衰减结合判断
3类买卖点
- 原理:标准的三买是在1买形成后,突破第一个中枢的第一个回踩,这边为了方便看盘,统一突破回踩就标三买
- 识别方法:新手建议选择一类买点后的标准三买结构操作,但是可能这种结构比较少
- 应用:只是参考,具体分析需要多周期力度衰减结合判断
● ✅ 背离背驰预警 - 独家背离背驰算法
○ - 原理:采用缠论原文的macd力度统计,区分笔结构的背离背驰和段结构的背离背驰,并且在图形上标上具体数值,区分笔和段的macd力度,后期这个还要继续升级更复杂的统计,仅做本周期的参考,具体也是要多周期力度分析
● ✅ 走势结构递归 - 独家走势递归功能
- 原理:走势类型版本,这个是同级别分解版本,走势尽量结束在最高最低点,有的地方可能一笔成段,· 走势更为自然
⚙️ 指标特点
🌟1. 多样化笔段算法引擎
○ 🎨 三大笔算法: "传统旧笔"、"新笔"、"顶底分型笔"
○ 🔧 海量参数调节: 次高低笔、分型区间判断等精细化控制
○ 📊 双重递归划分: 笔开始递归 + 大级别递归
○ 🎯 个性化参数调整: 满足不同缠友的理解需求与交易风格
🌟 2. 多级别智能联立系统
○ 📈 同步计算显示: 笔、线段、递归高级段联动分析
○ 🏗️ 独家递归算法: 高级递归段精准识别
○ 🎪 多级中枢体系: 三重中枢级别完整覆盖
○ 📊 全景市场分析: 提供全面的市场动态洞察
🎨 3. 专业视觉定制
○ 🌈 自定义配色方案 - 完美匹配个人图表风格
○ 💰 价格标识显示 - 笔、段、中枢关键价位标注
○ 📐 专业辅助工具 - 均线、布林线等实用功能
○ 🎁 附带MACD - 配套附图指标
⏰ 4. 完美K线回放支持
○ 🔄 历史数据回顾 - 完美支持TradingView回放功能
○ 📚 市场研究利器 - 提升历史走势分析能力
○ 🧠 决策能力增强 - 深化市场洞察与判断水平
📦 产品版本功能界面展示
高级递归版 ⭐ 独家算法
适合:高阶缠友,追求极致走势分析
独家特色:
● 🚀 全网罕见算法: 纯递归版本,其他家最多只能设计到分段级别就是极限了
● 🎯 优化高低点: 走势结束点精准定位最高最低点
● 🏆 自然走势结构: 高低点分布更加自然合理
● 💎 完整缠论元素: 涵盖所有缠论核心要素
● ⚡ 超丰富笔细节: 笔的处理细节极其丰富
🌟 客户反馈: 众多资深缠友首选版本,实战效果卓越
快照
---
🎊 立即体验,开启专业缠论分析之旅!
售前说明:缠中说禅理论,相对比较复杂,软件尽量实现原文的功能,但是也难免有些瑕疵地方,无法处理到位,这边后期会陆续完善,介意的客户可以先试用几天,觉得合适再买,不合适就当测试下,欢迎大家反馈问题和bug,掌柜有空会后期更新修改和优化
1.多级别递归
2.K线包含
3.面积统计+中枢高低点价格显示
4.多级别盘整背离背驰
5.叠加实用均线
6.分型笔
7。k线中枢
8.几十个可选参数调整
9,可选的一些报警功能,后期陆续完善,更丰富
10.走势结构标志

Information-Geometric Market DynamicsInformation-Geometric Market Dynamics
The Information Field: A Geometric Approach to Market Dynamics
By: DskyzInvestments
Foreword: Beyond the Shadows on the Wall
If you have traded for any length of time, you know " the feeling ." It is the frustration of a perfect setup that fails, the whipsaw that stops you out just before the real move, the nagging sense that the chart is telling you only half the story. For decades, technical analysis has relied on interpreting the shadows—the patterns left behind by price. We draw lines on these shadows, apply indicators to them, and hope they reveal the future.
But what if we could stop looking at the shadows and, instead, analyze the object casting them?
This script introduces a new paradigm for market analysis: Information-Geometric Market Dynamics (IGMD) . The core premise of IGMD is that the price chart is merely a one-dimensional projection of a much richer, higher-dimensional reality—an " information field " generated by the collective actions and beliefs of all market participants.
This is not just another collection of indicators. It is a unified framework for measuring the geometry of the market's information field—its memory, its complexity, its uncertainty, its causal flows—and making high-probability decisions based on that deeper reality. By fusing advanced mathematical and informational concepts, IGMD provides a multi-faceted lens through which to view market behavior, moving beyond simple price action into the very structure of market information itself.
Prepare to move beyond the flatland of the price chart. Welcome to the information field.
The IGMD Framework: A Multi-Kernel Approach
What is a Kernel? The Heart of Transformation
In mathematics and data science, a kernel is a powerful and elegant concept. At its core, a kernel is a function that takes complex, often inscrutable data and transforms it into a more useful format. Think of it as a specialized lens or a mathematical "probe." You cannot directly measure abstract concepts like "market memory" or "trend quality" by looking at a price number. First, you must process the raw price data through a specific mathematical machine—a kernel—that is designed to output a measurement of that specific property. Kernels operate by performing a sort of "similarity test," projecting data into a higher-dimensional space where hidden patterns and relationships become visible and measurable.
Why do creators use them? We use kernels to extract features —meaningful pieces of information—that are not explicitly present in the raw data. They are the essential tools for moving beyond surface-level analysis into the very DNA of market behavior. A simple moving average can tell you the average price; a suite of well-chosen kernels can tell you about the character of the price action itself.
The Alchemist's Challenge: The Art of Fusion
Using a single kernel is a challenge. Using five distinct, computationally demanding mathematical engines in unison is an immense undertaking. The true difficulty—and artistry—lies not just in using one kernel, but in fusing the outputs of many . Each kernel provides a different perspective, and they can often give conflicting signals. One kernel might detect a strong trend, while another signals rising chaos and uncertainty. The IGMD script's greatest strength is its ability to act as this alchemist, synthesizing these disparate viewpoints through a weighted fusion process to produce a single, coherent picture of the market's state. It required countless hours of testing and calibration to balance the influence of these five distinct analytical engines so they work in harmony rather than cacophony.
The Five Kernels of Market Dynamics
The IGMD script is built upon a foundation of five distinct kernels, each chosen to probe a unique and critical dimension of the market's information field.
1. The Wavelet Kernel (The "Microscope")
What it is: The Wavelet Kernel is a signal processing function designed to decompose a signal into different frequency scales. Unlike a Fourier Transform that analyzes the entire signal at once, the wavelet slides across the data, providing information about both what frequencies are present and when they occurred.
The Kernels I Use:
Haar Kernel: The simplest wavelet, a square-wave shape defined by the coefficients . It excels at detecting sharp, sudden changes.
Daubechies 2 (db2) Kernel: A more complex and smoother wavelet shape that provides a better balance for analyzing the nuanced ebb and flow of typical market trends.
How it Works in the Script: This kernel is applied iteratively. It first separates the finest "noise" (detail d1) from the first level of trend (approximation a1). It then takes the trend a1 and repeats the process, extracting the next level of cycle (d2) and trend (a2), and so on. This hierarchical decomposition allows us to separate short-term noise from the long-term market "thesis."
2. The Hurst Exponent Kernel (The "Memory Gauge")
What it is: The Hurst Exponent is derived from a statistical analysis kernel that measures the "long-term memory" or persistence of a time series. It is the definitive measure of whether a series is trending (H > 0.5), mean-reverting (H < 0.5), or random (H = 0.5).
How it Works in the Script: The script employs a method based on Rescaled Range (R/S) analysis. It calculates the average range of price movements over increasingly larger time lags (m1, m2, m4, m8...). The slope of the line plotting log(range) vs. log(lag) is the Hurst Exponent. Applying this complex statistical analysis not to the raw price, but to the clean, wavelet-decomposed trend lines, is a key innovation of IGMD.
3. The Fractal Dimension Kernel (The "Complexity Compass")
What it is: This kernel measures the geometric complexity or "jaggedness" of a price path, based on the principles of fractal geometry. A straight line has a dimension of 1; a chaotic, space-filling line approaches a dimension of 2.
How it Works in the Script: We use a version based on Ehlers' Fractal Dimension Index (FDI). It calculates the rate of price change over a full lookback period (N3) and compares it to the sum of the rates of change over the two halves of that period (N1 + N2). The formula d = (log(N1 + N2) - log(N3)) / log(2) quantifies how much "longer" and more convoluted the price path was than a simple straight line. This kernel is our primary filter for tradeable (low complexity) vs. untradeable (high complexity) conditions.
4. The Shannon Entropy Kernel (The "Uncertainty Meter")
What it is: This kernel comes from Information Theory and provides the purest mathematical measure of information, surprise, or uncertainty within a system. It is not a measure of volatility; a market moving predictably up by 10 points every bar has high volatility but zero entropy .
How it Works in the Script: The script normalizes price returns by the ATR, categorizes them into a discrete number of "bins" over a lookback window, and forms a probability distribution. The Shannon Entropy H = -Σ(p_i * log(p_i)) is calculated from this distribution. A low H means returns are predictable. A high H means returns are chaotic. This kernel is our ultimate gauge of market conviction.
5. The Transfer Entropy Kernel (The "Causality Probe")
What it is: This is by far the most advanced and computationally intensive kernel in the script. Transfer Entropy is a non-parametric measure of directed information flow between two time series. It moves beyond correlation to ask: "Does knowing the past of Volume genuinely reduce our uncertainty about the future of Price?"
How it Works in the Script: To make this work, the script discretizes both price returns and the chosen "driver" (e.g., OBV) into three states: "up," "down," or "neutral." It then builds complex conditional probability tables to measure the flow of information in both directions. The Net Transfer Entropy (TE Driver→Price minus TE Price→Driver) gives us a direct measure of causality . A positive score means the driver is leading price, confirming the validity of the move. This is a profound leap beyond traditional indicator analysis.
Chapter 3: Fusion & Interpretation - The Field Score & Dashboard
Each kernel is a specialist providing a piece of the puzzle. The Field Score is where they are fused into a single, comprehensive reading. It's a weighted sum of the normalized scores from all five kernels, producing a single number from -1 (maximum bearish information field) to +1 (maximum bullish information field). This is the ultimate "at-a-glance" metric for the market's net state, and it is interpreted through the dashboard.
The Dashboard: Your Mission Control
Field Score & Regime: The master metric and its plain-English interpretation ("Uptrend Field", "Downtrend Field", "Transitional").
Kernel Readouts (Wave Align, H(w), FDI, etc.): The live scores of each individual kernel. This allows you to see why the Field Score is what it is. A high Field Score with all components in agreement (all green or red) is a state of High Coherence and represents a high-quality setup.
Market Context: Standard metrics like RSI and Volume for additional confluence.
Signals: The raw and adjusted confluence counts and the final, calculated probability scores for potential long and short entries.
Pattern: Shows the dominant candlestick pattern detected within the currently forming APEX range box and its calculated confidence percentage.
Chapter 4: Mastering the Controls - The Inputs Menu
Every parameter is a lever to fine-tune the IGMD engine.
📊 Wavelet Transform: Kernel ( Haar for sharp moves, db2 for smooth trends) and Scales (depth of analysis) let you tune the script's core microscope to your asset's personality.
📈 Hurst Exponent: The Window determines if you're assessing short-term or long-term market memory.
🔍 Fractal Dimension & ⚡ Entropy Volatility: Adjust the lookback windows to make these kernels more or less sensitive to recent price action. Always keep "Normalize by ATR" enabled for Entropy for consistent results.
🔄 Transfer Entropy: Driver lets you choose what causal force to measure (e.g., OBV, Volume, or even an external symbol like VIX). The throttle setting is a crucial performance tool, allowing you to balance precision with script speed.
⚡ Field Fusion • Weights: This is where you can customize the model's "brain." Increase the weights for the kernels that best align with your trading philosophy (e.g., w_hurst for trend followers, w_fdi for chop avoiders).
📊 Signal Engine: Mode offers presets from Conservative to Aggressive . Min Confluence sets your evidence threshold. Dynamic Confluence is a powerful feature that automatically adapts this threshold to the market regime.
🎨 Visuals & 📏 Support/Resistance: These inputs give you full control over the chart's appearance, allowing you to toggle every visual element for a setup that is as clean or as data-rich as you desire.
Chapter 5: Reading the Battlefield - On-Chart Visuals
Pattern Boxes (The Large Rectangles): These are not simple range boxes. They appear when the Field Score crosses a significance threshold, signaling a potential ignition point.
Color: The color reflects the dominant candlestick pattern that has occurred within that box's duration (e.g., green for Bull Engulf).
Label: Displays the dominant pattern, its duration in bars, and a calculated Confidence % based on field strength and pattern clarity.
Bar Pattern Boxes (The Small Boxes): If enabled, these highlight individual, significant candlestick patterns ( BE for Bull Engulf, H for Hammer) on a bar-by-bar basis.
Signal Markers (▲ and ▼): These appear only when the Signal Engine's criteria are all met. The number is the calculated Probability Score .
RR Rails (Dashed Lines): When a signal appears, these lines automatically plot the Entry, Stop Loss (based on ATR), and two Take Profit targets (based on Risk/Reward ratios). They dynamically break and disappear as price touches each level.
Support & Resistance Lines: Plots of the highest high ( Resistance ) and lowest low ( Support ) over a lookback, providing key structural levels.
Chapter 6: Development Philosophy & A Final Word
One single question: " What is the market really doing? " It represents a triumph of complexity, blending concepts from signal processing, chaos theory, and information theory into a cohesive framework. It is offered for educational and analytical purposes and does not constitute financial advice. Its goal is to elevate your analysis from interpreting flat shadows to measuring the rich, geometric reality of the market's information field.
As the great mathematician Benoit Mandelbrot , father of fractal geometry, noted:
"Clouds are not spheres, mountains are not cones, coastlines are not circles, and bark is not smooth, nor does lightning travel in a straight line."
Neither does the market. IGMD is a tool designed to navigate that beautiful, complex, and fractal reality.
— Dskyz, Trade with insight. Trade with anticipation.

Elliot waves calibratorThis script is a part of the "Elliot waves" toolkit and need to be used with the "Elliot waves" script", because it's generating input parameters for the "Elliot waves" scripts.
You need to add script to chart and on the right bottom corner you can see table with calibration params. Those values you need to copy to "Elliot waves" script settings to see Elliot waves visualization on that chart.
Script settings:
Vertex filter - Value used in the "Elliot waves" script to filter highs and lows that are not an extreme over area width equal to vertex filter value. In edge cases it can change calbiration params. Both scripts should have set the same values of this param.
Troubleshooting:
In case of any problems, please send error details to the author of the script.
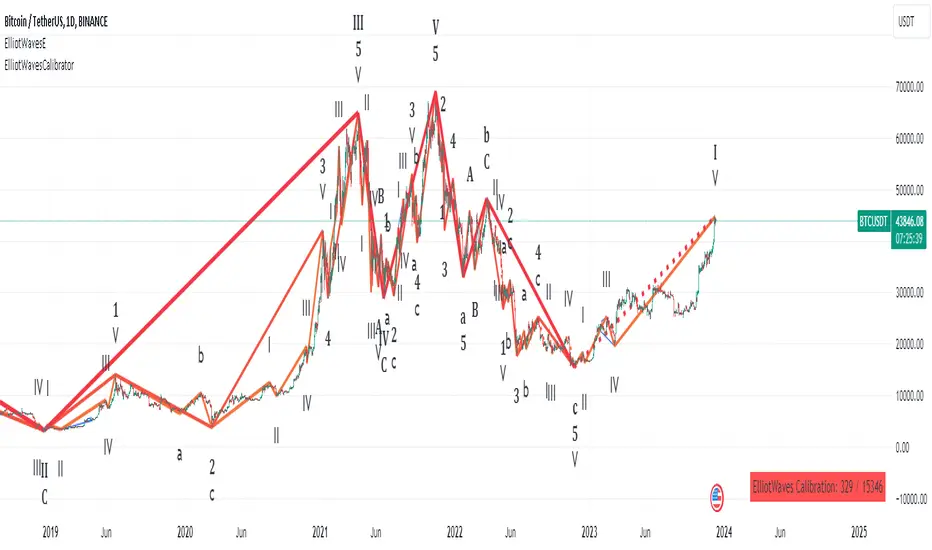
Dual Dynamic Fibonacci Retracement — Long and Short Duration
Title : "The Dual-Dynamic Fibonacci Retracement Script: An Advanced Tool for Comprehensive Market Analysis"
As the author of the "Dual-Dynamic Fibonacci Retracement Script", I am delighted to introduce you to this cutting-edge tool for technical analysis. Unlike conventional Fibonacci scripts, this advanced model incorporates multiple unique features and adjustments that make it a powerful asset for any market analyst. Whether you're dealing with forex, commodities, equities or any other market, this script is versatile enough to enhance your trading strategy.
Uniqueness & Differentiation:
The "Dual-Dynamic Fibonacci Script" stands out by offering two distinct lookback periods. This feature is what separates it from other scripts available in the market. The first lookback period is longer, focusing on capturing broader market trends. The second lookback period is shorter, allowing for a more granular analysis of near-term market fluctuations. This dual perspective provides a more comprehensive view of the market, allowing you to see both the forest and the trees at the same time.
Fibonacci Levels:
While offering the standard Fibonacci retracement levels (0.236, 0.382, 0.5, 0.618, 0.786, and 1.0), the script also gives you the ability to plot 0.114 and 0.886 levels. These additional levels offer an extra layer of depth to your analysis, and can prove crucial in high-volatility markets where they often serve as significant support and resistance points.
Customizable Line Shifts and Extends:
This script provides options for customization of the shift and extension of the plotted lines. This means you can adjust the start and end points of the Fibonacci lines according to your personal trading style and strategy. This level of personalization is not typically available in other scripts, and it allows for a more tailored visual representation.
Flexible Trading Positioning:
Depending on whether the closing price is above or below the midpoint of the pivot high and pivot low, the Fibonacci retracement levels are adjusted accordingly. This ensures the script remains relevant and useful regardless of market conditions.
Clean Visualization:
To prevent clutter and maintain focus on the most relevant price action, the script removes old Fibonacci lines and plots new ones once a new pivot high or low is identified. This clean visualization helps keep your analysis focused and sharp.
How to Use the Script:
To get started, simply adjust the lookback periods according to your trading strategy. If you're a long-term investor or prefer swing trading, a longer lookback period might be appropriate. Conversely, if you're a day trader, a shorter lookback period might be more beneficial.
The "Shift" and "Extend" inputs allow you to control the positioning of the Fibonacci lines on your chart. Positive values shift the lines to the right, while negative values shift them to the left.
You also have the choice to plot the additional Fibonacci levels (0.114 and 0.886) via the "Plot 0.114 and 0.886 levels?" input. Similarly, the "Plot second set of levels?" input lets you decide whether to display the second set of Fibonacci levels derived from the shorter lookback period.
Like any technical analysis tool, this script is most effective when used in conjunction with other indicators and methods of analysis. It is designed to work well in trending markets, where Fibonacci retracements can often indicate potential reversal levels. However, it's always recommended to use a holistic approach to market analysis to maximize the likelihood of successful trades.
Note: the two lines drawn on the chart are there to help the user identify the levels from which the two respective Fib sequences are calculated.
~~~
Input Explanations:
Long Period Pivot High/Low Lookback and Short Period Pivot High/Low Lookback : These settings determine the length of the lookback periods for the long-term and short-term pivot points, respectively. A pivot point is a technical analysis indicator used to determine the overall trend of the market over different time frames. The pivot points are then used to calculate the Fibonacci levels. A longer lookback period will identify pivot points over a broader time frame, capturing major market trends, while a shorter lookback period will identify pivot points over a narrower time frame, capturing more immediate market movements.
Long Period Fibonacci Level Shift and Short Period Fibonacci Level Shift : These inputs control the shift of the Fibonacci levels based on the long and short lookback periods, respectively. If you want to shift the Fibonacci levels to the right, increase the value. If you want to shift the Fibonacci levels to the left, decrease the value. This allows you to adjust the Fibonacci levels to better align with your analysis.
Long Period Fibonacci Level Extend and Short Period Fibonacci Level Extend : These inputs control the extension of the Fibonacci levels based on the long and short lookback periods, respectively. If you want the Fibonacci levels to extend further to the right, increase the value. If you want the Fibonacci levels to extend less to the right, decrease the value. This feature provides the flexibility to adjust the length of the Fibonacci levels according to your personal trading preferences and strategy.
Plot 0.114 and 0.886 levels? : This setting gives you the ability to plot the additional 0.114 and 0.886 Fibonacci levels. These levels provide extra depth to your analysis, particularly in highly volatile markets where they can act as significant support and resistance levels.
Plot second set of levels? : This input allows you to decide whether to plot the second set of Fibonacci levels based on the short lookback period. Displaying this second set of levels can provide a more granular view of market movements and potential reversal points, enhancing your overall analysis.

Psychological levels (Bank levels) PsychoLevels v2 - TartigradiaPsychological levels (Bank levels) plots "round" price levels above and below current price, by truncating after the nth leftmost digits, based on neuroscience research of how humans intuitively calculate in logarithms.
Psychological levels, also called bank levels, are "round" price numbers around which price often experience resistance or support, because traders and investors tend to set orders around these round numbers.
Calculation here is fully automatic and dynamic, contrary to other similar scripts, this one uses a mathematical calculation that extracts the 1, 2 or 3 leftmost digits and calculate the previous and next level by incrementing/decrementing these digits. This means it works for any symbol under any price range.
This approach is based on neuroscience research, which found that human brains intuitively approximate numbers on a logarithmic scale, adults and children alike, and similarly to macaques, for more info see Numerical Cognition , Weber-Fechner Law , Zipf law.
For example, if price is at 0.0421, the next major price level is 0.05 and medium one is 0.043. For another asset currently priced at 19354, the next and previous major price levels are 20000 and 10000 respectively, and the next/previous medium levels are 20000 and 19000, and the next/previous weak levels are 19400 and 19300.
Usage:
* By default, strong upper level is in green, strong lower level is in red, medium upper level is in blue, medium lower level is in yellow, and weak levels aren't displayed but can be. Half levels are also displayed, in a darker color. Strong levels are increments of the first leftmost digit (eg, 10000 to 20000), medium levels are increments of the second leftmost digit (eg, 19000 to 20000), and weak levels of the third leftmost digit (eg, 19100 to 19200). Instead of plotting all the psychological levels all at once as a grid, which makes the chart unintelligible, here the levels adapt dynamically around the current price, so that they show the upper/lower levels relatively to the current price.
* A simple moving average is implemented, so that "half-levels" are also displayed when relevant (eg, medium level can also display 19500 instead of only 19000 or 20000). This can be disabled by setting smoothing to 1.
* By default, the script runs on the daily timeframe, whatever the current chart's timeframe is. This is to reduce the variability in levels, to make it less noisy than intraday price movement, but this can be changed in the settings.
* The step can be adjusted to increase the gap between levels, eg, if you want to display one every 2 levels then input step = 2 (eg, 22000, 24000, 26000, etc), or if you want to display quarter levels, input 0.25 (eg, 22000, 22250, 22500, etc). The default values should fit most use cases and cover most psychological levels.
I made this script mainly to train with PineScript, but I found it surprisingly accurate to define levels that are respected by price movements. So I guess it can be useful for new traders and experienced traders alike, as it's easy to forget that psychological levels can often be as strong if not stronger than technical levels. It can also be used to quickly screen other minor assets for trading opportunities. For example, a hybrid strategy would be to manually define levels on BTCUSD but using this script to automatically define levels in crypto altcoins and quickly screen them for a trade opportunity that can be greater than with BTCUSD but with the same trend.
Changes compared to v1:
* Deduplicated redundant calculations and hence faster script.
* Added half-step levels, which allows to more easily see breakouts (because the levels are still on-screen).
* All steps are now configuration on the GUI.
* Revamped color scheme.
* And major reasons to post as a separate v2 script rather than updating: because we can't update the original description nor screenshot. I have now read more about the House Rules and saw other scriptmakers, so I am trying to write better descriptions like wizards do, by explaining not only how the script works but what the underlying financial concept is to a neophyte audience.

Adapting a built-in [PineCoders]█ OVERVIEW
This Pine script shows how it can be quite simple to personalize a built-in indicator for your needs.
█ OUR SCRIPT
Our objective was to add the current values for volume and its moving average in prominent view, and use brighter colors than the built-in.
We started with the source code from the "Volume" built-in indicator. You can access the source code of many built-ins from the Pine Editor by clicking the "Open" button and choosing "New default built-in script..."
We changed the variable names so they conform to our Coding Conventions . Everybody is of course free to code their scripts the way they want; the conventions provide guidelines for those interested in Pine-specific recommendations. We use our conventions to make our code more readable, which helps readers of open-source publications. As Uncle Bob, a.k.a. Robert Cecil Martin, argues in his "Clean Code" book, code that is easier to read is also useful for its first user: you.
We assigned the colors we use to constants because they are used in multiple places in the script. If we decide to change them, we only need to change the constant definitions for the change to trickle down to the rest of the code.
We used the `inline` and `tooltip` parameters of input() to better organize our inputs and provide extra information under an "i" icon when needed.
We wanted to pack more information in the display of the moving average and volume than just the values, so we color-coded their background:
• When the MA is rising, the background of its table cell is in the bull color, otherwise it's in the bear color. The period used for the MA is also displayed in that cell's legend.
• When the current volume's value is higher/lower than its MA, the background of its cell is of bull/bear color.
We use a Pine table to display our values. We use extra cells to provide a configurable margin to the left, and a small space between the two values.
Because we only use constant colors in this script (i.e., values that are known at compile time), users can change the colors in the "Setting/Style" tab's color widgets. Users of the script can also use the tab to change other attributes of the plots.
Look first. Then leap.
Stock Vn Signal Buy Sell Pro [PlungerMen]Vn Stock Signal Buy Sell Pro , mix 2 indicaror in it for exactly Signal
This Script is perfectly functional and works well by me and the best way to use this script is to use it with “Long Short" script, both compliment for each other. the "Long Short" script is Free, you can find it by searching
If you want to be more accurate and more efficient, more comfortable when you do not want to see too many other indicators, you can register for our Professional edition.
- The Professional Edition supports Level 1 and Level 2 commands ( display at chart : LONG+, long-, SHORT,+,short- ), which are very effective in allocating funds and optimizing your profits
Besides that,You will be supported by personal preferences, profit maximization -2.64% -1.30% -3.21% -3.33% -3.27% Scalping Pro and B Long Short Pro
- We will invite you to the signal channel Telgram with the announcement of the bottom and the peak of the BTC -3.11% -2.64% -1.30% -3.21% -3.33% -3.27% 0.60% -0.13% ,the big variable variable has exists
**We hope you enjoy this script. Your support will help us develop more good quality scripts in the future to serve the community **
**Remember, Like this script and posivite feedback if you are satisfied**
if you have any questions, post a comment ... below here
*********** Guide:
+ option for all frames : Click setting and input high and low for time inteval
+ hide wave trend : Click setting -> click Style --> Up trend Fill or Down trend fill
******
New features: this time we add two lines that can help traders trader safer. When the red line cross above the green line means we are in the downtrend and when the green line cross above the red line, which means we are in a uptrend. This new features will help traders do a safer trade at small time frame.
We have the Script free for the user pass, search keyword " Vn Stock Signal Buy Sell Pro "
-->> 0.2 eth/1 month will be used Script: Vn Stock Signal Buy Sell Pro Pro an Super Bot alert telegram <--
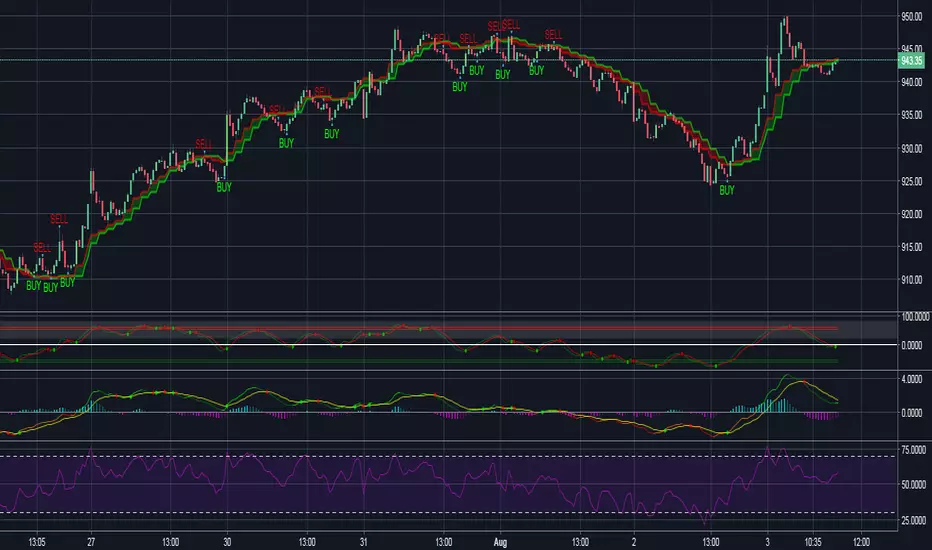
Forex Signal buy sell Pro [PlungerMen]Forex Signal buy sell Pro , mix 2 indicaror in it for exactly Signal
This Script is perfectly functional and works well by me and the best way to use this script is to use it with “Long Short" script, both compliment for each other. the "Long Short" script is Free, you can find it by searching
If you want to be more accurate and more efficient, more comfortable when you do not want to see too many other indicators, you can register for our Professional edition.
- The Professional Edition supports Level 1 and Level 2 commands ( display at chart : LONG+, long-, SHORT,+,short- ), which are very effective in allocating funds and optimizing your profits
Besides that,You will be supported by personal preferences, profit maximization -2.64% -1.30% -3.21% -3.33% -3.27% Scalping Pro and B Long Short Pro
- We will invite you to the signal channel Telgram with the announcement of the bottom and the peak of the BTC -2.64% -1.30% -3.21% -3.33% -3.27% 0.60% -0.13% ,the big variable variable has exists
**We hope you enjoy this script. Your support will help us develop more good quality scripts in the future to serve the community **
**Remember, Like this script and posivite feedback if you are satisfied**
if you have any questions, post a comment ... below here
*********** Guide:
+ option for all frames : Click setting and input high and low for time inteval
+ hide wave trend : Click setting -> click Style --> Up trend Fill or Down trend fill
******
New features: this time we add two lines that can help traders trader safer. When the red line cross above the green line means we are in the downtrend and when the green line cross above the red line, which means we are in a uptrend. This new features will help traders do a safer trade at small time frame.
We have the Script free for the user pass, search keyword " Bitmex Scalping PlungerMen"
-->> 0.2 eth/1 month will be used Script: BForex Signal buy sell Pro an Super Bot alert telegram <--
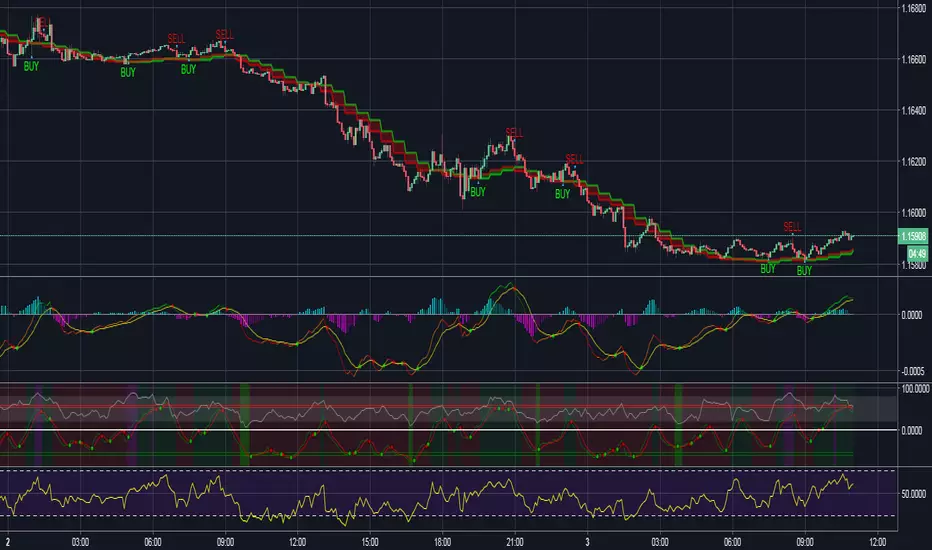
Bitmex margin PRO [PlungerMen]Hello!
this is Update of Bitmex Scalping PRO , mix 2 indicaror in it for exactly Signal
Bitmex margin PRO can use for every coin
Bitmex margin PRO is available for all frames
This Script is perfectly functional and works well by me and the best way to use this script is to use it with “Bitmex Long Short" script, both compliment for each other. the "Bitmex Long Short" script is Free, you can find it by searching “Bimex”
If you want to be more accurate and more efficient, more comfortable when you do not want to see too many other indicators, you can register for our Professional edition.
- The Professional Edition supports Level 1 and Level 2 commands ( display at chart : LONG+, long-, SHORT,+,short- ), which are very effective in allocating funds and optimizing your profits
Besides that,You will be supported by personal preferences, profit maximization
- Register for a Professional version will be used 2 Script, Bitcoin -1.30% -3.21% -3.33% -3.27% Scalping Pro and Bitmex Long Short Pro
- We will invite you to the signal channel Telgram with the announcement of the bottom and the peak of the BTC -1.30% -3.21% -3.33% -3.27% 0.60% -0.13% ,the big variable variable has exists
**We hope you enjoy this script. Your support will help us develop more good quality scripts in the future to serve the community **
**Remember, Like this script and posivite feedback if you are satisfied**
if you have any questions, post a comment ... below here
*********** Guide:
+ option for all frames : Click setting and input high and low for time inteval
+ hide wave trend : Click setting -> click Style --> Up trend Fill or Down trend fill
******
New features: this time we add two lines that can help traders trader safer. When the red line cross above the green line means we are in the downtrend and when the green line cross above the red line, which means we are in a uptrend. This new features will help traders do a safer trade at small time frame.
We have the Script free for the user pass, search keyword " Bitmex Scalping PlungerMen"
-->> 0.2 eth/1 month will be used Script: Bitmex margin PRO an Super Bot alert telegram <--
