Strategy Template - V2This is an educational script created to demonstrate few basic building blocks of a trend based strategy and how to achieve different entry and exit types. My initial intention was to create a comprehensive strategy template which covers all the aspects of strategy. But, ended up creating fully fledged strategy based on trend following.
This is an enhancement on Strategy-Template But this script is comparitively more complex. Hence I decided to create new version instead of updating the existing one.
Lets dive deep.
SIMPLE COMPONENTS OF TREND FOLLOWING STRATEGY
TREND BIAS - This defines the direction of trend. Idea is not to trade against the trend direction. If the bias is bullish, look for long opportunities and if bias is bearish, look for short opportunities. Stay out of the market when the bias is neutral.
Often, trend bias is determined based on longer timeframe conditions. Example - 200 Moving Average, Higher timeframe moving averages, Higher timeframe high-lows etc. can be used for determining the trend bias.
In this script, I am using Weekly donchian channels combined with daily donchian channels to define trend bias.
Long Bias - 40 Day donchian channel sits completely in upper portion of 40 Week dochnial channel.
Short Bias - 40 Day donchian channel sits completely in lower portion of 40 Week donchian channel.
ENTRY CONDITION - Entry signals are generated only in the direction of bias. Hence, when in LongBias, we only get Long signals and when in short bias, we only get short signals.
In our case, when in Long Bias - if price hits 40 day high for the first time, this creates our long entry signal. Similarly when in Short Bias , price hitting 40 day low will create signal for going short. Since we do not take trades opposite to trend, no entry conditions are formed when price hits 40 day high in Short Bias or 40 day low in Long Bias.
EXIT CONDITION - Exit conditions are formed when we get signals of trend failure.
In our case, when in long trade, price hitting 40 day low creates exit signal. Similarly when in short trade price hitting 40 day high creates exit signal for short trade.
DIFFERENT TYPES OF ENTRY AND EXIT
In this script, I have tried to demonstrate different entry and exit types.
Entry types
Market - Enter immediately when entry signal is received. That is, in this case when price crossover over high in long bias and crosses under low in short bias
Stop - This method includes estimating at what level new highs are made and creating a stop buy order at that level. This way, we do not miss if the break out is stronger. But, susciptible to fail during fakeouts.
Limit - This method includes executing a limit order to buy at lower price or sell at higher price. In trend following methods, downside of limit order is when there is genuine breakout, these limit orders may not hit and during trend failures the limit orders are likely to hit and go straight to stop.
Stop-Limit - this is same as stop order but will also place a limit condition to avoid buying on overextended breakout or with lots of slippage.
Exit types
Market - whether to keep the existing trade running or whether to close it is determined after close of each bar and exit orders are executed manually upon receiving exit signal.
Stop - We place stop loss orders beforehand when there is a trade in place. This can help in avoiding big movements against trade within bar. But, this may also stop on false signals or fakeouts.
Take profit
Stop - No take profits are configured.
Target - 30% of the positions are closed when take profit levels are hit. Take profit levels are defined by risk reward.
USING THE CODE AS TEMPLATE
As mentioned earlier, I intended to create a fully fledged strategy template. But, ended up creating a fully fledged stratgy. However, you can take some part of this code and use it to start your own strategy. Will explain what all things can be adopted without worrying about the strategy implementation within
Strategy definition : This can be copied as is and just change the title of strategy. This defines some of the commonly used parameters of strategy which can help with close to realistic backtesting results for your coded strategy and comparison with buy and hold.
Generic Strategy Parameters : The parameter which defines controlling alllowed trade direction and trading window are present here. This again can be copied as is and variable inDateRange can be directly used in entry conditions.
Generic Methods : f_getMovingAverage and f_secureSecurity are handy and can be used as is. atr method provideded by pine gives you ATR based on RMA. If you want SMA or any other moving average based ATR, you can use the method f_getCustomAtr
Trade Statements : This section has all types of trading instructions which includes market/stop/limit/stop-limit type of entries and exits and take profit statements. You can adopt the type of entry you are interested in and change when condition to suit your strategy.
Trade conditions and levels : This section is required. But, cannot be copied. All the trade logic goes here which also sets parameters which are used in when of Trade Statements.
Hope this helps.
Cari dalam skrip untuk "the strat"

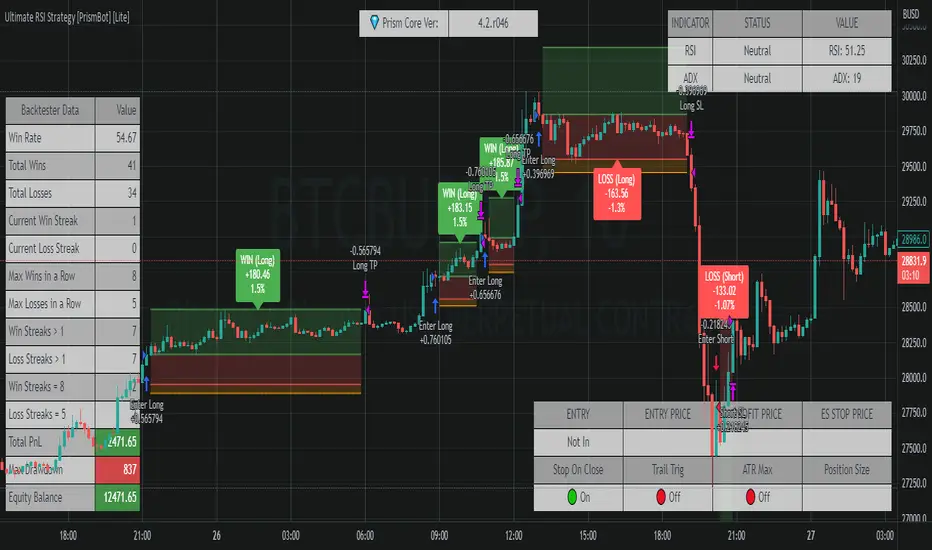
Ultimate RSI Strategy [PrismBot] [Lite]Included in this Ultimate MACD Lite Strategy:
✔️ Tweak a multitude of specific settings (MA lengths, R:R, SL distance etc)
✔️ Enable advanced setup filters
✔️ Use money management and risk calculations
✔️ Draw trade info directly to chart (eg. SL size in percent, win rate etc)
✔️ Use various filters (eg. time filter, date filter, MA slope angle etc)
✔️ Manage risk per position when auto-trading forex through AutoView
✔️ Choose from various alert conditions!
✔️ Sync to any bot or algorithmic trading system
Some details about this strategy:
There are several strategies that people use for the RSI , and one of my favorites is very different than one you have probably heard from every online RSI strategy source.
In order to compliment the RSI , there is also a built-in ADX / DMI strategy (per our All-In-One strategy on my profile as well) and you will also find a Global Trend filter (200 EMA by default).
You can also use a pullback confirmation prior to a trade entering. I.E., you have the RSI signal, wait for a pullback to the pullback EMA , and then the strategy will enter a trade.
You can easily enable and disable strategies using the checkbox.
This strategy incorporates a risk to reward system where the user can select between ATR and Percent based stop losses and take profit targets. This means that the user has much better control over money management when utilizing this strategy and it doesn't require you to babysit the strategy to ensure it's entering and existing strategies in an ideal place.
Ultimate MACD Strategy [PrismBot] [Lite]Included in this Ultimate MACD Lite Strategy:
✔️ Tweak a multitude of specific settings (MA lengths, R:R, SL distance etc)
✔️ Enable advanced setup filters
✔️ Use money management and risk calculations
✔️ Draw trade info directly to chart (eg. SL size in percent, win rate etc)
✔️ Use various filters (eg. time filter, date filter, MA slope angle etc)
✔️ Manage risk per position when auto-trading forex through AutoView
✔️ Choose from various alert conditions!
✔️ Sync to any bot or algorithmic trading system
Some details about this strategy:
LONG SIGNAL
When the MACD is below the zero line of the histogram, close is above the 200EMA, and the MACD line crosses above the signal line, longs are taken
SHORT SIGNAL
When the MACD is above the zero line of the histogram, close is below the 200EMA, and the MACD line crosses below the signal line, shorts are taken
A couple of options are given for how to calculator stop losses.
The Take profit is calculated by the risk of the stop loss. So a 1.5 take profit target is 1.5 times the stop loss added to the entry price.
There is also an option to filter out trades by the histogram deviation. This prevents crossovers that are too close to the histogram from being taken.
Please note I used the code for the PPO instead of the traditional MACD to make calculating these percentage deviations more consistent across multiple asset types.
You can easily enable and disable strategies using the checkbox.
This strategy incorporates a risk to reward system where the user can select between ATR and Percent based stop losses and take profit targets. This means that the user has much better control over money management when utilizing this strategy and it doesn't require you to babysit the strategy to ensure it's entering and existing strategies in an ideal place.
You can also enter custom messages for alerts for use with bots (set alerts to "alert() function calls only")

Keltner Worm Strategy [PrismBot] [Lite]Included in this Keltner Worm Lite Strategy:
✔️ Tweak a multitude of specific settings (MA lengths, R:R, SL distance etc)
✔️ Enable advanced setup filters
✔️ Use money management and risk calculations
✔️ Draw trade info directly to chart (eg. SL size in percent, win rate etc)
✔️ Use various filters (eg. time filter, date filter, MA slope angle etc)
✔️ Manage risk per position when auto-trading forex through AutoView
✔️ Choose from various alert conditions!
✔️ Sync to any bot or algorithmic trading system
Some details about this strategy:
- it incorporates 2 strategies - Keltner Re-entry and Baseline MA Crossing
- it uses a take profit and stop loss level fixed
- there are up to 6 allowable "worms"
- the worm multipliers are exponential, so a value of 2 will mean that the 6th worm is multiplied by 6
- you can multiply the offset or the Keltner Channel default values
- You can enable alerts for order entry, take profit, and stop loss values
- You can easily enable and disable strategies using the checkbox.
- This strategy incorporates a risk to reward system where the user can select between ATR and Percent based stop losses and take profit targets. This means that the user has much better control over money management when utilizing this strategy and it doesn't require you to babysit the strategy to ensure it's entering and existing strategies in an ideal place.

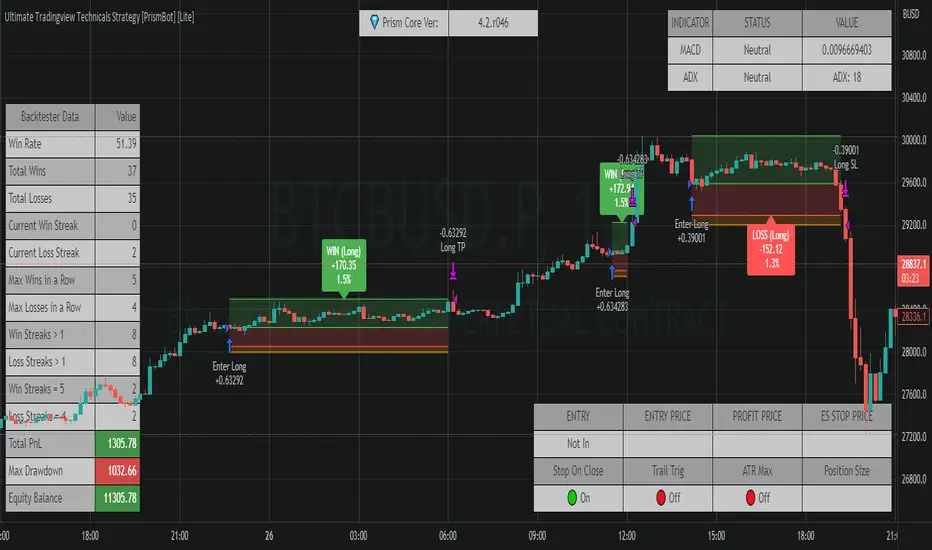
Ultimate Tradingview Technicals Strategy [PrismBot] [Lite]Included in this builder:
MACD
RSI
Tradingview Technical Analysis
Ichimoku
Global Trend Filter
Pullback Filter
Our most robust strategy to date with MACD , RSI , and many other basic strategies included as well as additional filters and alert options.
It is an advanced trading strategy built with the intent to make it easy for anyone to begin trading, but also avoid too much complication of strategy concepts.
For instance, you can change the MACD settings to be "more sensitive" by using a simple dropdown menu, and adjust which strategy you are employing with the MACD on the fly with another.
You can easily enable and disable strategies using the checkbox.
The strategy demo results use 100% equity per trade as an example - the reason for this is that the stop loss is set to 1%, so each trade is risking 1% (give or take slippage). Slippage is set to 5 ticks, and a 0.04% commission (Binance average for market and limit orders)
This strategy incorporates a risk to reward system where the user can select between ATR and Percent based stop losses and take profit targets. This means that the user has much better control over money management when utilizing this strategy and it doesn't require you to babysit the strategy to ensure it's entering and existing strategies in an ideal place.
The status box shows the current state of the various strategies and their values. A red circle indicates the filter / strategy is not valid for entry yet. A green circle indicates that filter / strategy is valid for entry. When all selected strategies are valid simultaneously, the next bar will trigger an entry signal.
If you have any questions about this strategy, please leave them in the comments below, or DM for more details. Thanks!
Additional features in this lite strategy:
✔️ Tweak a multitude of specific settings (MA lengths, R:R, SL distance etc)
✔️ Use money management and risk calculations
✔️ Draw trade info directly to chart (eg. SL size in percent, win rate etc)
✔️ Use various filters (eg. time filter, date filter etc)
✔️ Manage risk per position
✔️ Sync to any bot or algorithmic trading system
Sola Fide [Strategy]Sola Fide High Accuracy with ATR R:R
Indicators used:
- Stochastic RSI
- Chopiness Index
- RSI
- Ichimoku Cloud
- ATR
Script has been set up in strategy format to give backtesting data.
The strategy has been made for BTC and ETH pairs against USDT on the hourly timerframe
Currently outperforming the Buy and Hold Return on both assets.
This script has been made to make it easier to automate strategies on 3commas
In the settings you will see options for BTC strategy or ETH strategy
Choose the asset you are on, copy your 3commas Bot ID and Email token and paste them into the settings box for eachever asset you are on.
To receive the alerts set up within the strategy, in your alert message box use " {{strategy.order.alert_message}}"
This will then be able to send any orders taken on the tradingview script directly to your long or short bot on 3commas
This strategy is set up with a strict set of rules on the ATR for the Take profits and Losses.
There is a repaint warning because the code uses heikin ashi candles through the security function, the given entry and exit signals do not repaint,
I have been automating this for myself with no errors.
You don't need to use more than 3x leverage...
Past results do not guarentee future results.

How to use Leverage and Margin in PineScriptEn route to being absolutely the best and most complete trading platform out there, TradingView has just closed 2 gaps in their PineScript language.
It is now possible to create and backtest a strategy for trading with leverage.
Backtester now produces Margin Calls - so recognizes mid-trade drawdown and if it is too big for the broker to maintain your trade, some part of if will be instantly closed.
New additions were announced in official blogpost , but it lacked code examples, so I have decided to publish this script. Having said that - this is purely educational stuff.
█ LEVERAGE
Let's start with the Leverage. I will discuss this assuming we are always entering trades with some percentage of our equity balance (default_qty_type = strategy.percent_of_equity), not fixed order quantity.
If you want to trade with 1:1 leverage (so no leverage) and enter a trade with all money in your trading account, then first line of your strategy script must include this parameter:
default_qty_value = 100 // which stands for 100%
Now, if you want to trade with 30:1 leverage, you need to multipy the quantity by 30x, so you'd get 30 x 100 = 3000:
default_qty_value = 3000 // which stands for 3000%
And you can play around with this value as you wish, so if you want to enter each trade with 10% equity on 15:1 leverage you'd get default_qty_value = 150.
That's easy. Of course you can modify this quantity value not only in the script, but also afterwards in Script Settings popup, "Properties" tab.
█ MARGIN
Second newly released feature is Margin calculation together with Margin Calls. If the market goes against your trades and your trading account cannot maintain mid-trade drawdown - those trades will be closed in full or partly. Also, if your trading account cannot afford to open more trades (pyramiding those trades), Margin mechanism will prevent them from being entered.
I will not go into details about how Margin calculation works, it was all explainged in above mentioned blogpost and documentation .
All you need to do is to add two parameters to the opening line of your script:
margin_long = 1./30*50, margin_short = 1./30*50
Whereas "30" is a leverage scale as in 30:1, and "50" stands for 50% of Margin required by your broker. Personally the Required Margin number I've met most often is 50%, so I'm using value 50 here, but there are literally 1000+ brokers in this world and this is individual decision by each of them, so you'd better ask yourself.
--------------------
Please note, that if you ever encounter a strategy which triggers Margin Call at least once, then it is probably a very bad strategy. Margin Call is a last resort, last security measure - all the risks should be calculated by the strategy algorithm before it is ever hit. So if you see a Margin Call being triggred, then something is wrong with risk management of the strategy. Therefore - don't use it!

Bollinger Flip Flop StrategyThis strategy combines both long and short Bollinger band strategies with a signal to determine to determine when it's appropriate to use each. Additionally, the strategy has protections in place for market conditions which would normally cause a trade to be stuck due to a long market trend change. Think of it like a stop loss but instead of basing the stop on a percentage from entry, it's based on prevailing market conditions.
This strategy is ideal for controlling trading bots on the 3commas.io platform. To do this, you will need to set up two "simple" bots, one for short trades and one for long trades. Other than their direction, they should be configured identically. Set the parameters for the bot the same as you have them set in the strategy preferences. Once you've done this, set the "Short Bot ID" and "Long Bot ID" fields to the ID numbers for each bot, respectively. Next, set the Email Token parameter (this will be the same for both bots). Once you've done this, you need only configure a single alert per coin pair with the alert message set to {{strategy.order.alert_message}}. Make sure you have all of the strategy settings, including bot IDs and email tokens set correctly before creating the alert . These parameters are saved in the alert and can be safely changed on the active chart once the alert is created without affecting the alert.
RSI+PA+DCA StrategyDear Tradingview community,
This RSI based trading strategy is created as a training exercise. I am not a professional trader, but a committed hobbyist. This not a finished trading strategy meant for trading, but more a combination of different trading ideas I liked to explore deeper. The aim with this exercise was to gain more knowledge and understanding about price averaging and dollar cost averaging strategies. Aside that I wanted to learn how to program a pyramiding strategy, how to plot different order entry layers and how to open positions on a specific time interval.
In this script I adapted code from a couple of strategy examples by Coinrule . Who wrote simple and powerful examples of RSI based strategies and pyramiding strategies.
Also the HOWTO scripts shared by vitvlkv were very helpful for this exercise. In the script description you can find all the sources to the code.
A PA strategy could be a helpful addition to ease the 'stress-management to buy when price drops and resolution in selling when the price is rising' (Coinrule).
The idea behind the strategy is fairly simple and is based on an RSI strategy of buying low. A position is entered when the RSI and moving average conditions are met. The position is closed when it reaches a specified take profit percentage. As soon as the first the position is openend multiple PA (price average) layers are setup based on a specified percentage of price drop. When the price crosses the layer another position with somewhat the same amount of assets is entered. This causes the average cost price (the red plot line) to decrease. If the price drops more, another similar amount of assets is bought with another price average decrease as result. When the price starts rising again the different positions are separately closed when each reaches its specified take profit. The positions can be re-openend when the price drops again. And so on. When the price rises more and crosses over the average price and reached the specified take profit on top of it, it closes all the positions at once and cancels all orders. From that moment on it waits for another price dip before it opens a new position.
Another option is to activate a DCA function that opens a position based on a fixed specified amount. It enters a position at the start of every week and only when there are already other positions openend and if the current price is below the average price of the position. Like this buying on a time interval can help lowering the average price in case the market is down.
I read in some articles that price averaging is also called dollar cost averaging as the result is somewhat the same. Although DCA is really based on buying on fixed time intervals. These strategies are both considered long term investment strategies that can be profitable in the long run and are not suitable for short term investment schemes. The downturn is that the postion size increases when the general market trend is going down and that you have to patiently wait until the market start rising again.
Another notable aspect is that the logic in this strategy works the way it does because the entries are exited based on the FIFO (first in first out) close entry rule. This means that the first exit is applied to the first entry position that is openend. In other words that when the third entry reaches its take profit level and exits, it actually exits the first entry. If you take a close look in the 'List of Trades' of your Strategy Tester panel, you can see that some 'Long1' entries are closed by an 'Exit 3' and not by an 'Exit 1'. This means that your trade partly loses, but causes a decrease in average price that is later balanced out by lower or repeated entering and closing other positions. You can change this logic to a real sequential way of closing your entries, but this changes the averaging logic considerably. In case you want to test this you need to change, in this line in the strategy call 'close_entries_rule = "FIFO"', the word FIFO to ANY.
In the settings you can specify the percentage of portfolio to use for each trade to spread the risk and for each order a trading fee of 0.075% is calculated.

Flawless Victory Strategy - 15min BTC Machine Learning StrategyHello everyone, I am a heavy Python programmer bringing machine learning to TradingView. This 15 minute Bitcoin Long strategy was created using a machine learning library and 1 year of historical data in Python. Every parameter is hyper optimized to bring you the most profitable buy and sell signals for Bitcoin on the 15min chart. The historical Bitcoin data was gathered from Binance API, in case you want to know the best exchange to use this long strategy. It is a simple Bollinger Band and RSI strategy with two versions included in the tradingview settings. The first version has a Sharpe Ratio of 7.5 which is amazing, and the second version includes the best stop loss and take profit positions with a Sharpe Ratio of 2.5 . Let me talk a little bit more about how the strategy works. The buy signal is triggered when close price is less than lower Bollinger Band at Std Dev 1, and the RSI is greater than a certain value. The sell signal is triggered when close price is greater than upper Bollinger Band at Std Dev 1, and the RSI is greater than a certain value. What makes this strategy interesting is the parameters the Machine Learning library found when backtesting for the best Sharpe Ratio. I left my computer on for about 28 hours to fully backtest 5000 EPOCHS and get the results. I was able to create a great strategy that might be one of TradingView's best strategies out on the website today. I will continue to apply machine learning to all my strategies from here on forward. Please Let me know if you have any questions or certain strategies you would like me to hyper optimize for you. I'm always willing to create profitable strategies!
P.S. You can always pyramid this strategy for more gains! I just don't add pyramiding when creating my strategies because I want to show you the true win/loss ratio based buying one time and one selling one time. I feel like when creating a strategy that includes pyramiding right off the bat falsifies the win rate. This is my way of being transparent with you all. Have fun trading!

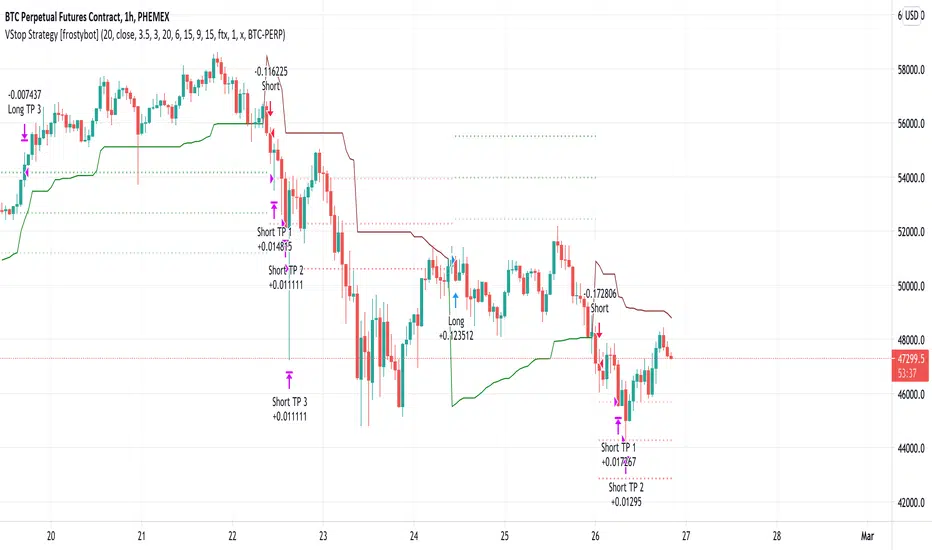
Volatility Stop Strategy [frostybot]This is a modified version of the Standard Volatility Script on TradingView, tweaked for the BTCUSD chart on the 1H timeframe.
I've designed this strategy to be used with Frostybot with ease.
However, this can be disabled in the settings. Then you will receive alerts without Frostybot commands.
First, open the settings section of the indicator. Then fill in the following fields:
You can play around with the TP values and see what works best for your personal risk assessment
Account Stub: enter the name of your stub on Frostybot (only needed if you enable the "Use Frostybot Alert Triggers" checkbox)
Position Size and Size Type: Here you can choose the amount on which you want to enter the trade, for example: 100$, 2x,... (only needed if you enable the "Use Frostybot Alert Triggers" checkbox)
Symbol: Enter the BTC symbol that is valid for the Frostybot Stub's Exchange. For FTX: BTC-PERP, for Binance Futures: BTC /USDT,... (only needed if you enable the "Use Frostybot Alert Triggers" checkbox)
Press OK
Then, setup an alert on the strategy:
Configure the correct Frostybot Webhook URL (don't forget to add /frostybot after the IP address) (only needed if you enable the "Use Frostybot Alert Triggers" checkbox)
Give the alert a name of choice
Put this as the message: {{strategy.order.alert_message}}
Press OK
Enjoy and happy trading!
Ultimate Strategy TemplateHello Traders
As most of you know, I'm a member of the PineCoders community and I sometimes take freelance pine coding jobs for TradingView users.
Off the top of my head, users often want to:
- convert an indicator into a strategy, so as to get the backtesting statistics from TradingView
- add alerts to their indicator/strategy
- develop a generic strategy template which can be plugged into (almost) any indicator
My gift for the community today is my Ultimate Strategy Template
Step 1: Create your connector
Adapt your indicator with only 2 lines of code and then connect it to this strategy template.
For doing so:
1) Find in your indicator where are the conditions printing the long/buy and short/sell signals.
2) Create an additional plot as below
I'm giving an example with a Two moving averages cross.
Please replicate the same methodology for your indicator wether it's a MACD, ZigZag, Pivots, higher-highs, lower-lows or whatever indicator with clear buy and sell conditions
//@version=4
study(title='Moving Average Cross', shorttitle='Moving Average Cross', overlay=true, precision=6, max_labels_count=500, max_lines_count=500)
type_ma1 = input(title="MA1 type", defval="SMA", options= )
length_ma1 = input(10, title = " MA1 length", type=input.integer)
type_ma2 = input(title="MA2 type", defval="SMA", options= )
length_ma2 = input(100, title = " MA2 length", type=input.integer)
// MA
f_ma(smoothing, src, length) =>
iff(smoothing == "RMA", rma(src, length),
iff(smoothing == "SMA", sma(src, length),
iff(smoothing == "EMA", ema(src, length), src)))
MA1 = f_ma(type_ma1, close, length_ma1)
MA2 = f_ma(type_ma2, close, length_ma2)
// buy and sell conditions
buy = crossover(MA1, MA2)
sell = crossunder(MA1, MA2)
plot(MA1, color=color_ma1, title="Plot MA1", linewidth=3)
plot(MA2, color=color_ma2, title="Plot MA2", linewidth=3)
plotshape(buy, title='LONG SIGNAL', style=shape.circle, location=location.belowbar, color=color_ma1, size=size.normal)
plotshape(sell, title='SHORT SIGNAL', style=shape.circle, location=location.abovebar, color=color_ma2, size=size.normal)
/////////////////////////// SIGNAL FOR STRATEGY /////////////////////////
Signal = buy ? 1 : sell ? -1 : 0
plot(Signal, title="🔌Connector🔌", transp=100)
Basically, I identified my buy, sell conditions in the code and added this at the bottom of my indicator code
Signal = buy ? 1 : sell ? -1 : 0
plot(Signal, title="🔌Connector🔌", transp=100)
Important Notes
🔥 The Strategy Template expects the value to be exactly 1 for the bullish signal , and -1 for the bearish signal
Now you can connect your indicator to the Strategy Template using the method below or that one
Step 2: Connect the connector
1) Add your updated indicator to a TradingView chart
2) Add the Strategy Template as well to the SAME chart
3) Open the Strategy Template settings and in the Data Source field select your 🔌Connector🔌 (which comes from your indicator)
From then, you should start seeing the signals and plenty of other stuff on your chart
🔥 Note that whenever you'll update your indicator values, the strategy statistics and visual on your chart will update in real-time
Settings
- Color Candles : Color the candles based on the trade state (bullish, bearish, neutral)
- Close positions at market at the end of each session : useful for everything but cryptocurrencies
- Session time ranges : Take the signals from a starting time to an ending time
- Close Direction : Choose to close only the longs, shorts, or both
- Date Filter : Take the signals from a starting date to an ending date
- Set the maximum losing streak length with an input
- Set the maximum winning streak length with an input
- Set the maximum consecutive days with a loss
- Set the maximum drawdown (in % of strategy equity)
- Set the maximum intraday loss in percentage
- Limit the number of trades per day
- Limit the number of trades per week
- Stop-loss: None or Percentage or Trailing Stop Percentage or ATR
- Take-Profit: None or Percentage or ATR
- Risk-Reward based on ATR multiple for the Stop-Loss and Take-Profit
This script is open-source so feel free to use it, and optimize it as you want
Alerts
Maybe you didn't know it but alerts are available on strategy scripts.
I added them in this template - that's cool because:
- if you don't know how to code, now you can connect your indicator and get alerts
- you have now a cool template showing you how to create alerts for strategy scripts
Source: www.tradingview.com
I hope you'll like it, use it, optimize it and most importantly....make some optimizations to your indicators thanks to this Strategy template
Special Thanks
Special thanks to @JosKodify as I borrowed a few risk management snippets from his website: kodify.net
Additional features
I thought of plenty of extra filters that I'll add later on this week on this strategy template
Best
Dave

TradingView Alerts to MT4 MT5 - Forex, indices, commoditiesHowdy Algo-Traders! This example script has been created for educational purposes - to present how to use and automatically execute TradingView Alerts on real markets.
I'm posting this script today for a reason. TradingView has just released a new feature of the PineScript language - ALERT() function. Why is it important? It is finally possible to set alerts inside PineScript strategy-type script, without the need to convert the script into study-type. You may say triggering alerts straight from strategies was possible in PineScript before (since June 2020), but it had its limitations. Starting today you can attach alert to any custom event you might want to include in your PineScript code.
With the new feature, it is easier not only to execute strategies, but to maintain codebase - having to update 2 versions of the code with each single modification was... ahem... inconvenient. Moreover, the need to convert strategy into study also meant it was required to rip the code from all strategy...() calls, which carried a lot of useful information, like entry price, position size, and more, definitely influencing results calculated by strategy backtest. So the strategy without these features very likely produced different results than with them. While it was possible to convert these features into study with some advanced "coding gymnastics", it was also quite difficult to test whether those gymnastics didn't introduce serious, bankrupting bugs.
//////
How does this new feature work? It is really simple. On your custom events in the code like "GoLong" or "GoShort", create a string variable containing all the values you need inside your alert and this string variable will be your alert's message. Then, invoke brand new alert() function and that's it (see lines 67 onwards in the script). Set it up in CreateAlert popup and enjoy. Alerts will trigger on candle close as freq= parameter specifies. Detailed specification of the new alert() function can be found in TradingView's PineScript Reference (www.tradingview.com), but there's nothing more than message= and freq= parameters. Nothing else is needed, it is very simple. Yet powerful :)
//////
Alert syntax in this script is prepared to work with TradingConnector. Strategy here is not too complex, but also not the most basic one: it includes full exits, partial exits, stop-losses and it also utilizes dynamic variables calculated by the code (such as stop-loss price). This is only an example use case, because you could handle variety of other functionalities as well: conditional entries, pending entries, pyramiding, hedging, moving stop-loss to break-even, delivering alerts to multiple brokers and more.
//////
This script is a spin-off from my previous work, posted over a year ago here: Some comments on strategy parameters have been discussed there, but let me copy-paste most important points:
* Commission is taken into consideration.
* Slippage is intentionally left at 0. Due to shorter than 1 second delivery time of TradingConnector, slippage is practically non-existing.
* This strategy is NON-REPAINTING and uses NO TRAILING-STOP or any other feature known to be causing problems.
* The strategy was backtested on EURUSD 6h timeframe, will perform differently on other markets and timeframes.
Despite the fact this strategy seems to be still profitable, it is not guaranteed it will continue to perform well in the future. Remember the no.1 rule of backtesting - no matter how profitable and good looking a script is, it only tells about the past. There is zero guarantee the same strategy will get similar results in the future.
Full specs of TradingView alerts and how to set them up can be found here: www.tradingview.com

POW EdgeHello fellow Trading View member,
Eventually our rebranded update with some extra features for our exclusive 'Edge' Strategy Script.
In this description I will run through;
The strategy itself, what is it?
What does it do?
How does it work?
How can it help you?
How good is it?
What is it.....
The Edge Strategy itself is based upon 5 indicators lining up in total confluence to enter a position in line with a trending move. Adding them together adds more confluence and probability to each individual trade outcome over the longer term. The individual strategies used are based on Trend strategies all used in combination.
The uniqueness to this is how they are combined. Indicators can work to a point individually of course, but combining them together and only trading when all are in a line was our concept, whilst reviewing how each individual indicator can be optimised to work with the others.
Also the motivation was to be the right side of the market in a trending move and capitalising on as much as that move as possible.
The first part is to ensure the candle close is above or below our moving average, we can then check the state and validity of each of the other 4 indicators. Once this confluence is in alignment a trade is valid for entry - this has to be valid at the same time - but not all valid on the same candle - they will come into alignment in different stages. But once they are, our trade is valid.
I will not reveal the other individual 3 indicators but the other is also an ADX function to add a threshold into the strategy to identify a trend - usually above 20/25. This has upsides and downsides as any user can visualise and see in the testing.
We also add to the script to look for a Buy then Sell, Sell then Buy - we found this had more profitable results overall and next phase was to review the money management; where and how we placed our SL and when and why we exited the trade.
Example - for a BUY trade to be valid, all 5 indictors must meet their own criteria before a BUY is printed on the chart. Absolutely no technical analysis is needed to trade this strategy and the data we have is based on using the strategy in isolation - how you wish to use this either independently or supporting your own trading is of course, up to you.
The SL and TP's are based on ATR Multipliers thus ensuring we are factoring in market volatility at that time. We also have a FT (Follow Trend) option, which is a worthy addition for capitalising on big trending moves.
This strategy will work on all markets and timeframes.
We understand and accept that all pairs and markets are different thus we have optimised certain pairs and timeframes with different parameters to provide increased returns, these are hard coded (H1 Timeframe) and also provided for your review.
Profitability is easily viewable in the ‘Strategy Tester’ - this is a great tool. This is where you can see historic / live data for the strategy.
Data like;
The Net Profit
Number of trades
Win Percentage
Every trade taken
Average Win
Average Loss
Maximal DD , etc.
We have individually optimised each pair to ensure this is the case and hard coded these parameters into the strategy. All you need to do is flick between the pairs - the strategy will then identify the pair you are on and change the parameters to suit in the background.
Whilst a trade is open, the strategy will convert all candles to the relevant colour - Green for an uptrend and Red for a downtrend (all customisable).
We find this is helpful for traders psychology - not getting 'spooked' by other candle colours, affecting your decision making.
When a new signal is valid, 'POW BUY' or 'POW SELL' will be displayed on the first candle open for entry. As well as this, you will also have the trade label print which will display the following;
- EP – Entry price
- SL – Stop loss
- TP – Take Profit
- Lot size
The trade information printed will also tell you the pip values of your stop loss and take profit based on how far away they are from the trade entry price.
The lot size printed is customisable and unique to your account- within the strategy settings you can simply input your account balance, currency and risk approach which includes a fixed risk amount, fixed lot size or a fixed percentage.
This removes the need for 3rd party apps or websites to quickly calculate your specific risk on your trade. Thus saving you time and making sure you aren't 'guessing' with your lot size.
No one likes losing more than they thought.
The progress and initial challenges....
To start, our first version simply showed the buy and sell arrows when a trade was valid. However, this caused subjectivity with where we would place our stop loss and how we would manage the exit of the trade once we were in it. So, we identified a solid strategy for this was incorporating the Average True Range (ATR) for SL and TP options.
I was especially keen to add the SL and exit management so I could obtain solid back testing data to support my thoughts that 'this works'. Every trader requires confidence and belief in their strategy, without it you simply won't succeed or be disciplined in your execution.
The other challenge we all face is calculating the lot sizes of our trades right? So, it was important that we incorporated a lot size calculator - its all about making it easy when a trade is valid to enter without trying to calculate this accurately.
Lastly, when pairs are stuck in a range - this can be a testing period of 'chop' for a trend strategy, so we also incorporated the ADX function to enable us to set a threshold level to identify when the instrument is more likely to be trending.
What does it do?
Ultimately, tells you when to buy and sell - where to place your SL and when to exit. Whilst also ensuring your risk management is on point, by displaying your trading lot size. Also providing you with live back tested data at your finger tips thank you to the strategy tester.
How does it work?
This will be visible on your trading view charts once you get access. And will work across all your devices, the trading view website or the app on your phone for example.
You can also use Trading View alerts, so you won't miss a trade and can go about your day as normal without watching the screen. This will work on the Free version of TV, however, in order to benefit from more alerts and templates it makes sense to upgrade to a higher package.
How can it help you?
This will help give you a mechanical approach to your trading. This means, less decision making on your part, with the instant benefit of seeing the data you have at your fingertips thanks to the 'Strategy Tester' TV Function.
It will save you time, you don't need to be in front of your screen or completing any subjective analysis.
Integrated lot size calculator can ensure you are always accurate with your risk - either in percentage or a fixed amount of risk - whichever you prefer.
Understand Probability - this is the key one for me. Losing runs happen in any trading strategy. The great benefit here, is you can see them. How long were the losing runs? How can I prepare and plan my risk management around them are all fundamental keys to managing your emotions and being detached from your trades. No one wants to feel stressed or anxious when trading.
Customisable exit strategies - A specific TP for a 1:1 RR or 1:10 RR for example can be adjusted and you can see instantly how this affects the profitability.
The exit strategy options are shown below;
TP 1/2/3
FT - Follow Trend (no stop loss and follow's from Buys to Sells, Sell to Buy, etc.
SL + FT - SL present, but trade is held until a reverse signal is presented.
How good is it?
We have some really positive back testing data across a range of pairs and markets - equities and indices too.
Drop me a DM to see these and I'll be happy to share.
Below let me show you a screen shot of how this can work for you.
How do you access this?
Please visit our website for signup / purchase information in the first instance (the link is on our trading view signature) or send us a private message on here - its impossible to keep track of comments on our posts so to ensure we don't miss you, a private DM will be great please.
The Back test shown on this example is based on the Trading View mid price and also a realistic starting Capital of £10,000. This test result is also based on a 0.1% risk per trade, with a 5 tick spread and a commission of
Regards
Darren
Disclaimer alert.
Please remember past performance is exactly that - how our strategy performed over those dates tested, it is not obviously a guarantee of future performance. Most of our H1 data is valid from Jan 2017 to now - so 4+ years and data on 650+ trades per pair.

MrBS:Directional Movement Index [Trend Friend Strategy]This goes with my MrBS:DMI+ indicator. I originally combined them into one, but then you cannot set alerts based on what the ADX and DMI is doing, only strategy alerts, so separate ones have more flexibility and uses.
Indicator Version is found under "MrBS:Directional Movement Index " ()
//// THE IDEA
The majority of profits made in the market come from trending markets. Of course there are strategies that would say otherwise but for the majority of people, THE TREND IS YOUR FRIEND (until the end). The idea is to follow the trend, entering once it has established its self and exiting positions when the trend weakens. This strategy gives a rough idea of the returns produced from following purely the ADX signals. At first Heikin Ashi values were used for the calculation but the results show it's not that effective. The functionality to switch between calculation types has been left in, so we can uses HA candle data to generate signals from while looking at an OHLC chart, if we want to experiment. Due to the way strategies work, we are unable to get reliable results when running the strategy on the HA chart even if we are calculating the signals from the real OHLC values. It is best to always run strategies on standard charts.
When using this strategy, I look for confirmation of the signal based on stochastic (14:3:6) direction, reversal level of stochastic, and divergance, to add confidence and adjust position size accordingly. I am going to try and code some version of that in future updates, if anyone can help or has suggestions please drop me a message.
//// INDICATOR DETAILS
- The default settings are for optimized Daily charts, for 4 hour I would suggest a smoothing of 2.
- The default values used for calculation are the Real OHLC, we can change this to Heikin Ashi in the menu.
- The strategy enters a position when ADX crosses the threshold level, and closes the position when ADX starts to fall.
- There is a signal filter in the form of a 377 period Hull Moving Average, which the price must be above or bellow for long and short positions respectively.
- The strategy closes the position when a cross-under of the ADX and its 4 period EMA. This is an attempt to stay into positions longer as sometimes the ADX will fall for 1 bar and then keep rising, while the overall trend is strong. The downside to this is that we exit trades later and this affects our max drawdown.

Bull Call Spread Entry StrategyThis strategy script uses the "Spread Entry Strength" overlay indicator script I designed to show entry timing optimized for an Option Bull
Call Spread.
As for this strategy...
The defaults for the strategy itself are as follows:
Period for strategy: 1/1/18 to 12/1/2021. This can be changed to a different period using the settings.
Condition for entry:
Bull Spread Entry Strength >= "Overlay Signal Strength Level"
Limit entry is used, price must be <= close when signaled
Entry occurs by next day or the order is cancelled
Condition for exit (uses a timed exit):
Bars passed since order entry >= 30 (6 weeks..~42 calendar days)
Thursday (day before "option" expiration date... assuming weekly options exist)
All of the user settings from the overlay are pulled into this for customization purposes. Details of the actual Spread Entry Strength overlay are as follows (copied from my shared indicator):
2 background shadings will occur:
The background will shade blue if the ticker is prime for a Bullish Call spread.
The background will shade purple if the the ticker is prime for a Bearish Put spread.
In theory, if the SE Strength is at one of the extremes of the Bear or Bull side, then a spread is prime for entry.
To calculate this, 8 conditions receive a 1 or zero dependent on whether the condition is true (1) or false (0), and then all of those are summed. The primary gist of the strength comes from Nishant's book, or my interpretation thereof, with some additives that limits what I need to review (such as condition 8 below.)
The 8 Bull Conditions are:
1) Bollinger Bands are outside of the Keltner Channels
2) ADX is trending up
3) RSI is trending up
4) -DI is trending down
5) RSI is under 30
6) Price is below the lower Keltner Channel
7) Price is between the lower Bollinger Band and the Bollinger basis.
8) Price at one point within the last 5 bars was below the lower Bollinger Band
The 8 Bear Conditions are the inverse conditions (except the first):
1) Bollinger Bands are outside of the Keltner Channels
2) ADX is trending down
3) RSI is trending down
4) +DI is trending up
5) RSI is over 70
6) Price is above the upper Keltner Channel
7) Price is between the upper Bollinger Band and the Bollinger basis.
8) Price at one point within the last 5 bars was above the upper Bollinger Band
There is a "market noise" filter that will filter out shading when another market move is considered, i.e. if you don't want to see the potential trade when QQQ moves more than 1% then do the following in the settings:
Check "Market Filter"
Enter QQQ in the "Market Ticker To Use"
Enter 1 in the "Market Too Hot Level"
Press Ok
Obviously, the same holds true for the "Market Too Cool Filter."
Second release notes:
Overlay Signal Strength Level - You can set your own "level" for the overlay in the settings, instead of having to change the script code itself. I have the default set to 6. A lower number shows more overlays, a higher number shows fewer (i.e. more conditions have been met.).
Provide Narrative (Troubleshooting) - Narrative label created with several outputs that will show after the last bar. This narrative needs to be turned on in the settings, as the default is "off" ... unchecked.
Remove Strength Indicator When Squeezed - when checked no overlays will be produced regardless of "scoring." Default is off.
Show Squeezes (Will Override Indicator When Concurrent) - overlays an orange background when the ticker is in a squeeze. I am still working on the accuracy here, but it's usable. This will override the strength indicator as well. This needs to be turned on, if you want it.
Short SMA Period - period used to calculate the short SMA, used in the narrative only, at this point in time.
Medium SMA Period - period used to calculate the medium SMA, used in the narrative only, at this point in time.
Long SMA Period - period used to calculate the medium SMA, used in the narrative only, at this point in time.
Outside of the settings... a few calculation adjustments here and there have occurred and some color shading adjustments to allow for the adjustable level setting.

Quansium Series A BacktestThis comes with preconfigured setups or strategies. Simply choose one from our list based on the timeframe it was made for. Leverage can be changed; to keep trading safe, a maximum of 2 is allowed. In our findings, this was able to trade crypto (specifically BTC ), MES (Micro E-mini S&P 500 Index Futures ), and stocks. It is important to know that setups A, B, C, and D use variable position sizing, and dynamic stop loss/trailing stop/take profit, these parameters are provided through the alerts. The rest of the strategies were created with a simpler approach in mind, just plainly entry/exits signals.
Quansium as a framework:
Price reformat: we take the price source (Open, Close, High, Low) and remove any noise that affects the accuracy of our signals.
Time awareness: we take several time periods of the data on the chart such as start, end, and whole. We use this to add more depth to our signals.
Position size: our backtest tries to recreate as much as the real world trades as possible so our position is determined by the current equity. We also use the volatility of the market to increase or decrease our exposure or risk.
Risk awareness: stop loss, take profit, trailing stop are the risk exits we use to provide our users some peace of mind. These parameters are totally dynamic and follow the same behavior of the market.
Signals filtering: to make almost non-existent any errors and increase the quality of our trades, our indicators go through multiple phases, this avoid double entries or early exits, and help maintain a record of what has transpired and what’s currently taking place.
Indicators: whenever we can we use custom code or our own functions instead of the defaults ones provided. This gives us total control of what we’re trying to achieve. In many cases we tend to combine several indicators’ logic into one creating a more personalized take on it.
Easiness: since we started our main goal has been to provide the easiest and fastest way to alerts’ creation. It has taken us years to reach this level where now we already provide a list of preset strategies so the user doesn’t have to spend much time tinkering with scripts and more on other matters, because we know life is more than just trading.
Raw signals: we provide the option to turn off as much of our advanced features such as stop loss, take profit, trailing stop, dynamic sizing, etc, etc for a simple approach. Trade signals still go through the signals filtering method mentioned above,
Timeframe pairing: we take trading very seriously, by no way we’ll want the user to lose money (although such thing is expected because past results aren’t an indicative of futures ones), through years of experience we have found what are usually common mistakes the user makes, this feature allows us to only activate the strategy if the right timeframe is chosen.
Trend filters: through the years we have improved the arts of the trend. We like to keep things simple but yet powerful. We observe the macro and micro trend of the security. This helps confirm we are entering at the desirable timing. We also incorporate volume and volatility into decision making, we simply programmed it to trade when these are increasing and higher than the average values observed in both the short and long term. Finally we take into account the strength of the pair to make our final choice of whether to enter or wait, and if anything flashes contrary movement then we cancel the upcoming signal and stop monitoring until the next one comes along.
Full automated risk: stop loss, take profit, and trailing stops usually are set in percentages, and optimized even more using the current market behavior to become more adaptive. But always remains some sort of fixation, so the user must choose a value somewhere. This is where our framework shines the most, as previously mentioned before when we take time into our calculations, we use several periods to observe performance and get values that keep our risk exits natural and closest to the flow of the market itself.
Setups:
A: Centered oscillator with the difference of several moving averages with more sensitive settings. Momentum focused.
B: Centered oscillator using simple moving averages. Trend-Following focused.
C: Centered oscillator using smoothed data with the help of faster moving averages. Trend-Following focused.
D: Centered oscillator with the difference of several moving averages with less sensitive settings. Trend-Following focused.
E: Centered oscillator with the difference of moving averages where the standard deviation is applied first. It uses less sensitive settings. Trend-Following focused.
F: Finds the relationship between multiple readings of the price’s relative strength to better pin-point downs and ups. Trend-Following focused.
G: Centered oscillator with the difference of moving averages where the standard deviation is applied first. It uses more sensitive settings. Momentum focused.
H: Multiple centered oscillators using various moving averages. Trend-Following focused.
I: Centered oscillator using simple moving averages. Momentum focused.
Note: The framework is composed of almost 1000 lines of code as compared to each indicator that makes up the setup which is around 10. The power from Quansium doesn't come from the strategies themselves but rather the overall system that turns simple signals into complex and advanced trades.
Strategy Tester:
Initial Capital: chosen value is $20,000, as an approximate to Bitcoin’s ATH (All-Time High). In previous iterations we noticed some trades won’t go through if the capital was less than the ATH.
Order Size: 100% of equity (although the script controls this, and this is of no regards to the results).
Pyramiding: 1, system doesn’t place multiple entries in a row, only one at a time.
Commission: This simulates order execution with custom trading fees. Commissions are turned off by default because this script works in various markets and each operates differently. In order to reach results that are close to real world conditions, it is imperative the user fills this based upon their broker or exchange data.
When we started, we were focused on finding the best indicator, or creating it ourselves. After years we came to realize that the secret is not in which indicator you use but the framework behind it. All strategies have bad, good, best, worst performance periods. The key of a good system is to help keep you safe when it’s down and maximize your potential when it’s up. We hope this material at the very minimum inspires you to keep going and not lose faith, because it is not the smartest who win but those who persevere.

A Physicist's Bitcoin Trading Strategy
1. Summary
This strategy and indicator were designed for, and intended to be used to guide trading activity in, crypto markets, particularly Bitcoin. This strategy uses a custom indicator to determine the state of the market (bullish vs bearish) and allocates funds accordingly. This particular variation also uses the custom indicator to determine when the market is significantly oversold and takes advantage of the opportunity (it buys the dip). The specific mathematical formula that is used to calculate the underlying custom indicator allows the trader to get in before, or near the start of, the bull trends, and get out before the bear trends. The strategy's properties dialogue box includes many display settings and parameters for optimization and customization to meet the user's needs and risk tolerance; this is both a tool to gauge the market, as well as a trading strategy to beat the market. Guidelines for parameter settings are provided. A sample dataset of backtest results using randomized parameters, both within the guidelines and outside the guidelines, is available upon request; notably, all trials outperformed the intended market (Bitcoin) during the 9-year backtest period.
2. The Indicator and Strategy
2.1. The Indicator
A mathematical formula is used to determine the state of the market according to three different "frequencies", which, for lack of better terminology, are called fast, moderate, and slow indicators. There are two parameters for each of the three indicators, one called response time and the other is a simple look-back period. Finally, four exponential moving averages are used to smooth each indicator. In total, there are 18 different levels of bullishness/bearishness. The purpose of using three indicators, rather than one, is to capture the full character of the market, from a macro/global scope down to a micro/local scope. I.e. the full indicator looks at the forest, the trees, and the branches, simultaneously.
2.2. The Strategy
The trend-trading strategy is very simple; there are only four types of orders: 1) The entire position (e.g. all bitcoins held) is sold (if it hasn't already been totally sold) when the indicator becomes maximally bearish, 2) When the movement of the indicator is in the bullish direction, the strategy dollar-cost-average (DCA) buys at an exponentially decreasing rate, i.e. it buys more in the early stages of the transition from bear->bull. 3) When the indicator is maximally bullish, it goes "all-in" † (if it hasn't already gone all-in), i.e. it converts all available cash into the underlying security/token. And, 4) when the movement of the indicator is in the bearish direction, the strategy DCA sells (again, exponentially decreasing) to get out quickly. No leverage is used in this strategy. The strategy never takes a short position.
A second "buy-the-dip" strategy is also used, and it is the synergy of these two strategies, together, that is responsible for most of the outperformance in the backtests (this strategy handily beats the non-dip-buying variation in backtests). To do this, the custom indicator is used to determine when the market is significantly oversold on a short-term basis, and the strategy responds by DCA buying. However, unlike the DCA buying during bull/bear transitions, the buy-the-dip DCA buying increases with time. Specifically, within each candle that is short-term oversold, the strategy converts 10% x # of candles since becoming oversold (up to a max of 6 candles) of available cash into the underlying security/token. I.e. the first buy is 10% of available cash and occurs in the first oversold candle, the second buy is 20% of available cash and occurs in the second oversold candle, etc. up to six consecutive oversold candles. Lastly, to ensure no conflicting orders and no leverage (buying more than what is affordable with the available cash in the fund), buy-the-dip orders take precedence over the trend-trading orders enumerated in the previous paragraph.
† Technically the strategy goes 99.5% in when it goes "all-in". This is to ensure no leverage is used given that there may be a commission of 0.5%.
3. Backtest Results
Backtest results demonstrate significant outperformance over buy-and-hold. The default parameters of the strategy/indicator have been set by the author to achieve maximum (or, close to maximum) outperformance on backtests executed on the BTCUSD (Bitcoin) chart. However, significant outperformance over buy-and-hold is still easily achievable using non-default parameters. Basically, as long as the parameters are set to adequately capture the full character of the market, significant outperformance on backtests is achievable and is quite easy. In fact, after some experimentation, it seems as if underperformance hardly achievable and requires deliberately setting the parameters illogically (e.g. setting one parameter of the slow indicator faster than the fast indicator). In the interest of providing a quality product to the user, suggestions and guidelines for parameter settings are provided in section (6). Finally, some metrics of the strategy's outperformance on the BTCUSD chart are listed below, both for the default (optimal) parameters as well as for a random sample of parameter settings that adhere to the guidelines set forth in section (6).
Using the default parameters, relative to buy-and-hold strategy, backtested from August 2011 to August 2020,
Total cumulative outperformance (total return of strategy minus total return of buy-n-hold): 13,000,000%.
Rolling 1-year outperformance: mean 318%, median 84%, 1st quartile 55%, 3rd quartile, 430%.
Rolling 1-month outperformance: mean 2.8% (annualized, 39%), median -2.1%, 1st quartile -7.7%, 3rd quartile 13.2%, 10th percentile -13.9%, 90th percentile 24.5%.
Using the default parameters, relative to buy-and-hold strategy, during specific periods,
Cumulative outperformance during the past year (August 2019-August 2020): 37%.
12/17/2016 - 12/17/2017 (2017 bull market) absolute performance of 2563% vs buy-n-hold absolute performance of 2385%
11/29/2012 - 11/29/2013 (2013 bull market) absolute performance of 14033% vs buy-n-hold absolute performance of 9247%
Using a random sample (n=20) of combinations of parameter settings that adhere to the guidelines outlined in section (6), relative to buy-and-hold strategy, backtested from August 2011 to August 2020,
Average total cumulative outperformance, from August 2011 to August 2020: 2,000,000%.
Median total cumulative outperformance, from August 2011 to August 2020: 1,000,000%.
4. Limitations
This strategy is basically a DCA-swing trading strategy, and as such it is intended to be used on the 6-hr chart. Similar performance is expected on daily chart, 12-hr chart, and 4-hr chart, but performance is likely to be limited when used on charts of shorter time-frames. However, due to the flexibility afforded by the large quantity of parameters, as well as the tools included, it may be possible to tweak the indicator settings to get some outperformance on smaller time-frames. Admittedly, the author did not spend much time investigating this.
As is apparent in the backtests, this strategy has very limited absolute performance during large bear markets, such as Bitcoin's 2018 bear market. As described, it does outperform the underlying security by a large amount in backtests, but a large absolute return is unlikely during large and prolonged declines (unless, of course, your unit of account is the underlying token, in which case an outperformance of the underlying is, by definition, an absolute positive return).
This strategy is likely to underperform if used to trade ETFs of broad equity markets. This strategy may produce a small amount of outperformance when used to trade precious metals ETFs, given that the parameters are set optimally by the user.
5. Use
The default parameters have already been set for highly optimal backtest results on the chart of BTCUSD (Bitcoin / US Dollar BITSTAMP), (although, a different combination of parameter settings may yet produce better results). Still, there is a great number of combinations that can be explored, so the user is free to tweak the settings to meet his/her/their needs. Some display options are provided to give the user a visual aid while tweaking the parameters. These include a blue/red background display of the custom indicator, a calibration system, and options to display information about the backtest results. The background pattern represents the various levels of bullishness/bearishness as semi-transparent layers of blue and red, with blue corresponding with bullish and red corresponding with bearish.
The parameters that affect the indicator are the response times, the periods, and some EMA lengths. The parameters that affect the quantity of contracts (tokens/shares/bitcoins/etc) to be bought/sold are the transitionary buy/sell rates. There are also two sets of date parameters.
The response time and period parameters are direct inputs into the underlying math formula and are used to create the base-level indicators (fast, moderate, and slow). The response times control the speed of each of the three indicators (shorter is fast, longer is slower) and the period controls how much historical data is used in computation. Information about how these should be set are included in section (6). Another set of parameters control EMA look-back periods that serve to smooth the base-level indicators. Increasing these EMA lengths makes the overall indicator less sensitive to short-term price action, while reducing them does the opposite. The effect of these parameters are obvious when the background blue/red visualization is displayed. Another EMA length is an EMA for the entire indicator. Increasing this parameter reduces the responsiveness of the trading strategy (buy/sell orders) to quick/small changes of the overall level of the indicator, so as to avoid unnecessary buying and selling in times of relatively small and balanced price perturbations. Note, changing this parameter does not have an effect on the overall indicator itself, and thus will not affect the blue/red background representation.
The transitionary buy/sell rates control the portion of the available asset to be converted to the other. E.g. if the buy rate is set to 90%, then 90% of the available cash will be used to buy contracts/tokens/shares/bitcoins during transitions bullish transitions, e.g. if the available cash at the start of the bullish transition is $10,000 and the parameter is set to 90%, then $9,000 will be used to buy in the first candle during which the transition is bullish, then $900 will be used to buy in the second candle, then $90 in the third candle, etc.
There are two dates that can be set. The first is the date at which the strategy goes all in. This is included because the buy-and-hold strategy is the benchmark against which this strategy is compared, so setting this date to some time before the strategy starts to make trades will show, very clearly, the outperformance of the strategy, especially when the initial capital parameter in the Properties tab is equal to the price of one unit of the underlying security on the date that is set, e.g. all-in on Bitcoin on 8/20/2011 and set initial capital to the BTCUSD price on that date, which was $11.70. The second date is a date to control when the strategy can begin to place trades.
Finally (actually, firstly in the Inputs dialogue box), a set of checkbox inputs controls whether or not the backtest is on or off, and what is displayed. The display options are the blue/red (bull/bear) background layers †, a set of calibrators, a plot of the total strategy equity, a plot of the cash position of the strategy, a plot of the size of the position of the strategy in contracts/shares/units (labeled as BTC position), and a plot of the rolling 1-year performances of buy-and-hold and the strategy.
About the calibrators: The calibration system allows the user to quickly assess and calibrate how well the indicator... indicates. Quite simply, the system has two parts: one plot that is the cumulative sum of the product of the indicator level and the change in the underlying price, i.e. sum of ‡, over all candles. The second part is a similar plot that is reduced according to the quickness with which the indicator changes, i.e. sum of . Maximizing the first plot at the expense of the second will cause the indicator to match the price action very well but therefore it will change very rapidly, from bullish to bearish, which is visualized by a background pattern that changes frequently from blue to red to blue. Ignoring the first plot and maximizing the second will also cause the indicator to more closely match the price action, but the transitions will be slower and less frequent, and will therefore focus on identifying the major trends of the market.
† The blue/red background has many layers and will make the chart lag as the user interacts with it.
‡ Bearish states are coded as negative quantities, so a bearish state x negative price action = positive number, and bullish state x positive price action = positive number.
6. Suggestions and Guidelines
As described in section (2.1), the indicator used in this strategy was designed to determine the state of the market--whether it is bullish or bearish--as well as the change in the state of the market--whether it is increasingly bullish or increasingly bearish. As such, the following suggestions are provided based on the principles of the indicator's design,
1. Response Time 1 should be less than (<) Response Time 2 which should be < Response Time 3
2. Fast Period < Moderate Period < Slow Period
3. In terms of the period of a full market cycle (e.g. ~ 4 years for BTC, ~ 5.5 years for equities, etc.), response times 1, 2, and 3 should be about 0.3% to 1%, 3% to 20%, and 20% to 50% of a full market cycle period, respectively. However, this is a loose guideline.
4. In terms of the period of a full market cycle, periods 1, 2, and 3 should all be about 25% to 75% of a full cycle period. Again, this is a loose guideline.
4. EMA 1 Length < EMA 2 Length < EMA 3 Length < EMA 4 Length
5. EMA Lengths 1, 2, 3, and 4 should be limited to about 1/4th the length of a full market cycle. Note, EMA lengths are measured in bars (candles), not in days. 1/4th of 1000 days is 250 days which is 250 x 4 = 1000 6-hr candles.
The following guidelines are provided based on results of over 100 backtests on the BTCUSD chart using randomized parameters †,
1. 9 days < Response Time 1 < 14 days
2. 5 days < EMA 1 Length < 100 days
3. 600 days < EMA 4 length < 1000 days
4. The ratio of the EMA range (EMA 4 len - EMA 1 len) to the sum of EMA lengths (EMA 1 len + EMA 2 len + ...) be greater than 0.4
5. The ratio of the sum of EMA 1 and EMA 2 lengths to the sum of EMA 3 and EMA 4 lengths be less than 0.3.
A suggestion from the author: Given that backtests show a high degree of outperformance using the guidelines enumerated above, a good trading strategy may be to not rely on any one particular combination of parameters. Rather, a random set of combinations of parameter settings that adhere to the guidelines above could be used to create multiple instances of the strategy in a TradingView chart, each of which varies by a small amount due to their unique parameter settings. The proportion of the entire set of strategy instances that agree about the current state of the market could indicate to the trader the level of confidence of the indicator, in aggregate.
† A sample dataset of backtest results using randomized parameters is available upon request; notably, all trials outperformed the intended market (Bitcoin).
7. General Remarks About the Indicator
Other than some exponential moving averages, no traditional technical indicators or technical analysis tools are employed in this strategy. No MACD, no RSI, no CMF, no Bollinger bands, parabolic SARs, Ichimoku clouds, hoosawatsits, XYZs, ABCs, whatarethese. No tea leaves can be found in this strategy, only mathematics. It is in the nature of the underlying math formula, from which the indicator is produced, to quickly identify trend changes.
8. Remarks About Expectations of Future Results and About Backtesting
8.1. In General
As it's been stated in many prospectuses and marketing literature, "past performance is no guarantee of future results." Backtest results are retrospective, and hindsight is 20/20. Therefore, no guarantee can, nor should, be expressed by me or anybody else who is selling a financial product (unless you have a money printer, like the Federal Reserve does).
8.2. Regarding This Strategy
No guarantee of future results using this strategy is expressed by the author, not now nor at any time in the future.
With that written, the author is free to express his own expectations and opinions based on his intimate knowledge of how the indicator works, and the author will take that liberty by writing the following: As described in section (7), this trading strategy does not include any traditional technical indicators or TA tools (other than smoothing EMAs). Instead, this strategy is based on a principle that does not change, it employs a complex indicator that is based on a math formula that does not change, and it places trades based on five simple rules that do not change. And, as described in section (2.1), the indicator is designed to capture the full character of the market, from a macro/global scope down to a micro/local scope. Additionally, as described in section (3), outperformance of the market for which this strategy was intended during backtesting does not depend on luckily setting the parameters "just right." In fact, all random combinations of parameter settings that followed the guidelines outperformed the intended market in backtests. Additionally, no parameters are included within the underlying math formula from which the indicator is produced; it is not as if the formula contains a "5" and future outperformance would depend on that "5" being a "6" instead. And, again as described, it is in the nature of the formula to quickly identify trend changes. Therefore, it is the opinion of the author that the outperformance of this strategy in backtesting is directly attributable to the fundamental nature of the math formula from which the indicator is produced. As such, it is also the opinion of the author that continued outperformance by using this strategy, applied to the crypto (Bitcoin) market, is likely, given that the parameter settings are set reasonably and in accordance with the guidelines. The author does not, however, expect future outperformance of this strategy to match or exceed the outperformance observed in backtests using the default parameters, i.e. it probably won't outperform by anything close to 13,000,000% during the next 9 years.
Additionally, based on the rolling 1-month outperformance data listed in section (3), expectations of short-term outperformance should be kept low; the median 1-month outperformance was -2%, so it's basically a 50/50 chance that any significant outperformance is seen in any given month. The true strength of this strategy is to be out of the market during large, sharp declines and capitalizing on the opportunities presented at the bottom of those declines by buying the dip. Given that such price action does not happen every month, outperformance in the initial months of use is approximately as likely as underperformance.
9. Access
Those who are interested in using this strategy may send a personal message to inquire about how to gain access. Those who are interested in acquiring the sample dataset of backtest results may send a personal message to request a copy of the data.

Combo Backtest 123 Reversal & EMA & MA Crossover This is combo strategies for get a cumulative signal.
First strategy
This System was created from the Book "How I Tripled My Money In The
Futures Market" by Ulf Jensen, Page 183. This is reverse type of strategies.
The strategy buys at market, if close price is higher than the previous close
during 2 days and the meaning of 9-days Stochastic Slow Oscillator is lower than 50.
The strategy sells at market, if close price is lower than the previous close price
during 2 days and the meaning of 9-days Stochastic Fast Oscillator is higher than 50.
Second strategy
The Moving Average Crossover trading strategy is possibly the most popular
trading strategy in the world of trading. First of them were written in the
middle of XX century, when commodities trading strategies became popular.
This strategy is a good example of so-called traditional strategies.
Traditional strategies are always long or short. That means they are never
out of the market. The concept of having a strategy that is always long or
short may be scary, particularly in today’s market where you don’t know what
is going to happen as far as risk on any one market. But a lot of traders
believe that the concept is still valid, especially for those of traders who
do their own research or their own discretionary trading.
This version uses crossover of moving average and its exponential moving average.
WARNING:
- For purpose educate only
- This script to change bars colors.

Psychological for Strategy testingHello everyone
I've made Psychological to be able to adjust some variables for strategy.
When you adjust each parameter of the settings, the strategy tester also comes to work in conjunction with.
so please find your best parameter! ^^
I'm not very good at English, so i really want to write how to use Pychological's entry and exit too ,but please look up psychological entries as they are well known.
Notice:
There may be some programming mistakes, so please take your own responsibility when actually investing.
XPloRR S&P500 Stock Market Crash Detection Strategy v2XPloRR S&P500 Stock Market Crash Detection Strategy v2
Long-Term Trailing-Stop strategy detecting S&P500 Stock Market Crashes/Corrections and showing Volatility as warning signal for upcoming crashes
Detecting or avoiding stock market crashes seems to be the 'Holy Grail' of strategies.
Since none of the strategies that I tested can beat the long term Buy&Hold strategy, the purpose was to detect a stock market crash on the S&P500 and step out in time to minimize losses and beat the Buy&Hold strategy. So beat the Buy&Hold strategy with around 10 trades. 100% capitalize sold trade into new trade.
With the default parameters the strategy generates 10262% profit (starting at 01/01/1962 until release date), with 10 closed trades, 100% profitable, while the Buy&Hold strategy only generates 3633% profit, so this strategy beats the Buy&Hold strategy by 2.82 times !
Also the strategy detects all major S&P500 stock market crashes and corrections since 1962 depending on the Trailing Stop Smoothness parameter, and steps out in time to cut losses and steps in again after the bottom has been reached. The 5 major crashes/corrections of 1987, 1990, 2001, 2008 and 2010 were successfully detected with the default parameters.
The script was first released on November 03 2019 and detected the Corona Crash on March 04 2020 with a Volatility crash-alert and a Sell crash-alert.
I have also created an Alerter Study Script based on the engine of this script, which generates Buy, Sell and Volatility signals.
If you are interested in this Alerter version script, please drop me a mail.
The script shows a lot of graphical information:
the Close value is shown in light-green. When the Close value is temporarily lower than the Buy value, the Close value is shown in light-red. This way it is possible to evaluate the virtual losses during the current trade.
the Trailing Stop value is shown in dark-green. When the Sell value is lower than the Buy value, the last color of the trade will be red (best viewed when zoomed)
the EMA and SMA values for both Buy and Sell signals are shown as colored graphs
the Buy signals are labeled in blue and the Sell signals are labeled in purple
the Volatility is shown below in green and red. The Alert Threshold (red) is default set to 2 (see Volatility Threshold parameter below)
How to use this Strategy?
Select the SPX (S&P500) graph and add this script to the graph.
Look in the strategy tester overview to optimize the values Percent Profitable and Net Profit (using the strategy settings icon, you can increase/decrease the parameters), then keep using these parameters for future Buy/Sell signals on the S&P500.
More trades don't necessarily generate more overall profit. It is important to detect only the major crashes and avoid closing trades on the smaller corrections. Bearing the smaller corrections generates a higher profit.
Watch out for the Volatility Alerts generated at the bottom (red). The Threshold can by changed by the Volatility Threshold parameter (default=2% ATR). In almost all crashes/corrections there is an alert ahead of the crash.
Although the signal doesn't predict the exact timing of the crash/correction, it is a clear warning signal that bearish times are ahead!
The correction in December 2018 was not a major crash but there was already a red Volatility warning alert. If the Volatility Alert repeats the next weeks/months, chances are higher that a bigger crash or correction is near. As can be seen in the graphic, the deeper the crash is, the higher and wider the red Volatility signal goes. So keep an eye on the red flag!
Here are the parameters:
Fast MA Buy: buy trigger when Fast MA Buy crosses over the Slow MA Buy value (use values between 10-20)
Slow MA Buy: buy trigger when Fast MA Buy crosses over the Slow MA Buy value (use values between 21-50)
Minimum Buy Strength: minimum upward trend value of the Fast MA Buy value (directional coefficient)(use values between 10-100)
Fast MA Sell: sell trigger when Fast MA Sell crosses under the Slow MA Sell value (use values between 10-20)
Slow MA Sell: sell trigger when Fast MA Sell crosses under the Slow MA Sell value (use values between 21-50)
Minimum Sell Strength: minimum downward trend value of the Fast MA Sell value (directional coefficient)(use values between 10-100)
Trailing Stop ATR: trailing stop % distance from the smoothed Close value (use values between 2-20)
Trailing Stop Smoothness: MA value for smoothing out the Trailing Stop close value
Buy On Start Date: force Buy on start date even without Buy signal (default: true)
Sell On End Date: force Sell on end date even without Sell signal (default: true)
Volatility EMA Period: MA value of the Volatility value (default 15)
Volatility Threshold: Threshold value to change volatility graph to red (default 2)
Volatility Graph Scaler: Scaling of the volatility graph (default 5)
Important : optimizing and using these parameters is no guarantee for future winning trades!

Bollinger Bands BAT/USDT 30minThis is ready to use Bollinger Band strategy that was backtested on the data from the previous year 2019.
The main purpose of this strategy is to determine trades with the highest probability of success, to keep a consistent portfolio growth throughout the year. This strategy cherry-picks the most reliable points of entry on a particular timeframe (30m) for the particular asset (BAT/USDT). The backtest shows a great result of 78.95% profitability with the maximum drawdown of -4.02%. This is one of my strategies out of the group of automated strategies that helps to grow my portfolio steadily.
You are welcome to change inputs and backtest the following strategy. Any comments or ideas would be appreciated.
If you are happy with existing results and would like to automate the strategy, which can be done through alerts, then you need to convert it to study and add alerts in the code.
Let me know if you are interested in that and I will create a study based on this strategy.

Strategy VS Buy & HoldSUMMARY:
A strategy wrapper that makes a detailed and visual comparison between a given strategy and the buy & hold returns of the traded security.
DESCRIPTION:
TradingView has a "Buy & Hold Return" metric in the strategy tester that is often enough to assess how our strategy compares to a simple buy hold. However, one may want more information on how and when your strategy beats or is beaten by a simple buy & hold strategy. This script aims to show such detail by providing a more comprehensive metrics and charting the profit/loss of the given strategy against buy & hold.
As seen in the script, it plots/draws 4 elements:
1) Strategy P/L: strategy net profit + strategy open profit
2) Buy & Hold P/L: unrealized return
3) Difference: Strategy P/L - Buy & Hold P/L
4) Strategy vs Buy Hold Stats
> Percent of bars strategy P/L is above Buy & Hold
> Percent of bars strategy P/L is below Buy & Hold
> All Time Average Difference
ADJUSTABLE PARAMETERS:
All labels/panels can be disabled by unchecking these two options:
>bnh_info_panel = input(true, title='Enable Info Panel')
>bnh_indicator_panel = input(true, title='Enable Indicator Panel')
Comparison Date Range can be changed to better isolate specific areas:
>From Year, From Month, From Day
default: 1970 01 01
>To Year, To Month, To Day
default: 2050 12 31
Default settings basically covers all historical data.
HOW TO USE:
The default script contains a simple 50-200 SMA cross strategy, just delete and replace it. Those are everything between these lines:
/////////////////////////////////////////////////////////////////////////////////////
//////////////////////////////STRATEGY SCRIPT START//////////////////////////////////
(STRATEGY SCRIPT GOES HERE)
//////////////////////////////STRATEGY SCRIPT END////////////////////////////////////
/////////////////////////////////////////////////////////////////////////////////////
Removing all plots and drawings from your strategy is advisable.
If you are going to use the Comparison Date Range, apply "bnh_timeCond" to your strategy to align the dates. A sample on how it’s applied can be seen on the Placeholder MA cross strategy.
Note: bnh_timeCond returns a boolean series
