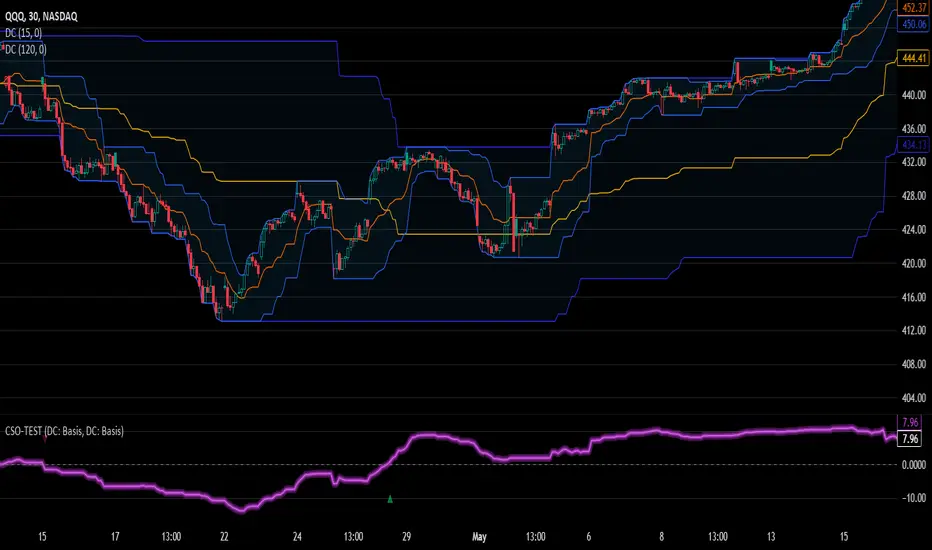
Custom Signal Oscillator StrategyThe CSO is made to help traders easily test their theories by subtracting the difference between two customizable plots(indicators) without having to search for strategies. The general purpose is to provide a tool to users without coding knowledge.
How to use :
Apply the indicator(s) to test
Go to the CSO strategy input settings and select the desired plots from the added indicators. (The back test will enter long or short depending on the fast signal crosses on the slow signal)
Pull up the strategy tester
Adjust the input settings on the selected indicator(s) to back test
For example, the published strategy is using the basis lines from two Donchian channels with varying length. This can be utilized with multiple overlays on the chart and oscillators that are operating on the same scale with each other. Since chart glows aren't extremely common, a glow option is included to stand out on the chart as the chain operator. A long only option for is also included for versatility.
Cari dalam skrip untuk "the strat"
BBTrend w SuperTrend decision - Strategy [presentTrading]This strategy aims to improve upon the performance of Traidngview's newly published "BB Trend" indicator by incorporating the SuperTrend for better trade execution and risk management. Enjoy :)
█Introduction and How it is Different
The "BBTrend w SuperTrend decision - Strategy " is a trading strategy designed to identify market trends using Bollinger Bands and SuperTrend indicators. What sets this strategy apart is its use of two Bollinger Bands with different lengths to capture both short-term and long-term market trends, providing a more comprehensive view of market dynamics. Additionally, the strategy includes customizable take profit (TP) and stop loss (SL) settings, allowing traders to tailor their risk management according to their preferences.
BTCUSD 4h Long Performance
█ Strategy, How It Works: Detailed Explanation
The BBTrend strategy employs two key indicators: Bollinger Bands and SuperTrend.
🔶 Bollinger Bands Calculation:
- Short Bollinger Bands**: Calculated using a shorter period (default 20).
- Long Bollinger Bands**: Calculated using a longer period (default 50).
- Bollinger Bands use the standard deviation of price data to create upper and lower bands around a moving average.
Upper Band = Middle Band + (k * Standard Deviation)
Lower Band = Middle Band - (k * Standard Deviation)
🔶 BBTrend Indicator:
- The BBTrend indicator is derived from the absolute differences between the short and long Bollinger Bands' lower and upper values.
BBTrend = (|Short Lower - Long Lower| - |Short Upper - Long Upper|) / Short Middle * 100
🔶 SuperTrend Indicator:
- The SuperTrend indicator is calculated using the average true range (ATR) and a multiplier. It helps identify the market trend direction by plotting levels above and below the price, which act as dynamic support and resistance levels. * @EliCobra makes the SuperTrend Toolkit. He is GOAT.
SuperTrend Upper = HL2 + (Factor * ATR)
SuperTrend Lower = HL2 - (Factor * ATR)
The strategy determines market trends by checking if the close price is above or below the SuperTrend values:
- Uptrend: Close price is above the SuperTrend lower band.
- Downtrend: Close price is below the SuperTrend upper band.
Short: 10 Long: 20 std 2
Short: 20 Long: 40 std 2
Short: 20 Long: 40 std 4
█ Trade Direction
The strategy allows traders to choose their trading direction:
- Long: Enter long positions only.
- Short: Enter short positions only.
- Both: Enter both long and short positions based on market conditions.
█ Usage
To use the "BBTrend - Strategy " effectively:
1. Configure Inputs: Adjust the Bollinger Bands lengths, standard deviation multiplier, and SuperTrend settings.
2. Set TPSL Conditions: Choose the take profit and stop loss percentages to manage risk.
3. Choose Trade Direction: Decide whether to trade long, short, or both directions.
4. Apply Strategy: Apply the strategy to your chart and monitor the signals for potential trades.
█ Default Settings
The default settings are designed to provide a balance between sensitivity and stability:
- Short BB Length (20): Captures short-term market trends.
- Long BB Length (50): Captures long-term market trends.
- StdDev (2.0): Determines the width of the Bollinger Bands.
- SuperTrend Length (10): Period for calculating the ATR.
- SuperTrend Factor (12): Multiplier for the ATR to adjust the SuperTrend sensitivity.
- Take Profit (30%): Sets the level at which profits are taken.
- Stop Loss (20%): Sets the level at which losses are cut to manage risk.
Effect on Performance
- Short BB Length: A shorter length makes the strategy more responsive to recent price changes but can generate more false signals.
- Long BB Length: A longer length provides smoother trend signals but may be slower to react to price changes.
- StdDev: Higher values create wider bands, reducing the frequency of signals but increasing their reliability.
- SuperTrend Length and Factor: Shorter lengths and higher factors make the SuperTrend more sensitive, providing quicker signals but potentially more noise.
- Take Profit and Stop Loss: Adjusting these levels affects the risk-reward ratio. Higher take profit percentages can increase gains but may result in fewer closed trades, while higher stop loss percentages can decrease the likelihood of being stopped out but increase potential losses.

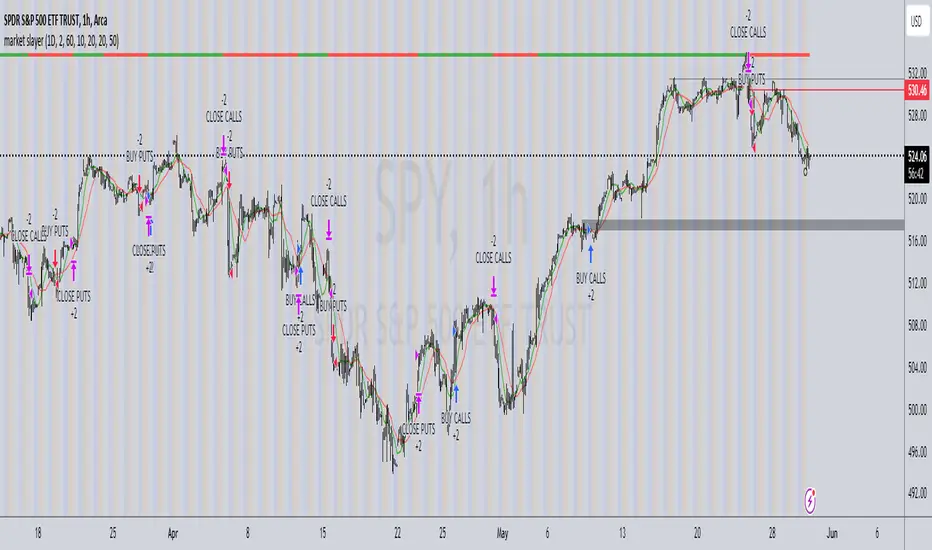
market slayerInput Parameters:
Various input parameters allow customization of the strategy, including options to show trend confirmation, specify trend timeframes and values, set SMA lengths, enable take profit and stop loss, and define their respective values.
Calculations:
Simple Moving Averages (SMAs) are calculated based on the specified lengths.
Buy and sell signals are generated based on the crossover and crossunder of the short and long SMAs.
Confirmation Bars:
Functions are defined to determine bullish or bearish confirmation bars based on certain conditions.
These confirmation bars are used to confirm trend direction and generate additional signals.
Plotting:
SMAs are plotted on the chart.
Trend labels and signal markers are plotted based on the calculated conditions.
Trade Signals:
Buy and sell conditions are defined based on the crossover/crossunder of SMAs and confirmation of trend direction.
Strategy entries and exits are executed accordingly.
Take Profit and Stop Loss:
Optional take profit and stop loss functionality is included.
Trades are automatically closed when profit or loss thresholds are reached.
Closing Trades:
Trades are also closed based on changes in trend confirmation bars to ensure alignment with the overall market direction.
Alerts:
Alert conditions are defined for opening and closing trades, providing notifications when certain conditions are met.
Overall, this script aims to provide a systematic approach to trading by combining moving average crossovers with trend confirmation bars, along with options for risk management through take profit and stop loss orders. Users can customize various parameters to adapt the strategy to different market conditions and trading preferences.
The script uses the request.security() function with the lookahead parameter set to barmerge.lookahead_on to access data from a higher timeframe within the Pine Script on TradingView. Let's break down why it's used:
Higher Timeframe Analysis:
By default, Pine Script operates on the timeframe of the chart it's applied to. However, in trading strategies, it's common to incorporate signals or data from higher timeframes to confirm or validate signals generated on lower timeframes. This helps traders to align their trades with the broader market trend.
Trend Confirmation:
In this script, the confirmationTrendTimeframe parameter allows users to specify a higher timeframe for trend confirmation. The request.security() function fetches the data from this higher timeframe and applies the defined conditions to confirm the trend direction.
Lookahead Behavior:
The lookahead parameter set to barmerge.lookahead_on ensures that the script considers the most up-to-date information available on the higher timeframe when making trading decisions on the lower timeframe. This prevents the script from lagging behind or using outdated data, enhancing the accuracy of trend confirmation.
Usage in confirmationTrendBullish and confirmationTrendBearish:
These variables are assigned the values returned by the request.security() function, which represents the bullish or bearish trend confirmation based on the conditions applied to the data from the higher timeframe.
KumoTrade Ichimoku StrategyThe KumoTrade Ichimoku Strategy is an advanced trading strategy designed to help users identify market trends and potential trading opportunities using the Ichimoku Kinko Hyo technical analysis indicator. This strategy leverages the Ichimoku cloud (Kumo) along with other crucial indicators such as the Tenkan-sen and Kijun-sen lines to generate strong signals.
Main Components of the Strategy:
Tenkan-sen (Conversion Line): Indicates the short-term direction of the price, typically calculated as the average of the highest high and the lowest low over the past 9 periods.
Kijun-sen (Base Line): Indicates the medium-term direction of the price, usually calculated as the average of the highest high and the lowest low over the past 26 periods.
Senkou Span A and Senkou Span B: These two lines form the cloud (Kumo), which projects future support and resistance levels.
Chikou Span (Lagging Span): Plots the current closing price 26 periods back to measure the market's momentum.
Strategy Rules:
Bullish Bias (Bias Bull): Indicates that the prices are in a long-term uptrend. In this strategy, this is confirmed if the low prices are above the daily EMA (Exponential Moving Average).
Kijun Sen Touch Down: Occurs when prices cross below the Kijun-sen line and then close back above it, indicating a potential bullish reversal.
Tenkan-Kijun Cross Up: A bullish signal generated when the Tenkan-sen line crosses above the Kijun-sen line.
Close Over Tenkan and Kijun: A strong bullish signal when the close price crosses above both the Tenkan-sen and Kijun-sen lines.
Trading Setups:
Long Setup: Generated when the Kijun-sen is above the highest point of the Kumo (senkou_max) and the closing price is below the lowest point of the Kumo (senkou_min). This setup is checked over the last 21 bars.
Short Setup: Generated when the Kijun-sen is below the lowest point of the Kumo (senkou_min) and the closing price is above the highest point of the Kumo (senkou_max). This setup is also checked over the last 21 bars. (Not avalible yet)
Entry Conditions:
Ultra Long Entry: This condition checks for a bullish bias, the Tenkan-Kijun cross up or Kijun Sen touch down, high volume, and that the price is not within the Kumo cloud.
Main Long Entry: This condition requires the closing price to be above the Kumo cloud, a green Kumo cloud, a bullish bias, the Tenkan rule, and that the price is not within the Kumo cloud.
Exit Conditions:
A trailing stop loss is implemented to protect profits. The stop loss level is dynamically updated based on the highest high of the last 5 bars minus three times the ATR (Average True Range) value.
Visuals on the Chart:
The Tenkan-sen and Kijun-sen lines are plotted for visual reference.
The Kumo cloud is displayed with different colors indicating bullish (green) or bearish (red) conditions.
Entry points are marked on the chart, and the trailing stop loss levels are plotted as well.
The KumoTrade Ichimoku Strategy aims to provide a comprehensive approach to trading by combining multiple aspects of the Ichimoku indicator to generate reliable trading signals and manage risk effectively.

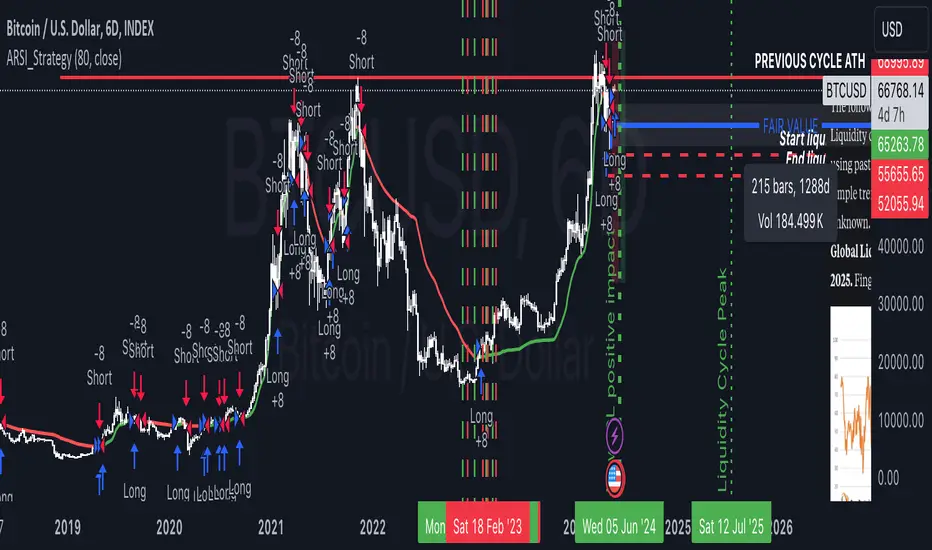
Adaptive RSI StrategyThe Adaptive RSI Strategy is designed to give you an edge by adapting to changing market conditions more effectively than the traditional RSI. By adjusting dynamically to recent price movements, this strategy aims to provide more timely and accurate trade signals.
How Does It Work?
You can set the number of periods for the RSI calculation. The default is 14, but feel free to experiment with different lengths to suit your trading style.
Choose the price data to base the RSI on, typically the closing price.
Decide if you want the strategy to visually highlight upward and downward movements of the Adaptive RSI (ARSI) on the chart. This can help you quickly spot trends.
Adaptive Calculation:
Alpha: The strategy uses an adaptive factor called alpha, which changes based on recent RSI values. This makes the RSI more sensitive to recent market conditions.
Adaptive RSI (ARSI): This is the core of our strategy. It calculates the ARSI using the adaptive alpha, making it more responsive to price changes compared to the traditional RSI.
Trade Signals:
Long Entry (Buy Signal): The strategy triggers a buy signal when the ARSI value crosses above its previous value. This indicates a potential upward trend, suggesting it's a good time to enter a long position.
Short Entry (Sell Signal): Conversely, a sell signal is triggered when the ARSI value crosses below its previous value, indicating a potential downward trend and suggesting it's a good time to enter a short position.
Visual Representation:
If you enable the highlight movements feature, the ARSI line on the chart will change color: green for upward movements and red for downward movements. This makes it easier to see potential trade opportunities at a glance.
Why Use the Adaptive RSI Strategy?
Responsiveness: The adaptive nature of this strategy means it's more sensitive to market changes, helping you react quicker to new trends.
Customization: You can tailor the length of the RSI period and decide whether to highlight movements, allowing you to adapt the strategy to your specific needs and preferences.
Visual Clarity: Highlighting the ARSI movements on the chart makes it easier to spot trends and potential entry points, giving you a clearer picture of the market.
TASC 2024.06 REIT ETF Trading System█ OVERVIEW
This strategy script demonstrates the application of the Real Estate Investment Trust (REIT) ETF trading system presented in the article by Markos Katsanos titled "Is The Price REIT?" from TASC's June 2024 edition of Traders' Tips .
█ CONCEPTS
REIT stocks and ETFs offer a simplified, diversified approach to real estate investment. They exhibit sensitivity to interest rates, often moving inversely to interest rate and treasury yield changes. Markos Katsanos explores this relationship and the correlation of prices with the broader market to develop a trading strategy for REIT ETFs.
The script employs Bollinger Bands and Donchian channel indicators to identify oversold conditions and trends in REIT ETFs. It incorporates the 10-year treasury yield index (TNX) as a proxy for interest rates and the S&P 500 ETF (SPY) as a benchmark for the overall market. The system filters trade entries based on their behavior and correlation with the REIT ETF price.
█ CALCULATIONS
The strategy initiates long entries (buy signals) under two conditions:
1. Oversold condition
The weekly ETF low price dips below the 15-week Bollinger Band bottom, the closing price is above the value by at least 0.2 * ATR ( Average True Range ), and the price exceeds the week's median.
Either of the following:
– The TNX index is down over 15% from its 25-week high, and its correlation with the ETF price is less than 0.3.
– The yield is below 2%.
2. Uptrend
The weekly ETF price crosses above the previous week's 30-week Donchian channel high.
The SPY ETF is above its 20-week moving average.
Either of the following:
– Over ten weeks have passed since the TNX index was at its 30-week high.
– The correlation between the TNX value and the ETF price exceeds 0.3.
– The yield is below 2%.
The strategy also includes three exit (sell) rules:
1. Trailing (Chandelier) stop
The weekly close drops below the highest close over the last five weeks by over 1.5 * ATR.
The TNX value rises over the latest 25 weeks, with a yield exceeding 4%, or its value surges over 15% above the 25-week low.
2. Stop-loss
The ETF's price declines by at least 8% of the previous week's close and falls below the 30-week moving average.
The SPY price is down by at least 8%, or its correlation with the ETF's price is negative.
3. Overbought condition
The ETF's value rises above the 100-week low by over 50%.
The ETF's price falls over 1.5 * ATR below the 3-week high.
The ETF's 10-week Stochastic indicator exceeds 90 within the last three weeks.
█ DISCLAIMER
This strategy script educates users on the system outlined by the TASC article. However, note that its default properties might not fully represent real-world trading conditions for an individual. By default, it uses 10% of equity as the order size and a slippage amount of 5 ticks. Traders should adjust these settings and the commission amount when using this script. Additionally, since this strategy utilizes compound conditions on weekly data to trigger orders, it will generate significantly fewer trades than other, higher-frequency strategies.

Dual RSI Differential - Strategy [presentTrading]█ Introduction and How it is Different
The Dual RSI Differential Strategy introduces a nuanced approach to market analysis and trading decisions by utilizing two Relative Strength Index (RSI) indicators calculated over different time periods. Unlike traditional strategies that employ a single RSI and may signal premature or delayed entries, this method leverages the differential between a shorter and a longer RSI. This approach pinpoints more precise entry and exit points, providing a refined tool for traders to exploit market conditions effectively, particularly in overbought and oversold scenarios.
Most important: it is a good eductional code for swing trading.
For beginners, this Pine Script provides a complete function that includes crucial elements such as holding days and the option to configure take profit/stop loss settings:
- Hold Days: This feature ensures that trades are not exited too hastily, helping traders to ride out short-term market volatility. It's particularly valuable for swing trading where maintaining positions slightly longer can lead to capturing significant trends.
- TPSL Condition (None by default): This setting allows traders to focus solely on the strategy's robust entry and exit signals without being constrained by preset profit or loss limits. This flexibility is crucial for learning to adjust strategy settings based on personal risk tolerance and market observations.
BTCUSD 6h LS Performance
█ Strategy, How It Works: Detailed Explanation
🔶 RSI Calculation:
The RSI is a momentum oscillator that measures the speed and change of price movements. It is calculated using the formula:
RSI = 100 - (100 / (1 + RS))
Where RS (Relative Strength) = Average Gain of up periods / Average Loss of down periods.
🔶 Dual RSI Setup:
This strategy involves two RSI indicators:
RSI_Short (RSI_21): Calculated over a short period (21 days).
RSI_Long (RSI_42): Calculated over a longer period (42 days).
Differential Calculation:
The strategy focuses on the differential between these two RSIs:
RSI Differential = RSI_Long - RSI_Short
This differential helps to identify when the shorter-term sentiment diverges from longer-term trends, signaling potential trading opportunities.
BTCUSD Local picuture
🔶 Signal Triggers:
Entry Signal: A buy (long) signal is triggered when the RSI Differential exceeds -5, suggesting strengthening short-term momentum. Conversely, a sell (short) signal occurs when the RSI Differential falls below +5, indicating weakening short-term momentum.
Exit Signal: Trades are generally exited when the RSI Differential reverses past these thresholds, indicating a potential momentum shift.
█ Trade Direction
This strategy accommodates various trading preferences by allowing selections among long, short, or both directions, thus enabling traders to capitalize on diverse market movements and volatility.
█ Usage
The Dual RSI Differential Strategy is particularly suited for:
Traders who prefer a systematic approach to capture market trends.
Those who seek to minimize risks associated with rapid and unexpected market movements.
Traders who value strategies that can be finely tuned to different market conditions.
█ Default Settings
- Trading Direction: Both — allows capturing of upward and downward market movements.
- Short RSI Period: 21 days — balances sensitivity to market movements.
- Long RSI Period: 42 days — smoothens out longer-term fluctuations to provide a clearer market trend.
- RSI Difference Level: 5 — minimizes false signals by setting a moderate threshold for action.
Use Hold Days: True — introduces a temporal element to trading strategy, holding positions to potentially enhance outcomes.
- Hold Days: 5 — ensures that trades are not exited too hastily, helping to ride out short-term volatility.
- TPSL Condition: None — enables traders to focus solely on the strategy's entry and exit signals without preset profit or loss limits.
- Take Profit Percentage: 15% — aims for significant market moves to lock in profits.
- Stop Loss Percentage: 10% — safeguards against large losses, essential for long-term capital preservation.

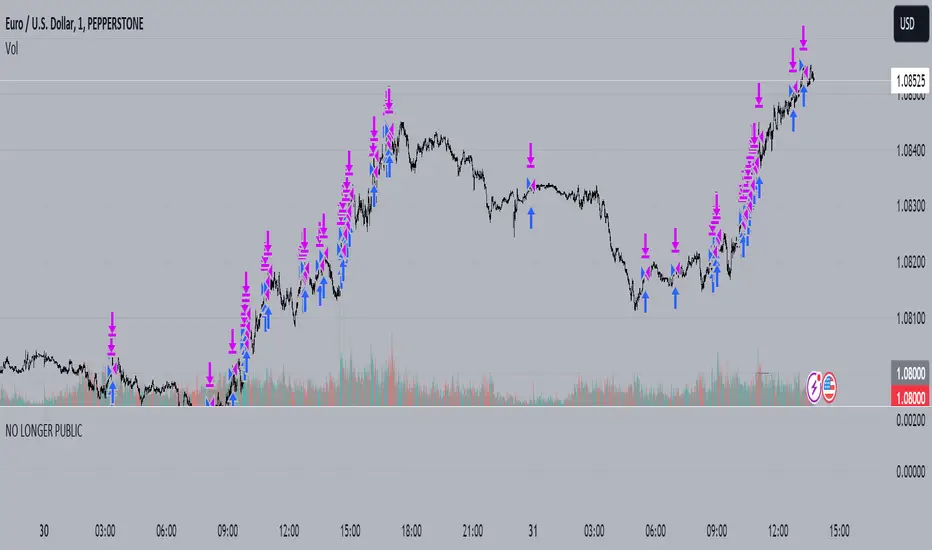
Volume-Supported Linear Regression Trend Modified StrategyHi everyone, this will be my first published script on Tradingview, maybe more to come.
For quite some time I have been looking for a script that performs no matter if price goes up or down or sideways. I believe this strategy comes pretty close to that. Although nowhere near the so called "buy&hold equity" of BTC, it has produced consistent profits even when price goes down.
It is a strategy which seems to work best on the 1H timeframe for cryptocurrencies.
Just by testing different settings for SL and TP you can customize it for each pair.
THE STRATEGY:
Basically, I used the Volume Supported Linear Regression Trend Model that LonesomeTheBlue has created and modified a few things such as entry and exit conditions. So all credits go to him!
LONG ENTRY: When there is a bullish cross of the short term trend (the histogram/columns), while the long term trend is above 0 and rising.
SHORT ENTRY: When there is a bearish cross (green to red) of the short-term trend (the histogram/columns), while the long term trend is beneath 0 and decreasing.
LONG EXIT: Bearish crossover of short-term trend while long term trend is below 0
SHORT EXIT: Bullish crossover of short-term trend while long term trend is above 0
Combining this with e.g. a SL of 2% and a TP of 20% (as used in my backtesting), combined with pyramiding and correct risk management, it gives pretty consistent results.
Be aware, this is only for educational purpose and in no means financial advise. Past results do not guarantee future results. This strategy can lose money!
Enjoy :)
PS: It works not only on BTC of course, works even better on some other major crypto pairs. I'll leave it to you to find out which ones ;)
Price Based Z-Trend - Strategy [presentTrading]█ Introduction and How it is Different
Z-score: a statistical measurement of a score's relationship to the mean in a group of scores.
Simple but effective approach.
The "Price Based Z-Trend - Strategy " leverages the Z-score, a statistical measure that gauges the deviation of a price from its moving average, normalized against its standard deviation. This strategy stands out due to its simplicity and effectiveness, particularly in markets where price movements often revert to a mean. Unlike more complex systems that might rely on a multitude of indicators, the Z-Trend strategy focuses on clear, statistically significant price movements, making it ideal for traders who prefer a streamlined, data-driven approach.
BTCUSD 6h LS Performance
█ Strategy, How It Works: Detailed Explanation
🔶 Calculation of the Z-score
"Z-score is a statistical measurement that describes a value's relationship to the mean of a group of values. Z-score is measured in terms of standard deviations from the mean. If a Z-score is 0, it indicates that the data point's score is identical to the mean score. A Z-score of 1.0 would indicate a value that is one standard deviation from the mean. Z-scores may be positive or negative, with a positive value indicating the score is above the mean and a negative score indicating it is below the mean."
The Z-score is central to this strategy. It is calculated by taking the difference between the current price and the Exponential Moving Average (EMA) of the price over a user-defined length, then dividing this by the standard deviation of the price over the same length:
z = (x - μ) /σ
Local
🔶 Trading Signals
Trading signals are generated based on the Z-score crossing predefined thresholds:
- Long Entry: When the Z-score crosses above the positive threshold.
- Long Exit: When the Z-score falls below the negative threshold.
- Short Entry: When the Z-score falls below the negative threshold.
- Short Exit: When the Z-score rises above the positive threshold.
█ Trade Direction
The strategy allows users to select their preferred trading direction through an input option.
█ Usage
To use this strategy effectively, traders should first configure the Z-score thresholds according to their risk tolerance and market volatility. It's also crucial to adjust the length for the EMA and standard deviation calculations based on historical performance and the expected "noise" in price data.
The strategy is designed to be flexible, allowing traders to refine settings to better capture profitable opportunities in specific market conditions.
█ Default Settings
- Trade Direction: Both
- Standard Deviation Length: 100
- Average Length: 100
- Threshold for Z-score: 1.0
- Bar Color Indicator: Enabled
These settings offer a balanced starting point but can be customized to suit various trading styles and market environments. The strategy's parameters are designed to be adjusted as traders gain experience and refine their approach based on ongoing market analysis.
Z-score is a must-learn approach for every algorithmic trader.

Sector Rotation Hedging With Volatility Index [TradeDots]The "Sector Rotation Hedging Strategy With Volatility Index" is a comprehensive trading indicator developed to optimally leverage the S&P500 volatility index. It is designed to switch between distinct ETF sectors, strategically hedging to moderate risk exposure during harsh market volatility.
HOW DOES IT WORK
The core of this indicator is grounded on the S&P500 volatility index (VIX) close price and its 60-day moving average. This serves to determine whether the prevailing market volatility is above or below the quarterly average.
In periods of elevated market volatility, risk exposure escalates significantly. Traders retaining stocks in sectors with disproportionately high volatility face increased vulnerability to negative returns. To tackle this, our indicator employs a two-pronged approach utilizing two sequential candlestick close prices to confirm if volatility surpasses the average value.
Upon confirming above-average volatility, a hedging table is deployed to spotlight ETFs with low volatility, such as the Utilities Select Sector SPDR Fund (XLU), to derisk the overall portfolio.
Conversely, in low-volatility conditions, sectors yielding higher returns like the Technology Select Sector SPDR Fund (XLK) are preferred. The hedging table is utilized to earmark high-return sector ETFs.
Thus, during highly volatile market periods, the strategy recommends enhancing portfolio allocation to low-volatility ETFs. During low-volatility windows, the portfolio is calibrated towards high-volatility ETFs for heightened returns.
IMPORTANT CONSIDERATION
In real trading, additional considerations encompassing trading commissions, management fees, and ancillary rotation costs should be factored in. False signals may arise, potentially leading to losses from these fees.
RISK DISCLAIMER
Trading entails substantial risk, and most day traders incur losses. All content, tools, scripts, articles, and education provided by TradeDots serve purely informational and educational purposes. Past performances are not definitive predictors of future results.

Buy Sell Strategy With Z-Score [TradeDots]The "Buy Sell Strategy With Z-Score" is a trading strategy that harnesses Z-Score statistical metrics to identify potential pricing reversals, for opportunistic buying and selling opportunities.
HOW DOES IT WORK
The strategy operates by calculating the Z-Score of the closing price for each candlestick. This allows us to evaluate how significantly the current price deviates from its typical volatility level.
The strategy first takes the scope of a rolling window, adjusted to the user's preference. This window is used to compute both the standard deviation and mean value. With these values, the strategic model finalizes the Z-Score. This determination is accomplished by subtracting the mean from the closing price and dividing the resulting value by the standard deviation.
This approach provides an estimation of the price's departure from its traditional trajectory, thereby identifying market conditions conducive to an asset being overpriced or underpriced.
APPLICATION
Firstly, it is better to identify a stable trading pair for this technique, such as two stocks with considerable correlation. This is to ensure conformance with the statistical model's assumption of a normal Gaussian distribution model. The ideal performance is theoretically situated within a sideways market devoid of skewness.
Following pair selection, the user should refine the span of the rolling window. A broader window smoothens the mean, more accurately capturing long-term market trends, while potentially enhancing volatility. This refinement results in fewer, yet precise trading signals.
Finally, the user must settle on an optimal Z-Score threshold, which essentially dictates the timing for buy/sell actions when the Z-Score exceeds with thresholds. A positive threshold signifies the price veering away from its mean, triggering a sell signal. Conversely, a negative threshold denotes the price falling below its mean, illustrating an underpriced condition that prompts a buy signal.
Within a normal distribution, a Z-Score of 1 records about 68% of occurrences centered at the mean, while a Z-Score of 2 captures approximately 95% of occurrences.
The 'cool down period' is essentially the number of bars that await before the next signal generation. This feature is employed to dodge the occurrence of multiple signals in a short period.
DEFAULT SETUP
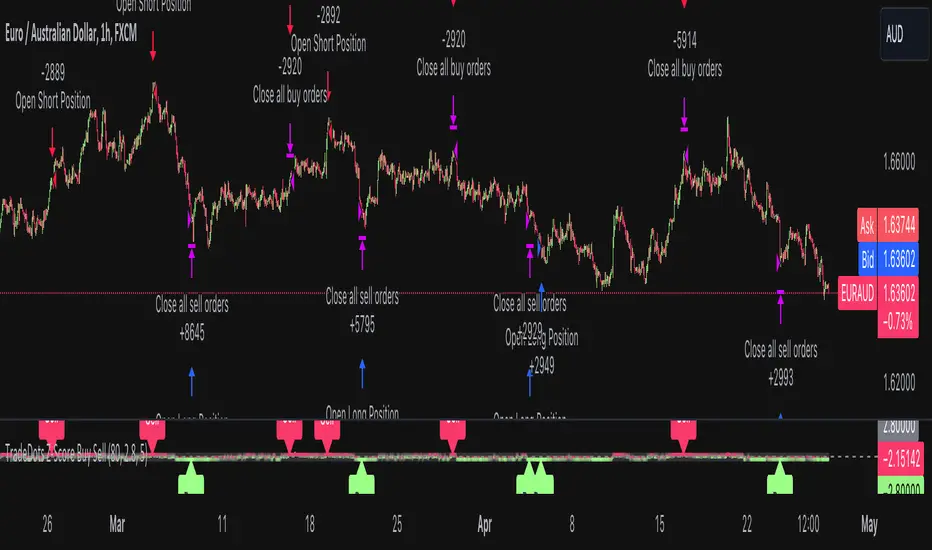
The following is the default setup on EURUSD 1h timeframe
Rolling Window: 80
Z-Score Threshold: 2.8
Signal Cool Down Period: 5
Commission: 0.03%
Initial Capital: $10,000
Equity per Trade: 30%
RISK DISCLAIMER
Trading entails substantial risk, and most day traders incur losses. All content, tools, scripts, articles, and education provided by TradeDots serve purely informational and educational purposes. Past performances are not definitive predictors of future results.
Fibonacci Trend Reversal StrategyIntroduction
This publication introduces the " Fibonacci Retracement Trend Reversal Strategy, " tailored for traders aiming to leverage shifts in market momentum through advanced trend analysis and risk management techniques. This strategy is designed to pinpoint potential reversal points, optimizing trading opportunities.
Overview
The strategy leverages Fibonacci retracement levels derived from @IMBA_TRADER's lance Algo to identify potential trend reversals. It's further enhanced by a method called " Trend Strength Over Time " (TSOT) (by @federalTacos5392b), which utilizes percentile rankings of price action to measure trend strength. This also has implemented Dynamic SL finder by utilizing @veryfid's ATR Stoploss Finder which works pretty well
Indicators:
Fibonacci Retracement Levels : Identifies critical reversal zones at 23.6%, 50%, and 78.6% levels.
TSOT (Trend Strength Over Time) : Employs percentile rankings across various timeframes to gauge the strength and direction of trends, aiding in the confirmation of Fibonacci-based signals.
ATR (Average True Range) : Implements dynamic stop-loss settings for both long and short positions, enhancing trade security.
Strategy Settings :
- Sensitivity: Set default at 18, adjustable for more frequent or sparse signals based on market volatility.
- ATR Stop Loss Finder: Multiplier set at 3.5, applying the ATR value to determine stop losses dynamically.
- ATR Length: Default set to 14 with RMA smoothing.
- TSOT Settings: Hard-coded to identify percentile ranks, with no user-adjustable inputs due to its intrinsic calculation method.
Trade Direction Options : Configurable to support long, short, or both directions, adaptable to the trader's market assessment.
Entry Conditions :
- Long Entry: Triggered when the price surpasses the mid Fibonacci level (50%) with a bullish TSOT signal.
- Short Entry: Activated when the price falls below the mid Fibonacci level with a bearish TSOT indication.
Exit Conditions :
- Employs ATR-based dynamic stop losses, calibrated according to current market volatility, ensuring effective risk management.
Strategy Execution :
- Risk Management: Features adjustable risk-reward settings and enables partial take profits by default to systematically secure gains.
- Position Reversal: Includes an option to reverse positions based on new TSOT signals, improving the strategy's responsiveness to evolving market conditions.
The strategy is optimized for the BYBIT:WIFUSDT.P market on a scalping (5-minute) timeframe, using the default settings outlined above.
I spent a lot of time creating the dynamic exit strategies for partially taking profits and reversing positions so please make use of those and feel free to adjust the settings, tool tips are also provided.
For Developers: this is published as open-sourced code so that developers can learn something especially on dynamic exits and partial take profits!
Good Luck!
Disclaimer
This strategy is shared for educational purposes and must be thoroughly tested under diverse market conditions. Past performance does not guarantee future results. Traders are advised to integrate this strategy with other analytical tools and tailor it to specific market scenarios. I was only sharing what I've crafted while strategizing over a Solana Meme Coin.

Channels With NVI Strategy [TradeDots]The "Channels With NVI Strategy" is a trading strategy that identifies oversold market instances during a bullish trading market. Specifically, the strategy integrates two principal indicators to deliver profitable opportunities, anticipating potential uptrends.
2 MAIN COMPONENTS
1. Channel Indicators: This strategy gives users the flexibility to choose between Bollinger Band Channels or Keltner Channels. This selection can be made straight from the settings, allowing the traders to adjust the tool according to their preferences and strategies.
2. Negative Volume Indicator (NVI): An indicator that calculates today's price rate of change, but only when today's trading volume is less than the previous day's. This functionality enables users to detect potential shifts in the trading volume with time and price.
ENTRY CONDITION
First, the assets price must drop below the lower band of the channel indicator.
Second, NVI must ascend above the exponential moving average line, signifying a possible flood of 'smart money' (large institutional investors or savvy traders), indicating an imminent price rally.
EXIT CONDITION
Exit conditions can be customized based on individual trading styles and risk tolerance levels. Traders can define their ideal take profit or stop loss percentages.
Moreover, the strategy also employs an NVI-based exit policy. Specifically, if the NVI dips under the exponential moving average – suggestive of a fading trading momentum, the strategy grants an exit call.
RISK DISCLAIMER
Trading entails substantial risk, and most day traders incur losses. All content, tools, scripts, articles, and education provided by TradeDots serve purely informational and educational purposes. Past performances are not definitive predictors of future results.

RSI and ATR Trend Reversal SL/TPQuick History:
I was frustrated with a standard fixed percent TP/SL as they often were not receptive to quick market rallies/reversals. I developed this TP/SL and eventually made it into a full fledge strategy and found it did well enough to publish. This strategy can be used as a standalone or tacked onto another strategy as a TP/SL. It does function as both with a single line. This strategy has been tested with TSLA , AAPL, NVDA, on the 15 minutes timeframe.
HOW IT WORKS:
Inputs:
Length: Simple enough, it determines the length of the RSI and ATR used.
Multiplier: This multiplies the RSI and ATR calculation, more on this later.
Delay to prevent Idealization: TradingView will use the open of the bar the strategy triggers on when calculating the backtest. This can produce unrealistic results depending on the source. If your source is open, set to 0, if anything else, set to 1.
Minimum Difference: This is essentially a traditional SL/TP, it is borderline unnecessary, but if the other parameters are wacky this can be used to ensure the SL/TP. It multiplies the source by the percent, so if it is set to 10, the SL/TP is initialized at src +- 10%.
Source input: Self Explanatory, be sure to update the Delay if you use open.
CALCULATION:
Parameters Initialization:
The strategy uses Heikinashi values for calculations, this is not toggleable in parameters, but can be easily changed by changing hclose to equal src.
FUNCTION INITIALIZATION:
highest_custom and lowest_custom do the same thing as ta.highest and ta.lowest, however the built in ta library does not allow for var int input, so I had to create my own functions to be used here. I actually developed these years ago and have used them in almost every strategy since. Feel especially free to use these in your own scripts.
The rsilev is where the magic happens.
SL/TP min/max are initially calculated to be used later.
Then we begin by establishing variables.
BullGuy is used to determine the length since the last crossup or crossdown, until one happens, it returns na, breaking the function. BearGuy is used in all the calculations, and is the same as BullGuy, unless BullGuy is na, where BearGuy counts up from 1 on each bar from 0.
We create our rsi and have to modify the second one to suit the function. In the case of the upper band, we mirror the lower one. So if the RSI is 80, we want it to be 20 on the upper band.
the upper band and lower band are calculated the exact same way, but mirrored. For the purpose of writing, I'm going to talk about the lower band. Assume everything is mirrored for the upper one. It finds the highest source since the last crossup or crossdown. It then multiplies from 1 / the RSI, this means that a rapid RSI increase will increase the band dramatically, so it is able to capture quick rally/reversals. We add this to the atr to source ratio, as the general volatility is a massive factor to be included. We then multiply this number by our chosen amount, and subtract it from the highest source, creating the band.
We do this same process but mirrored with both bands and compared it to the source. If the source is above the lower band, it suggests an uptrend, so the lower band is outputted, and vice versa for the upper one.
PLOTTING:
We also determine the line color in the same manner as we do the trend direction.
STRATEGY:
We then use the source again, and if it crosses up or down relative to the selected band, we enter a long or short respectively.
This may not be the most superb independent strategy, but it can be very useful as a TP/SL for your chosen entry conditions, especially in volatile markets or tickers.
Thank you for taking the time to read, and please enjoy.

ORB Heikin Ashi SPY 5min Correlation StrategyOverview:
The ORB (Opening Range Breakout) strategy combined with Heikin Ashi candles and Relative Volume (RVOL) indicator aims to capitalize on significant price movements that occur shortly after the market opens. This strategy identifies breakouts above or below the opening range, using Heikin Ashi candles for smoother price visualization and RVOL to gauge the strength of the breakout.
Components:
Opening Range Breakout (ORB): The strategy starts by defining the opening range, typically the first few minutes of the trading session. It then identifies breakouts above the high or below the low of this range as potential entry points.
Heikin Ashi Candles: Heikin Ashi candles are used to provide a smoother representation of price movements compared to traditional candlesticks. By averaging open, close, high, and low prices of the previous candle, Heikin Ashi candles reduce noise and highlight trends more effectively.
Relative Volume (RVOL): RVOL compares the current volume of a stock to its average volume over a specified period. It helps traders identify abnormal trading activity, which can signal potential price movements.
Candle for correlation : In this case we are using SPY candles. It can also use different asset
Strategy Execution:
Initialization: The strategy initializes by setting up variables and parameters, including the ORB period, session timings, and Heikin Ashi candle settings.
ORB Calculation: It calculates the opening range by identifying the high and low prices during the specified session time. These values serve as the initial reference points for potential breakouts. For this we are looking for the first 30 min of the US opening session.
After that we are going to use the next 2 hours to check for breakout opportunities.
Heikin Ashi Transformation: Optionally, the strategy transforms traditional candlestick data into Heikin Ashi format for smoother visualization and trend identification.
Breakout Identification: It continuously monitors price movements within the session and checks if the current high breaches the ORB high or if the current low breaches the ORB low. These events trigger potential long or short entry signals, respectively.
RVOL Analysis: Simultaneously, the strategy evaluates the relative volume of the asset to gauge the strength of the breakout. A surge in volume accompanying the breakout confirms the validity of the signal. In this case we are looking for at least a 1 value of the division between currentVolume and pastVolume
Entry and Exit Conditions: When a breakout occurs and is confirmed by RVOL and is within our session time, the strategy enters a long or short position accordingly. It does not have a stop loss or a takie profit level, instead it will always exit at the end of the trading session, 5 minutes before
Position Sizing and Commissions: For the purpose of this backtest, the strategy allocated 10% of the capital for each trade and assumes a trading commission of 0.01$ per share ( twice the IBKR broker values)
Session End: At the end of the trading session, the strategy closes all open positions to avoid overnight exposure.
Conclusion:
The combination of ORB breakout strategy, Heikin Ashi candles, and RVOL provides traders with a robust framework for identifying and capitalizing on early trends in the market. By leveraging these technical indicators together, traders can make more informed decisions and improve the overall performance of their trading strategies. However, like any trading strategy, it's essential to backtest thoroughly and adapt the strategy to different market conditions to ensure its effectiveness over time.

ICT Silver Bullet | Flux Charts💎 GENERAL OVERVIEW
Introducing our new ICT Silver Bullet Indicator! This indicator is built around the ICT's "Silver Bullet" strategy. The strategy has 5 steps for execution and works best in 1-5 min timeframes. For more information about the process, check the "HOW DOES IT WORK" section.
Features of the new ICT Silver Bullet Indicator :
Implementation of ICT's Silver Bullet Strategy
Customizable Execution Settings
2 NY Sessions & London Session
Customizable Backtesting Dashboard
Alerts for Buy, Sell, TP & SL Signals
📌 HOW DOES IT WORK ?
ICT's Silver Bullet strategy has 5 steps :
1. Mark your market sessions open (This indicator has 3 -> NY 10-11, NY 14-15, LDN 03-04)
2. Mark the swing liquidity points
3. Wait for market to take down one liquidity side
4. Look for a market structure-shift for reversals
5. Wait for a FVG for execution
This indicator follows these steps and inform you step by step by plotting them in your chart. You can switch execution types between FVG and MSS.
🚩UNIQUENESS
This indicator is an all-in-one suit for the ICT's Silver Bullet concept. It's capable of plotting the strategy, giving signals, a backtesting dashboard and alerts feature. It's designed for simplyfing a rather complex strategy, helping you to execute it with clean signals. The backtesting dashboard allows you to see how your settings perform in the current ticker. You can also set up alerts to get informed when the strategy is executable for different tickers.
⚙️SETTINGS
1. General Configuration
Execution Type -> FVG execution type will require a FVG to take an entry, while the MSS setting will take an entry as soon as it detects a market structure-shift.
MSS Swing Length -> The swing length when finding liquidity zones for market structure-shift detection.
Breakout Method -> If "Wick" is selected, a bar wick will be enough to confirm a market structure-shift. If "Close" is selected, the bar must close above / below the liquidity zone to confirm a market structure-shift.
FVG Detection -> "Same Type" means that all 3 bars that formed the FVG should be the same type. (Bullish / Bearish). "All" means that bar types may vary between bullish / bearish.
FVG Detection Sensitivity -> You can turn this setting on and off. If it's off, any 3 consecutive bullish / bearish bars will be calculated as FVGs. If it's on, the size of FVGs will be filtered by the selected sensitivity. Lower settings mean less but larger FVGs.
2. TP / SL
TP / SL Method -> If "Fixed" is selected, you can adjust the TP / SL ratios from the settings below. If "Dynamic" is selected, the TP / SL zones will be auto-determined by the algorithm.
Risk -> The risk you're willing to take if "Dynamic" TP / SL Method is selected. Higher risk usually means a better winrate at the cost of losing more if the strategy fails.
Close Position @ Session End -> If this setting is enabled, the current position (if any) will be closed at the beginning of a new session, regardless if it hit the TP / SL zone. If it's off, the position will be open until it hits a TP / SL zone.
