HighTimeframeTimingLibrary "HighTimeframeTiming"
@description Library for sampling high timeframe (HTF) historical data at an arbitrary number of HTF bars back, using a single security() call.
The data is fixed and does not alter over the course of the HTF bar. It also behaves consistently on historical and elapsed realtime bars.
‼ LIMITATIONS: This library function depends on there being a consistent number of chart timeframe bars within the HTF bar. This is almost always true in 24/7 markets like crypto.
This might not be true if the chart doesn't produce an update when expected, for example because the asset is thinly traded and there is no volume or price update from the feed at that time.
To mitigate this risk, use this function on liquid assets and at chart timeframes high enough to reliably produce updates at least once per bar period.
The consistent ratio of bars might also break down in markets with irregular sessions and hours. I'm not sure if or how one could mitigate this.
Another limitation is that because we're accessing a multiplied number of chart bars, you will run out of chart bars faster than you would HTF bars. This is only a problem if you use a large historical operator.
If you call a function from this library, you should probably reproduce these limitations in your script description.
However, all of this doesn't mean that this function might not still be the best available solution, depending what your needs are.
If a single chart bar is skipped, for example, the calculation will be off by 1 until the next HTF bar opens. This is certainly inconsistent, but potentially still usable.
@function f_offset_synch(float _HTF_X, int _HTF_H, int _openChartBarsIn, bool _updateEarly)
Returns the number of chart bars that you need to go back in order to get a stable HTF value from a given number of HTF bars ago.
@param float _HTF_X is the timeframe multiplier, i.e. how much bigger the selected timeframe is than the chart timeframe. The script shows a way to calculate this using another of my libraries without using up a security() call.
@param int _HTF_H is the historical operator on the HTF, i.e. how many bars back you want to go on the higher timeframe. If omitted, defaults to zero.
@param int _openChartBarsIn is how many chart bars have been opened within the current HTF bar. An example of calculating this is given below.
@param bool _updateEarly defines whether you want to update the value at the closing calculation of the last chart bar in the HTF bar or at the open of the first one.
@returns an integer that you can use as a historical operator to retrieve the value for the appropriate HTF bar.
🙏 Credits: This library is an attempt at a solution of the problems in using HTF data that were laid out by Pinecoders in "security() revisited" -
Thanks are due to the authors of that work for an understanding of HTF issues. In addition, the current script also includes some of its code.
Specifically, this script reuses the main function recommended in "security() revisited", for the purposes of comparison. And it extends that function to access historical data, again just for comparison.
All the rest of the code, and in particular all of the code in the exported function, is my own.
Special thanks to LucF for pointing out the limitations of my approach.
~~~~~~~~~~~~~~~~|
EXPLANATION
~~~~~~~~~~~~~~~~|
Problems with live HTF data: Many problems with using live HTF data from security() have been clearly explained by Pinecoders in "security() revisited"
In short, its behaviour is inconsistent between historical and elapsed realtime bars, and it changes in realtime, which can cause calculations and alerts to misbehave.
Various unsatisfactory solutions are discussed in "security() revisited", and understanding that script is a prerequisite to understanding this library.
PineCoders give their own solution, which is to fix the data by essentially using the previous HTF bar's data. Importantly, that solution is consistent between historical and realtime bars.
This library is an attempt to provide an alternative to that solution.
Problems with historical HTF data: In addition to the problems with live HTF data, there are different issues when trying to access historical HTF data.
Why use historical HTF data? Maybe you want to do custom calculations that involve previous HTF bars. Or to use HTF data in a function that has mutable variables and so can't be done in a security() call.
Most obviously, using the historical operator (in this description, represented using { } because the square brackets don't render) on variables already retrieved from a security() call, e.g. HTF_Close{1}, is not very useful:
it retrieves the value from the previous *chart* bar, not the previous HTF bar.
Using {1} directly in the security() call instead does get data from the previous HTF bar, but it behaves inconsistently, as we shall see.
This library addresses these concerns as well.
Housekeeping: To follow what's going on with the example and comparisons, turn line labels on: Settings > Scales > Indicator Name Label.
The following explanation assumes "close" as the source, but you can change it if you want.
To quickly see the difference between historical and realtime bars, set the HTF to something like 3 minutes on a 15s chart.
The bars at the top of the screen show the status. Historical bars are grey, elapsed realtime bars are red, and the realtime bar is green. A white vertical line shows the open of a HTF bar.
A: This library function f_offset_synch(): When supplied with an input offset of 0, it plots a stable value of the close of the *previous* HTF bar. This value is thus safe to use for calculations and alerts.
For a historical operator of {1}, it gives the close of the *last-but-one* bar. Sounds simple enough. Let's look at the other options to see its advantages.
B: Live HTF data: Represented on the line label as "security(){0}". Note: this is the source that f_offset_synch() samples.
The raw HTF data is very different on historical and realtime bars:
+ On historical bars, it uses a flat value from the end of the previous HTF bar. It updates at the close of the HTF bar.
+ On realtime bars, it varies between and within each chart bar.
There might be occasions where you want to use live data, in full knowledge of its drawbacks described above. For example, to show simple live conditions that are reversible after a chart bar close.
This library transforms live data to get the fixed data, thus giving you access to both live and fixed data with only one security() call.
C: Historical data using security(){H}: To see how this behaves, set the {H} value in the settings to 1 and show options A, B, and C.
+ On historical bars, this option matches option A, this library function, exactly. It behaves just like security(){0} but one HTF bar behind, as you would expect.
+ On realtime bars, this option takes the value of security(){0} at the end of a HTF bar, but it takes it from the previous *chart* bar, and then persists that.
The easiest way to see this inconsistency is on the first realtime bar (marked red at the top of the screen). This option suddenly jumps, even if it's in the middle of a HTF bar.
Contrast this with option A, which is always constant, until it updates, once per HTF bar.
D: PineCoders' original function: To see how this behaves, show options A, B, and D. Set the {H} value in the settings to 0, then 1.
The PineCoders' original function (D) and extended function (E) do not have the same limitations as this library, described in the Limitations section.
This option has all of the same advantages that this library function, option A, does, with the following differences:
+ It cannot access historical data. The {H} setting makes no difference.
+ It always updates at the open of the first chart bar in a new HTF bar.
By contrast, this library function, option A, is configured by default to update at the close of the last chart bar in a HTF bar.
This little frontrunning is only a few seconds but could be significant in trading. E.g. on a 1D HTF with a 4H chart, an alert that involves a HTF change set to trigger ON CLOSE would trigger 4 hours later using this method -
but use exactly the same value. It depends on the market and timeframe as to whether you could actually trade this. E.g. at the very end of a tradfi day your order won't get executed.
This behaviour mimics how security() itself updates, as is easy to see on the chart. If you don't want it, just set in_updateEarly to false. Then it matches option D exactly.
E: PineCoders' function, extended to get history: To see how this behaves, show options A and E. Set the {H} value in the settings to 0, then 1.
I modified the original function to be able to get historical values. In all other respects it is the same.
Apart from not having the option to update earlier, the only disadvantage of this method vs this library function is that it requires one security() call for each historical operator.
For example, if you wanted live data, and fixed data, and fixed data one bar back, you would need 3 security() calls. My library function requires just one.
This is the essential tradeoff: extra complexity and less robustness in certain circumstances (the PineCoders function is simple and universal by comparison) for more flexibility with fewer security() calls.
Cari dalam skrip untuk "top"

RSI Failure Swings & AO DivergencesHello!
The script identifies RSI divergences, similar to other public scripts; however, RSI failure swings are also distinguished. When a failure swing is identified, the script calculates the highest RSI measurement (bottom failure swing) or the lowest RSI measurement (top failure swing) between the two RSI pivot points. A continually updating line is plotted at the "fail point" until it is penetrated for two sessions! In addition, the script displays the RSI fail point measurement. RSI bearish divergences are only distinguished when both RSI peaks form above 70. bullish divergences are only distinguished when both RSI troughs form below 30. Top failure swings require the initial RSI peak be above 70, the second RSI peak can form at any measurement. Bottom failure swings require the initial RSI trough be below 30, the second RSI trough can form at any measurement.
Included are Awesome Oscillator divergences. The indicator is a bit tricky; the oscillator does not incorporate an upper or lower extremity. Consequently, the script uses interpolated percentiles to characterize relatively high measurements and relatively low measurements. Bearish divergences that form within the 90th - 99th percentile are distinguished, and bullish divergences that form within the 1 - 10th percentile are distinguished. This can CERTAINLY be changed should you copy the source code and think of something better! For AO, white columns reflect a difference measurement >= 0; black bars reflect a difference measurement < 0

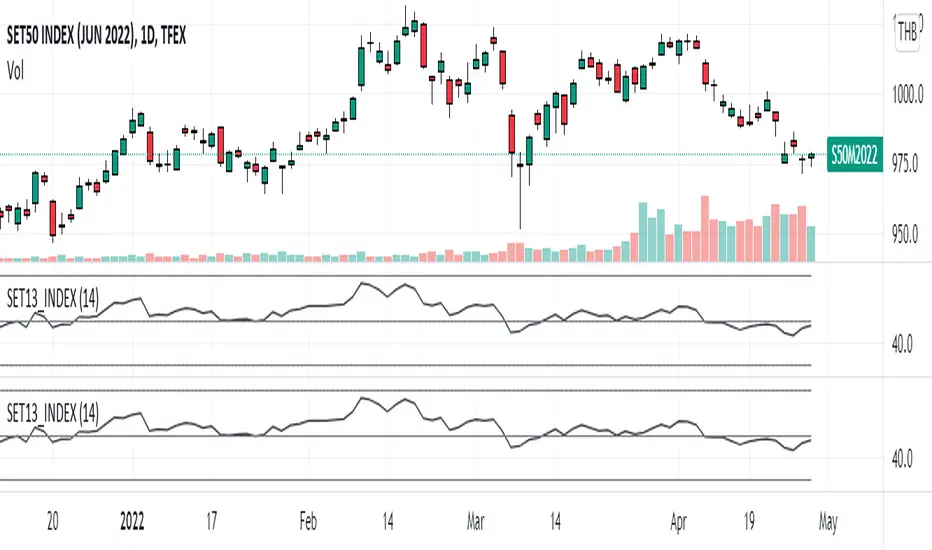
SET13_INDEXThe average RSI of top 13 marketcaptilization in SET50, as list by below.
1. PTT
2. AOT
3. ADVANC
4. CPALL
5. GULF
6. PTTEP
7. SCC
8. SCB
9. KBANK
10. BDMS
11. EA
12. OR
13. SCGP
Note that OR started trading on February 2021 so that the indicator will not appear before that period and
the top 13 marketcapiliation ranked on 22 February 2022 so pls becareful about look ahead bias.
Donchian Screener█ OVERVIEW
This is a screener script for the Donchian Channel indicator . It's an excellent indicator for trend following, a trading strategy which tries to take advantage of long, medium or short-term moves that seem to play out in various markets.
█ DESCRIPTION
The screener works by scanning through up to 10 symbols and list down symbols that are currently breaking through the upper or lower band as definied by the Donchian Channels, at which point the market signals the start of a bullish or bearish trend.
█ HOW TO USE
After adding the indicator, open the script settings and type the symbol name and length to be used on the Donchian Channels for each stock.
█ PARAMETERS
- Use High/Low Price Breakouts: check this box if you want to use price high/low instead of price close to identify breakouts
- Panel Position: choose whether you want to position the panel on the top, middle or bottom right side of the graph (default is top)
- Default Timeframe: what timeframe to use on the screener (default is daily)
- Ticker: the ticker name you want to monitor
- Length: length parameter used on Donchian Channel indicator
█ FEATURES
The screener can scan up to 10 symbols each time.
█ LIMITATIONS
The screener will scan the symbols breaking out bands on the current bar, and as such, there maybe some delays depending on the stock/ etf /crypto you choose. Some exchanges require an additional subscription to get realtime data.

Bitcoin Golden Bottom Oscillator (MZ BTC Oscillator)This indicator uses Elliot Wave Oscillator Methodology applied on "BTC Golden Bottom with Adaptive Moving Average" and Relative Strength Index of Resulted EVO to form an Oscillator to detect trend health in Bitcoin price. Ticker is set to "INDEX : BTCUSD" on 1D timeframe.
Methodology
Oscillator uses Adaptive Moving Average with 1 year of length, Minor length of 50 and Major length of 100 to mark AMA as Golden Bottom.
Percentage Elliot Wave Oscillator is calculated between BTC price and AMA.
Relative Strength Index of EVO is calculated to detect trend strength and divergence detection.
Hull Moving Average of resulted RSI is used to smoothen the Oscillator.
Oscillator is hard coded to 'INDEX:BTCUSD' ticker on 1d so it can be used on any other chart and on any other timeframe.
Color Schemes
Bright Red background color indicates that price has left top Fib multiple ATR band and possibly go for top.
Light Red background color indicates that price has left 2nd top Fib multiple ATR band and possibly go for local top.
Lime background color indicates that price has entered lowest band indicating local bottom.
Bright Green background color indicates that price is approximately resting on Golden Bottom i.e. AMA.
Oscillator color is set to gradient for easy directional adaption.
BTC Golden Bottom with Adaptive Moving Average

Historical Range (Using eStrategy library)⬜ The script is intended to cover few things.
▶ Strategy testing framework based on eStrategy library
▶ Using historicalrange of values for identifying better entry and exits.
This is also built on top of the Systematic Investment Plan script published here
⬜ Strategy testing framework
Strategy testing framework is different from tradingview default strategy testing from few ways to suit the needs of systematic investments.
▶ Supports recurring investment on top of initial investment to emulate adding further funds to the investment bucket on regular basis.
▶ Better calculation of drawdowns based on daily equity rather than drawdown calculated only on close of trade.
▶ Provides better control over how much strategy can reduce and reload
Having said that, this framework is not intended as replacement for tradingview strategy framework. It is not as comprehensive as tradingview strategy framework. But, created to address few specific styles of strategy.
▶ No detailed trade stats on individual trades. But, this can be implemented in future versions
▶ At present only facilitates long positions.
▶ UI features such as plotting trades on chart are not available.
▶ Does not take into consideration of slippage and brokerage - this is not an issue because the framework is not meant for short term trades. It is only made for daily timeframes.
▶ No pyramiding or leverage possible.
And many more...
Framework can be used for similar strategies based on market timing with few small changes.
⬜ Historical Range Strategy
Concept here is, instead of taking indicators such as oscillators as is, use historical percentile to derive better oversold and overbought conditions. Strategy provides different options to base historical range. This can either be based on
▶ Band percent
▶ Oscillator
Different choices of bands and oscillators are also available to chose. However, have not done extensive testing on all the combinations.
⬜ Settings
▶ Initial and recurring investment settings (As confirm inputs)
▶ Buy and hold and strategy specific settings to be used for stat calculation
▶ Band and oscillator parameters
These are straightforward parameters which is used for defining the base of either bands or oscillators.
▶ Percentile moving average parameter
Percentile MA is used with Percentile to find entry and exit signals based on crossover and crossunder.
Feedbacks and suggestions welcome.

Coin Bureau BB/EMA/RSI IndicatorThis indicator was inspired by Coin Bureau's How To Spot The Crypto Top video. In the video, Coin Bureau uses Bollinger bands, 7-period EMA and RSI to look for early signs of a top, thus presenting an opportunity to sell.
Using the basic principles found in the video, I've made a tentative indicator as a way to visualise all 3 indicators at once. Alerts will only fire when all 3 criteria are met:
Price closes outside 20-period Bollinger bands
Price closes ~2sd away from 7-period EMA
RSI is overbought or oversold
The indicator will also update in real-time and show when 1, 2 or all 3 conditions are satisfied. Additionally, there is built-in functionality to toggle historical/current alerts and users can set their own bounds for what constitutes a buy or sell alert.
This is just a personal project purely for edutainment purposes and should not be used to make financial decisions. This project is not affiliated with Coin Bureau.
Some caveats:
Using only 7 periods to calculate the standard deviation of price data will not lead to a statistically significant result, thus this figure may have no right being in the script. However, this was more to trial some techniques and to get acquainted with the pine scripting language.
As you can see, there are a lot of false positives. There are moments when the indicator flashes a sell alert only for the price to keep on rising. This is due to the specificity/sensitivity trade-off. The indicator has been tuned to give the optimal sensitivity (the more critical component). These are the best results I could find for this asset in this time frame.

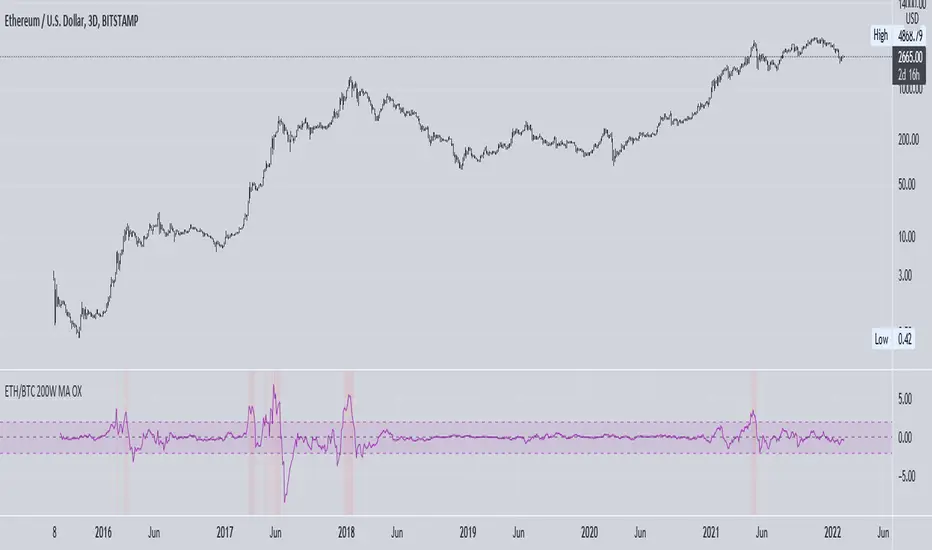
ETH vs BTC 200W SMA OverextensionHistorically, when BTC suffers a correction and ETH continues to rally, this hints at an impending market-wide correction. In Jan 2018, ETH rallies while BTC corrects, signalling the end of the bull cycle. In May 2021, ETH rallies while BTC ranges between $50-$60k, then a major correction occurs. This indicator attempts to monitor this phenomenon in order to help spot potential macro tops in the cryptocurrency market.
The indicator takes the price of the asset and divides it by the 200 week SMA value. This gives an over/undervaluation in percentage terms. When ETH becomes significantly more overvalued relative to BTC, the indicator will warn of a potential top forming (see red shaded areas).
This is for edutainment purposes only. Don't make financial decisions based on this indicator.
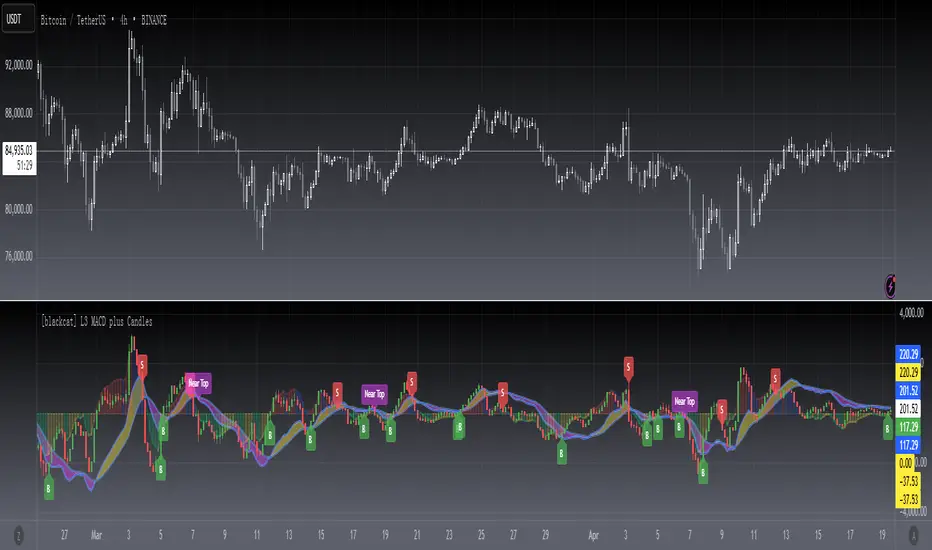
[blackcat] L3 MACD plus CandlesLevel: 3
Background
Many people need to judge the market trend against the main candlestick chart when using MACD.
Function
First of all, the principle of MACD is the difference between EMA's long-term and short-term values. So, I wonder if it is possible to use EMA to construct a set of candle charts that are similar in proportion to MACD values for overlapping comparisons? Because this can greatly facilitate traders to make quick trend judgments. So I used the 3-8 lines of EMA to simulate the KD of KDJ, constructed a set of candle charts, and generated buying and selling points through conditional constraints. Do you like this MACD + Candlestick chart?
Inputs
N/A
Key Signal
Traditional MACD output signal
Candlesticks
Near Top --> Top is reached and reversal may happen soon. (fuchsia labels)
Near Bottom --> Bottom is reached and reversal may happen soon. (yellow labels)
Remarks
This is a Level 3 free and open source indicator.
Feedbacks are appreciated.
Average True Range (ATR) invisible price markers / linesThis script provides the ATR price when added to the top and bottom of the currently hovered candle.
The prices are shown top left next to the indicators' name.
This means you do not have to manually subtract or add ATR to price.
Line opacity allows you to show the lines where the ATR is, however, I recommend to keep this disabled.
Line type allows you to choose where ATR is calculated from (LowHigh or LowHighBody), the second ignoring the wicks, however LH is standard.
I also recommend to keep the other parameters as default.
I hope this indicator provides useful to you and your trading.

Ex's DMI DivergenceThis indicator I am posting open for everyone to see and use.
This is a modified DMI indicator, It has a DMI+ and DMI- and a 3rd line that is the average divergance/convergance of the two.
This indicator is used to recognize periods of consolidation, directional strength and retracements/reversal
There are some key things to watch for:
-When the Div/Conv line is yellow it means that the DMI+/- average distance is moving closer together(converging)
-When the Div/Conv line is aqua it means that the DMI+/- average distance is moving further apart(diverging)
-One DMI must be below the top threshold and other DMI must be below at least the Top threshold(or bottom if you prefer) to be considered valid
Signs of condolidation/possible reversal/weak strength:
-When the DMI+/- are crossing at any location stay mindful of entries
-If both DMI's are above the threshold there is no clear direction
-When the DMI Div/Conv is yellow it means trend is slowing down and aqua means it is picking up

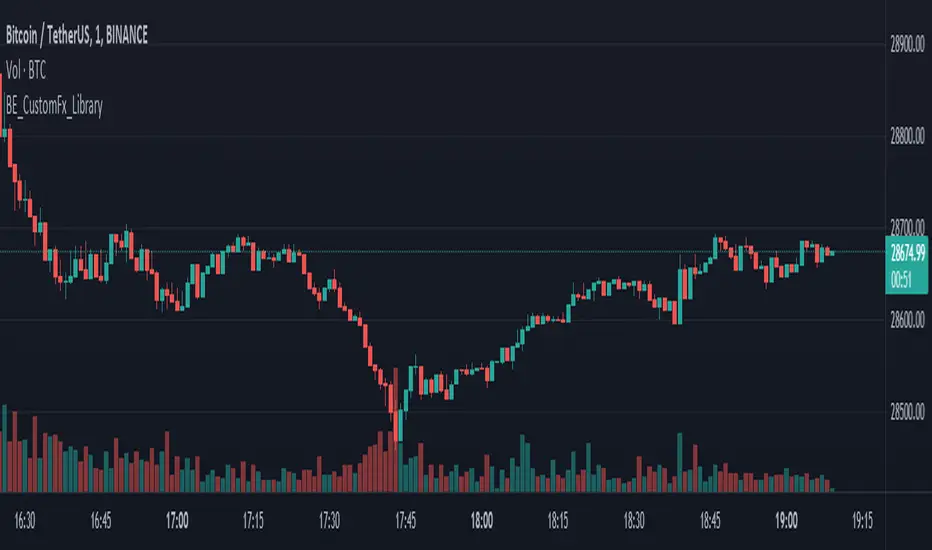
BE_CustomFx_LibraryLibrary "BE_CustomFx_Library"
A handful collection of regular functions, Custom Tools & Utility Functions could be used in regular Scripts. hope these functions can be understood by a non programmer like me too.
G_TextValOfNumber(ValueToConvert, RequiredDecimalPlaces, BeginingChar, EndChar) Function to return the String Value of Number with decimal precision with the prefix and suffix characters provided
Parameters:
ValueToConvert : = Number to Convert
RequiredDecimalPlaces : = No of Decimal values Required. supports to a max of 5 decimals else defaults to 2
BeginingChar : = Prefix character which is needed.
EndChar : = Suffix character which is needed.
Returns: Returns Out put with formated value of Given Number for the specified deicimal values with Prefix and suffix string
G_TradableValue(ValueToConvert, NeedCustomization, RequiredDecimalPlaces) Function to return the Tradable Value of Number
Parameters:
ValueToConvert : = Number to Convert
NeedCustomization : = set to 1 if you want to customize the decimal percision values. default is No customization needed, which provides output equalent to round_to_mintick
RequiredDecimalPlaces : = if NeedCustomization is set to 1 mention the decimal percision value required. max supported decimal is 5 else defaults to 2
Returns: Returns Out put with formated value of Given Number
G_TxtSizeForLables(SizeValue) Function to Get size Value for text values used in Lables
Parameters:
SizeValue : = auto, tiny, small, normal, large, huge. specify either of these values or default value Normal will be displayed as output
Returns: Returns Respective Text size
G_Reg_LineType(LineType) Function to Get Line Style Value for text values used in Lines
Parameters:
LineType : = 'solid (─)', 'dotted (┈)', 'dashed (╌)', 'arrow left (←)', 'arrow right (→)', 'arrows both (↔)' or default line style 'dotted (┈)' will be the output
Returns: Returns Respective Line style
G_ShapeTypeForLables(ShapeType) Function to Get Shape Style Value for text values used in plot shapes
Parameters:
ShapeType : = 'XCross', 'Cross', 'Triangle Up', 'Triangle Down', 'Flag', 'Circle','Arrow Up', 'Arrow Down','Lable Up', 'Lable Down' or default shpae style Triangle Up will be the output
Returns: Returns Respective Shape style
G_Indicator_Val(string, float, int, int) Gets Output of the technical analyis indicator which has length Parameter. RSI, ATR, EMA, SMA, HMA, WMA, VWMA, 'CMO', 'MOM', 'ROC','VWAP'
Parameters:
string : IndicatorName to be specified
float : SrcVal for the TA indicator default is close
int : Length for the TA indicator
int : DecimalValue optional to specify if required formatted output with decimal percision
Returns: Value with the given parameters
G_CandleInfo(string, bool, float, bool) function to get Candle Informarion such as both wicksize, top wick size , bottom wick size, full candle size and body size in default points
Parameters:
string : WhatCandleInfo, string input with either of these options "Wick" , "TWick" , "BWick" , "Candle", "Body" , "BearfbVal", "BullfbVal" , "CandleOpen" ,"CandleClose", "CandleHigh" , "CandleLow", "BodyPct"
bool : RepaintingVersion, set to true if required data on the realtime bar else default is set to false
float : FibValueOfCandle, set the fibo value to extract fibvalue of the candle else default is set to 38.2%
bool : AccountforGaps, set to true if required data on considering the gap between previous and current bar else default is set to false
Returns: Returns Respective values for the candles
G_BullBearBarCount(int, int) Counts how many green & red bars have printed recently (ie. pullback count)
Parameters:
int : HowManyCandlesToCheck The lookback period to look back over
int : BullBear The color of the bar to count (1 = Bull, -1 = Bear), Open = close candles are ignored
Returns: The bar count of how many candles have retraced over the given lookback with specific candles
BarToStartYourCalculation(Int) function to get candle co-ordinate in order to use it further for calculating your analysis work . "Heart full Thanks to 3 Pine motivators (LonesomeTheBlue, Myank & Sriki) who helped me cracking this logic"
Parameters:
Int : SelectedCandleNumber (default=450) How many candles you would need to anlysie in your script from the right.
Returns: A boolean - output is returned to say the starting point and continue to diplay true for the future candles
isHammer(float, bool, bool) Checks if the current bar is a hammer candle based on the given parameters
Parameters:
float : fib (default=0.382) The fib to base candle body on
bool : colorMatch (default=false) Does the candle need to be green? (true/false)
bool : NeedRepainting (default=false) Specify True if you need them to calculate on the realtime bars
Returns: A boolean - true if the current bar matches the requirements of a hammer candle
isStar(float, bool, bool) Checks if the current bar is a shooting star candle based on the given parameters
Parameters:
float : fib (default=0.382) The fib to base candle body on
bool : colorMatch (default=false) Does the candle need to be red? (true/false)
bool : NeedRepainting (default=false) Specify True if you need them to calculate on the realtime bars
Returns: A boolean - true if the current bar matches the requirements of a shooting star candle
isDoji(float, float, bool) Checks if the current bar is a doji candle based on the given parameters
Parameters:
float : _wickSize (default=1.5 times) The maximum allowed times can be top wick size compared to the bottom (and vice versa)
float : _bodySize (default= 5 percent to be mentioned as 0.05) The maximum body size as a percentage compared to the entire candle size
bool : NeedRepainting (default=false) Specify true if you need them to calculate on the realtime bars
Returns: A boolean - true if the current bar matches the requirements of a doji candle
isBullishEC(float, float, bool, bool) Checks if the current bar is a bullish engulfing candle
Parameters:
float : _allowance (default=0) How many POINTS to allow the open to be off by (useful for markets with micro gaps)
float : _rejectionWickSize (default=disabled) The maximum rejection wick size compared to the body as a percentage
bool : _engulfWick (default=false) Does the engulfing candle require the wick to be engulfed as well?
bool : NeedRepainting (default=false) Specify True if you need them to calculate on the realtime bars
Returns: A boolean - true if the current bar matches the requirements of a bullish engulfing candle
isBearishEC(float, float, bool, bool) Checks if the current bar is a bearish engulfing candle
Parameters:
float : _allowance (default=0) How many POINTS to allow the open to be off by (useful for markets with micro gaps)
float : _rejectionWickSize (default=disabled) The maximum rejection wick size compared to the body as a percentage
bool : _engulfWick (default=false) Does the engulfing candle require the wick to be engulfed as well?
bool : NeedRepainting (default=false) Specify True if you need them to calculate on the realtime bars
Returns: A boolean - true if the current bar matches the requirements of a bearish engulfing candle
Plot_TrendLineAtDegree(float, float, int, string, bool) helps you to plot the Trendlines based on the specified angle at the defined price to bar ratio
Parameters:
float : Degree (default=14) angle at which Trendline to be plot
float : price2bar_ratio (default=1e-10) The maximum rejection wick size compared to the body as a percentage
int : Bars2Plot (default=6) Does the engulfing candle require the wick to be engulfed as well?
string : LineStyle = 'solid (─)', 'dotted (┈)', 'dashed (╌)', 'arrow left (←)', 'arrow right (→)', 'arrows both (↔)' or default line style 'dotted (┈)' will be the output
bool : PlotOnOpen_Close (default=false) Specify True if you need them to calculate on the Open\Close Values
Returns: plot the Trendlines based on the specified angle at the defined price to bar ratio
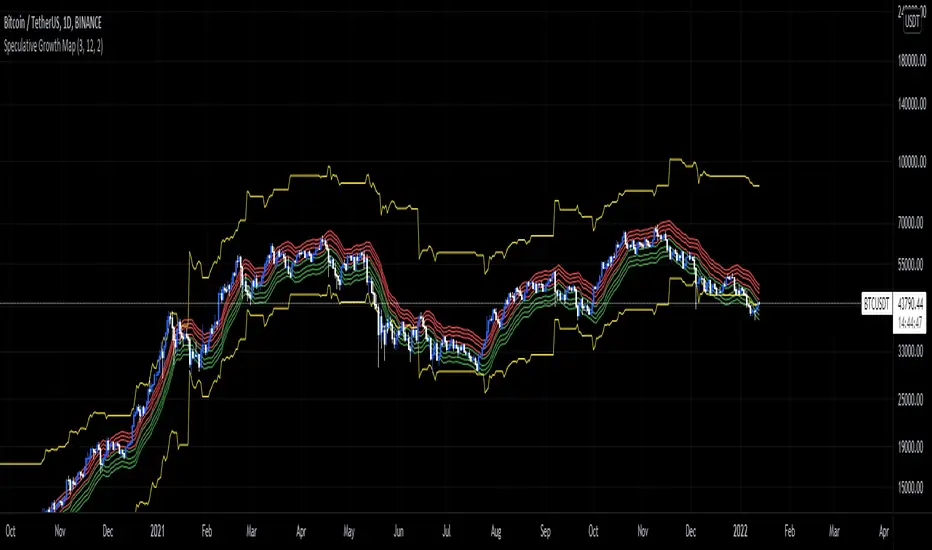
Speculative Growth Map (FOR BITCOIN)With the ever-increasing volatility flooding the cryptocurrency markets how do you ever know which side of the coin do you lie on in your investments?
The Speculative Growth Map, SGM, aims to show investors whether they are buying into the hype or actually getting a good deal on their purchase. This indicator works by working out the growth of the asset divided into eight major sections and two extreme scenarios. The first four lines, indicated by red. show that if the market enters into that area you should not be purchasing any more assets for that market as the market has entered into optimized growth. The next four lines, in green, indicate that you should be looking into purchasing the asset as it has entered a dip or a pullback. Next up, the yellow lines, indicate an extreme growth or extreme pullbacks. If the market comes close to either of these, it indicates major price action is about to occur.
How does it actually work?
It's pretty simple.
The SGM indicator works by creating EMAs of the close multiplied by 1%, 5%, 7.5%, and 10% growths for the hodl region in red. Vice Versa, EMAs of -1%, -5%, -7.5%, and -10% growth to indicate it's time to buy the asset. The yellow lines essentially mark out the bottom and the tops whenever the price goes below and above the buy and hodl region and then separates them into two but similar lines for the top and the bottom.
RSI Divergences + Bollinger Bands█ OVERVIEW
Here's the RSI divergences with Bollingers bands.
█ CONCEPTS
5 features
1 — RSI
2 — Bollinger bands
3 — RSI signal is in another color when above 70 or below 30
4 — Looking for previous Divergences, Bullish, Bearish and Hidden Bullish and Bearish but I don't like Hidden divergences
5 — Color fill when overbuy or oversold
█ OTHER SECTIONS
I like to see it like a moutain, with snow on top and lake on bottom. I think you don't want to start walking at the top, nor sink to the bottom of the lake for ever and ever.
It is an idea of sjoerd , tip him if you like it.
An oscillator is good to know where we are in the trends, but it's not enough to run a small business of trading, you need to learn how to use it.
What is a divergence ?
Thanks to The rational investor for teaching me how to use this indicator.
Signal Table - AutoFib - SMA - EMA - RSI - ATR - VolWith this indicator you can add a table on top of your chart.
What's in this table?
On which graph you open this table, the indicator data at the selected time of that graph are written. In the image below, you can see the table in the upper right.
You can also see two EMAs above the chart in this indicator. You can adjust their length.
You can add automatic fibonacci retracement levels to the top of the chart. In this way, you can see the Fibonacci levels on the chart and determine the support resistance. If the price is above the Fibonacci level, it will appear green on the chart, and red if below. You will understand as you use it.
It turns red if the RSI is below 30 and green if it is above 70.
Likewise, if the price is above the moving averages you have set, it appears as green, and if it is below it, it appears as red.
You can hide and activate the EMA and Fibonacci levels above the chart.
For example, you can get the ETH chart while the BTC chart is open in front of you. I think you will understand everything clearly from the settings tab below. Please support me. I hope you will be satisfied using it.

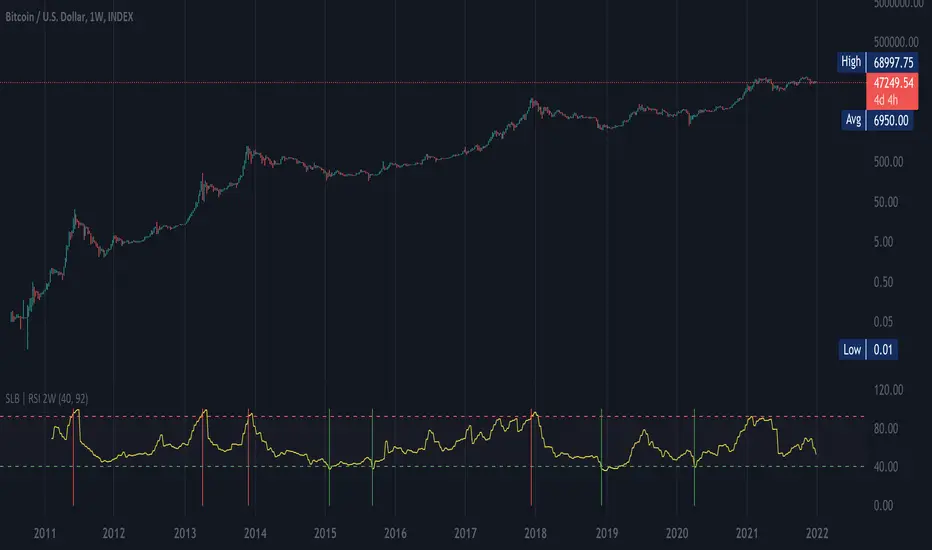
SLB | RSI 2WThis script shows RSI ( Relative Strength Index ) over a 2 week period (RSI2W). The RSI2W is used by some traders to identify tops and valleys.
Taking historical BTC values as an example, the RSI 92+ (red lines) matches with the historical tops, and the RSI 40- (green lines) matches with the valleys, a good chance of bull markets' start.
Position Size By Risk For Bar SizeThis simple script provides a way of calculating position size on a bar by bar basis for a fixed risk amount.
If you are trading a fixed risk amount (e.g. $100) per trade and your Entry and Stop is defined by a specific bar on the chart (any resolution e.g. 15 min, 5 min, 2 min etc) then this indicator will show you the position size you can take.
The user configures the risk amount per trade in the setting for the indicator, the default is 100 (e.g. $100).
It calculates each bar size (high - low) for the resolution of the chart that is being viewed.
The position size = (risk amount) / (bar size).
It then displays a "." (dot) for each bar and to see the position size hover your mouse over this dot .
The pane for this indicator can be set to the top of the chart by using the "Move pane up" option on the chart so that the indicator is easily accessible and discrete at the top of the chart.
Also, there is an option to use this indicator as a substitute for the built-in volume display.
EMA MTF PlusI like trading the 1 minute and 3 minutes time-frames. I'm what is commonly called a "scalper". Long term investments yes, I have some, but for trading, I don't have neither the time,
nor the patience to wait hours or days for my trade to be complete.
This doesn't mean I discount the higher time-frames, no, I actually rely heavily on them. I found that EMAs do a decent job as support/resistance, sometimes to a tick level of precision. And this is important for a 1 minute trader.
As such, I made this script that tracks the higher time-frames EMAs and displays the last value as a line.
I do not need the whole EMA, I'm not interested in crossovers or crossunders, these are anyway late signals for me.
What's with the triangles? These are local tops/bottoms , candles that have a have decent size of the wick. These tops and bottoms are by no means "final", they are merely a rejection at certain levels of price. Due to markets complexities (and human erratic behaviors hehe) these levels could be breached at the very next candle. For a more "final" version (nothing is really final but..) I added Schaff Trend Cycle as filter, so a triangle will pop only when a trend is mature enough ( STC with a value near 0 or near 100).
Colored bars. When the body of the candle is big, it shows strength. Strong bars tend to have follow through, especially when breaking key levels. The script looks at the body of the candle and compares it with ATR (Average True Range), if it's at least 0.8 of ATR it changes the bar color to yellow (bull candles) or fuchsia(bear candles).
Range identifier. This code is copied from Lazy Bear (if there are any issues please let me know), it's very useful in conjunction with colored bars.
I look for breakout candles that go outside of the range as a signal for a trade.
There are many ways in which this script can be useful, like trading mean reversions or momentum trades (breakouts) or simply trend following trades.
I hope you guys find it useful, you can play with default values and change them as you like, these are what I found to be working best for me and my trading universe (mostly crypto).
Special thanks for the original work of:
LazyBear
everget
Jim8080

Gann FanHello All,
For long time I have been getting many requests about Gann Fan indicator. now we have linefill() function in Pine Language and I think it's right time to make Gann Fan Indicator. Many Thanks to Pine Team for adding many new features to the Pine Language!
How this indicator works:
- It calculates midline (1/1)
- By using midline it calculates other lines (1/2, 1/3, 1/4...etc)
- It calculates highest/lowest Pivot Points in last 280 bars.( by default it's 280 bars, you can change it and pivot period )
- It checks the location of highest/lowest Pivot Points
- After the calculation of the Gann Fan lines, it draws lines, puts Labels and paints the zones between the lines according to the colors set by the user
Long time ago I created a special algorithm for calculating the line with 45 degree and I used it for "1/1" line. Anybody who needs it can use this algorithm freely ;)
Options:
You can change following items;
- The colors
- Transparency. Possible values for transparency are from 0 (not transparent) to 100 (invisible)
- Line styles
- Loopback Period (by default it's 280)
- Pivot Period (by default it's 5)
- Enable/disable Labels
- Label location (by default it's 50
Tradingview Gann Fan page : The Gann Fan is a technical analysis tool created by WD Gann. The tool is comprised of 9 diagonal lines (extending indefinitely) designed to show different support and resistance levels on a chart. These angles -drawn from main tops and bottoms- divide time and price into proportionate parts and are often used to predict areas of support and resistance, key tops and bottoms and future price moves. Please note that the chart needs to be scaled properly to ensure the market has a square relationship....
Enjoy!

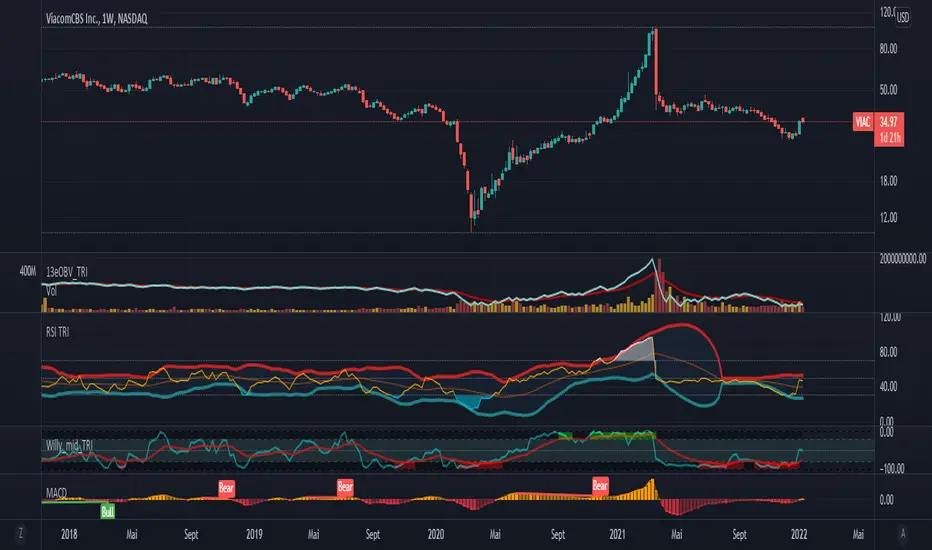
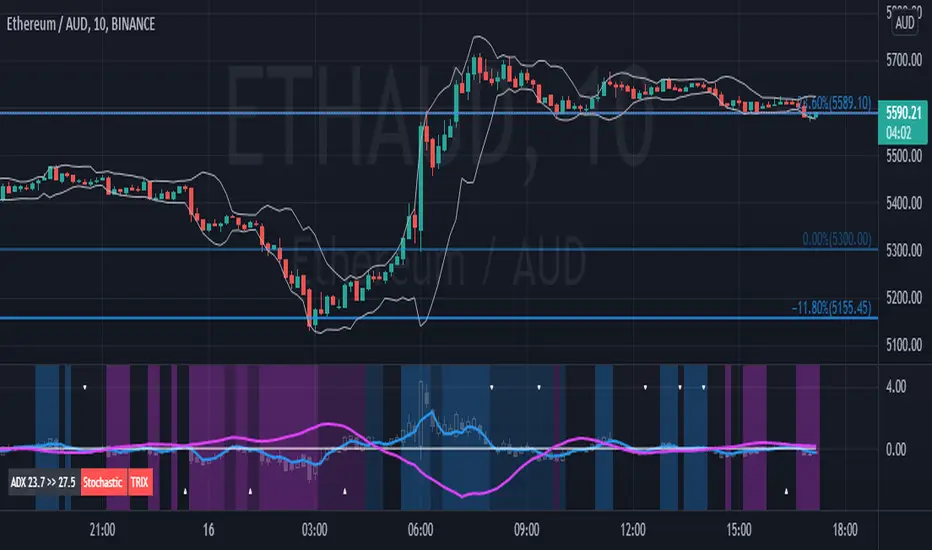
Didi Index PlusAbout this indicator (translation to Portuguese on the second half of the description):
The indicator follows the way Didi Aguiar teaches his trading system. Didi Aguiar is an old school Brazilian trader with over 40 years experience, who created the Didi Index and the famous agulhadas - or how I like to say in English: threads in the needle, an explosive price movement.
This version of the Didi Index adds what matters about DMI/ADX, Stochastic and TRIX to the regular Didi Index indicator.
The lines indicate alert and confirmations:
BLUE line crossing UP white line - BUY alert
PINK line crossing DOWN white line - BUY confirmation
Simultaneous Buy Alert and Confirmation = BUY AGULHADA.
BLUE line crossing DOWN white line - SHORT alert
PINK line crossing UP white line - SHORT confirmation
Simultaneous Short Alert and Confirmation = SHORT AGULHADA.
The background color changes according to the way Didi Aguiar reads the DMI and ADX.
Blue = Up trend
Bright Blue = Accelerating up trend
Purple = Down trend
Bright Purple = Accelerating down trend
Change from bright to dark color = ADX's bounce.
No coloured background = no trend.
The triangles on the top and bottom of the chart are the exit indicators.
They appear every time the Fast Stochastic and TRIX are in agreement:
Triangle on TOP of the chart means to EXIT LONG position.
- TRIX is selling and Stochastic just gave the sell signal; OR
- Stochastic is selling and TRIX just gave the sell signal
Triangle on BOTTOM of the chart means to EXIT SHORT position.
- TRIX is buying and Stochastic just gave the buy signal; OR
- Stochastic is buying and TRIX just gave the buy signal
Use this indicator with Bollinger Bands or other volatility indicator.
Not recommended for color-blind people :)
-----------------------------------------
Esse indicador segue a maneira que Didi Aguiar ensina o seu "trading system". Didi Aguiar é um trader velha-guarda com mais de 40 anos de experiência, que criou o Didi Index e as famosas Agulhadas, um movimento the preço explosivo.
Essa versão do Didi Index inclui o que interessa sobre outros três indicadores que o Didi usa em seu sistema: DMI/ADX, TRIX, e Estocástico.
As linhas indicam alerta e confirmação para o trade:
Linha AZUL cruzando a linha branca de BAIXO PARA CIMA - Alerta de compra
Linha ROSA cruzando a linha branca de CIMA PARA BAIXO - Confirmação de compra
ALERTA e CONFIRMAÇÃO de compra simultaneos = AGULHADA DE COMPRA
Linha AZUL cruzando a linha branca de CIMA PARA BAIXO - Alerta de venda
Linha ROSA cruzando a linha branca de BAIXO PARA CIMA - Confirmação de venda
ALERTA e CONFIRMAÇÃO de cenda simultaneos = AGULHADA DE VENDA
A cor do fundo muda de acordo com a maneira que o Didi lê o DMI e ADX
Fundo AZUL = Tendencia de compra
Fundo ROXO = Tendencia de venda
Cor mais saturada (vibrante) = Tendencia acelerante
Passou de cor mais clara para mais escura = Kick do ADX
Sem coloração de fundo = Sem tendencia
Os triângulos brancos na parte de cima e de baixo do indicador sinalizam a saida do trade.
Aparecem todas a vezes que o Etocastico e o TRIX ficam de acordo.
Triangulo na parte de CIMA sinaliza a SAÍDA da COMPRA.
- TRIX está vendido e o Estocástico acabou de vender; OU
- Estocástico está vendido e o TRIX acabou de vender
Triangulo na parte de BAIXO sinaliza a SAÍDA da VENDA.
- TRIX está comprado e o Estocástico acabou de comprar; OU
- Estocástico está comprado e o TRIX acabou de comprar
Use esse indicador em conjunto com as Bandas de Bollinger ou outro indicador de volatilidade.
Não é indicado para pessoas que sofrem de daltonismo :)
[JL] Stochastic Divergence AlertCompare two cross area:
k is increasing, low is lower and previous k is less than bottom level then it is bottom divergence
k is decrease, high is higher and previous k is more than top level then it is top divergence
With long term moving average(400), seems that Stochastic Divergence is more accurate than RSI Divergence on 1m chart.

Market Breadth EMAsThis is the combined market breadth tickers: S5TW, S5FI, S5OH, and S5TH representing the percentage of S&P 500 stocks above their 20, 50, 100, and 200 EMA respectively. The colors go from green (20) to red (200) because if 20 crosses above the 200, the market's bullish, and if the 20 crosses below the 200, the market is bearish. So if green is on top = bull market. If red is on top = bear market. In general the market sentiment is whichever color is highest up.
The background is colored in depending on a few historical extremes in the 200. The darker the color the more significant the buy/sell signal. These can be adjusted by changing the hline's in the code.

Joint Conditions Strategy Suite + TradingConnector alerts bot"Please give us combined alerts with the possibility of having several conditions in place to trigger the alert." - was the top voted request from users under one of the recent blogposts by TradingView.
Ask and you shall receive ;)
TradingView is a great platform, with unmatched set of functionalities, yet this particular combo of features indeed seems not to be in place. Fortunately, TradingView is also very open platform, thanks to PineScript coding language, which enables developing combos like the requried one and plenty of other magic.
I have already published numerous "educational" scripts, showing how to code indicators and alerts with PineScript, but... this is not one of them. This one is for real. READY FOR USE on real markets, also by the non-coding traders. Just take my script, set parameters with dropdowns, backtest the strategy, fire the alerts and execute them.
HOW TO USE IT
In "Settings" popup I tried to mimic the CreateAlert popup dropdowns for selecting logic. Let's say you want to enter Long position at Stochastic KxD crossover. In first line of Long Entry conditions set "StochK" + "Crossing Up" + "StochD". Last field doesn't matter because in 3rd dropdown something else than "value" was selected. In second line you could set "maB" + "Greater Than" + "maC" to filter out those entries which are in direction of the uptrend. And yeah, add ADX>25 to make sure the market is actually moving: "ADX" + "Greater Than" + "value" + "25". All condition lines must be TRUE (or skipped) for the entry to be triggered. Toghether with an alert.
The same for Short entries. Combinations are limitless.
INDICATORS AND MTF (MULTI-TIMEFRAME)
In those dropdowns you can select candle values like open/close/high/low/ohlc4, but also some most popular indicators, which I have pre-built into this script: RSI, various Moving Averages, ADX-DMI, Stochastic and Bollinger Bands for start. You can configure parameters of those indicators also in "Settings" popup, in "Indicator Definitions" section. What's important, you can use any of these indicators from higher timeframe, setting MTF multiplier. So if you applied this indicator to 1h chart, but want to use rsi(close,14) from 4h chart, set MTF to 4. If you want to use current timeframe indicators, keep MTF at 1, which is a default setting here.
Note for coders: to keep focus of this script on joining conditions, entire logic for those indicators has been moved to external library, also open source. I encourage you to dig into the code and see how it's done. I love the addition of libraries concept in PineScript.
CUSTOM INDICATOR
Following the "openness" spirit of my master - which is TradingView itself - my work is also open, in 2 ways:
1. This script is open source. So you can grab it, modify or add any functionalities you want. I cannot and don't want to stop you from doing that. I'm asking for only one favor - please mention this source script in your credits.
2. You can import the plot (series) from any other indicator on TradingView. In Settings popup of my script, scroll down to "Indicator Definitions" section, and select the series of your choice in the first dropdown. Now it is ready to use in conditions dropdowns on top of the Settings popup.
Let me give you an example of that last scenario. Take another script of mine, "Pivot Points on SR lines DEMO". You can find it in "Indicators & Strategies" library or here: (). Attach it to your chart. Now come back to THIS script, open Settings popup and in "Custom Indicator aka Imported Source" select "Pivot Points on SR lines: ...". The way it works - it detects if a pivot point happened on Support/Resistance line from the past and returns 1 for PivotLow and -1 for Pivot High. Now in first Long Entry condition set: "custom indicator" + "Greater Than" + "value" + "0" and long entries will be marked on every pivot low noticed on Support/Resistance line.
ALERTS
Last but not least - the alerts. This script produces alerts on the entries calculated by strategy logic, as marked on the chart by the backtester. Moreover, syntax of those alerts is already prepared and fully compatible with TradingConnector - alerts executing tool (bot), if you want to auto-execute those trades. Apart from installing the tool, you need to set
up the alerts in TradingView, here is how:
open CreateAlert popup
in first dropdown select "Joint Conditions Strategy Template"
in second dropdown select "alert() function calls only"
And that's all. You only need to set one alert for the whole script, not one for Longs and one for Shorts as it was in the past. Also, you don't need to setup closing alerts, because stop-loss/take-profit/trailing-stop information is embedded in the entry alert so your broker receives it as early as possible. Alerts sent will look like this: "long sl=40 tp=80", which is exactly what TradingConnector expects.
Phew, that's all folks. If you think I should add something to this template (maybe other indicators?) please let me know in comments or via DM. Happy trading!
P.S. Pyramiding is not supported in this script.
Disclaimer : I'm not saying above combination of conditions will make you money. Actually none of this can be considered financial advice. It is only a software tool. Use it wisely, be aware of the risk and do your own research!
