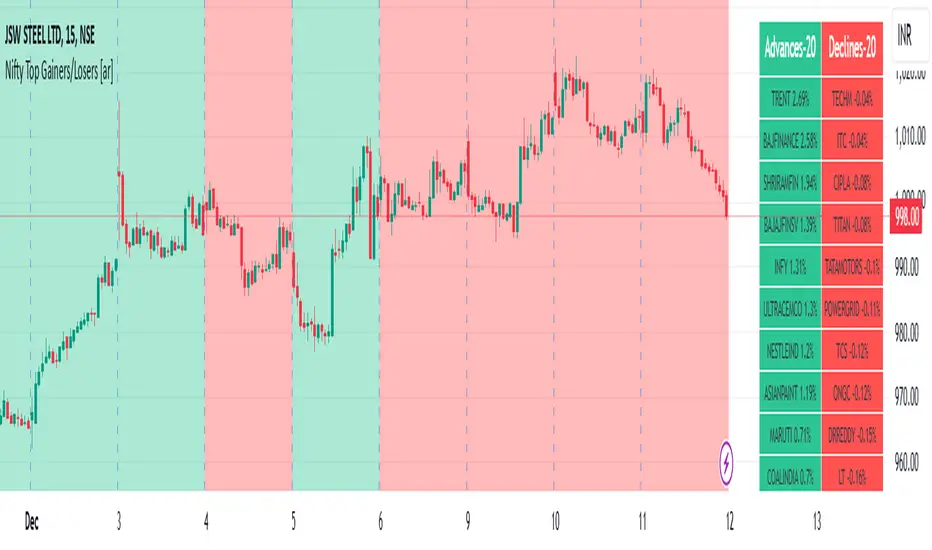
Nifty Top Gainers/Losers [ar]Nifty Top Gainers/Losers - Real-time Market Performance Tracker
A powerful indicator that monitors and displays real-time performance of 40 major Nifty stocks in a clean, organized table format. Perfect for traders seeking instant market breadth insights.
Key Features:
• Dynamic advances/declines counter at the top
• Real-time percentage change calculations
• Color-coded display (green for gainers, red for losers)
• Customizable reference points (Previous Day Close/Today's Open)
• Optional background color based on market breadth
• Flexible top gainers/losers limit setting
Customization Options:
- Adjust colors for gainers and losers
- Set transparency for background
- Modify the number of top performers to display
- Add/remove symbols from the watchlist
- Choose calculation reference (Previous Day Close/Today's Open)
Ideal for:
- Day traders monitoring market momentum
- Investors tracking sector rotation
- Analysts studying market breadth
- Portfolio managers seeking quick market overview
This indicator helps identify market leaders and laggards at a glance, making it an essential tool for informed trading decisions.
Cari dalam skrip untuk "top"
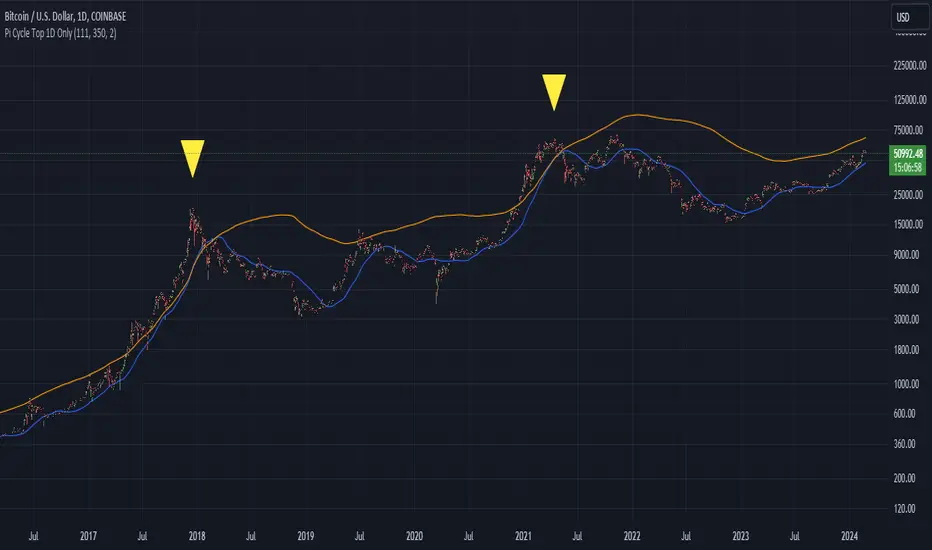
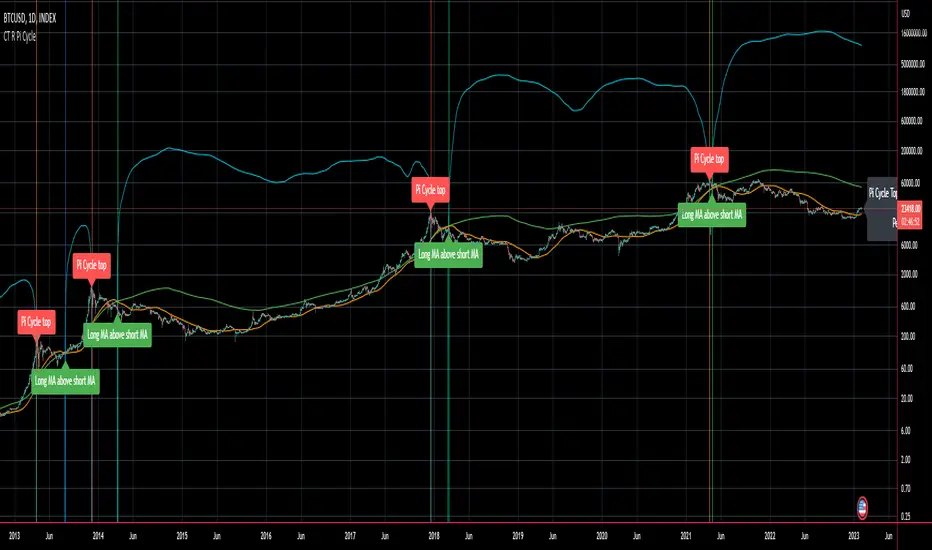
Bitcoin Pi Cycle Top Indicator - Daily Timeframe Only1 Day Timeframe Only
The Bitcoin Pi Cycle Top Indicator has garnered attention for its historical effectiveness in identifying the timing of Bitcoin's market cycle peaks with remarkable precision, typically within a margin of 3 days.
It utilizes a specific combination of moving averages—the 111-day moving average and a 2x multiple of the 350-day moving average—to signal potential tops in the Bitcoin market.
The 111-day moving average (MA): This shorter-term MA is chosen to reflect more recent price action and trends within the Bitcoin market.
The 350-day moving average (MA) multiplied by 2: This longer-term MA is adjusted to capture broader market trends and cycles over an extended period.
The key premise behind the Bitcoin Pi Cycle Top Indicator is that a potential market top for Bitcoin can be signaled when the 111-day MA crosses above the 350-day MA (which has been doubled). Historically, this crossover event has shown a remarkable correlation with the peaks of Bitcoin's price cycles, making it a tool of interest for traders and investors aiming to anticipate significant market shifts.
#Bitcoin
CVI Tops/Bottoms Detector [AstroHub]
Welcome to the realm of precision trading with the CVI Tops/Bottoms Detector by AstroHub. Crafted with a keen eye on market dynamics, this indicator stands as a reliable tool for identifying potential trend reversals and market turning points.
Key Features of the Indicator:
The CVI Tops/Bottoms Detector, developed by AstroHub, is a powerful tool designed to detect tops and bottoms in the market. Its calculations are based on sound mathematical principles, ensuring accurate identification of bullish and bearish signals. 🔍
Calculation Period and Thresholds:
Calculation Period: Adjust the "Period" parameter to tailor the indicator to different timeframes.
Thresholds: Set the "Bullish Threshold" and "Bearish Threshold" to determine the sensitivity of the indicator to potential market shifts.
CVI Calculation:
The indicator calculates the Current Volume Index (CVI) by considering the difference between the closing price and the smoothed average, normalized by volatility. This innovative approach provides a clear view of market sentiment.
Visual Signals and Alerts:
Bullish and Bearish Signals: Clearly defined signals are represented by diamond shapes on the chart, accompanied by color-coded indications.
Gradient Colors: Gradient colors add a visual dimension to the signals, making it easier to interpret market trends.
Connecting Lines: Lines connect signals, offering a visual guide for understanding the flow of the market.
Symbol Transparency:
Customize the transparency of the underlying symbol to ensure clarity in signal visualization.
User-Friendly Customization:
Flexible Coloring: Tailor the colors of bullish and bearish signals to match your preferences.
Line Colors: Adjust line colors to enhance visibility.
Alerts: Receive timely alerts when a new bullish or bearish signal is detected.
Usage Example:
Open the indicator settings.
Adjust the "Period" to match your desired timeframe.
Fine-tune the "Bullish" and "Bearish Thresholds" based on your risk tolerance.
Experiment with customizing colors and transparency to suit your visual preferences.
Alerts for Proactive Trading:
Activate alerts to stay informed about potential bullish or bearish market opportunities. 🚨
By integrating the CVI Tops/Bottoms Detector into your trading toolkit, you gain a powerful ally in navigating the dynamic landscape of financial markets. 🌐💹

Flat Tops & BotttomsThe provided Pine Script code is an indicator script designed to identify and display flat tops and bottoms on a price chart.
Inputs:
showFlatTops (boolean): Determines whether to display flat tops.
showFlatBottoms (boolean): Determines whether to display flat bottoms.
enableAlerts (boolean): Enables or disables alerts for flat tops and bottoms.
Calculations:
Flat Top: if the current bar's high is equal to the open price. A downward-pointing triangle shape is plotted above the bar.
Flat Bottom: if the current bar's low is equal to the open price. An upward-pointing triangle shape is plotted above the bar.
Alerts:
Script allows to set alerts when flat tops or bottoms occur

Triple Top Patterns [theEccentricTrader]█ OVERVIEW
This indicator automatically draws triple top patterns and price projections derived from the ranges that constitute the patterns.
█ CONCEPTS
Green and Red Candles
• A green candle is one that closes with a close price equal to or above the price it opened.
• A red candle is one that closes with a close price that is lower than the price it opened.
Swing Highs and Swing Lows
• A swing high is a green candle or series of consecutive green candles followed by a single red candle to complete the swing and form the peak.
• A swing low is a red candle or series of consecutive red candles followed by a single green candle to complete the swing and form the trough.
Peak and Trough Prices (Basic)
• The peak price of a complete swing high is the high price of either the red candle that completes the swing high or the high price of the preceding green candle, depending on which is higher.
• The trough price of a complete swing low is the low price of either the green candle that completes the swing low or the low price of the preceding red candle, depending on which is lower.
Historic Peaks and Troughs
The current, or most recent, peak and trough occurrences are referred to as occurrence zero. Previous peak and trough occurrences are referred to as historic and ordered numerically from right to left, with the most recent historic peak and trough occurrences being occurrence one.
Broken and Unbroken Peaks and Troughs
Upon the completion of a new swing low the high of the green candle that completes the swing low will be above, below or equal to the current peak price. And similarly, upon the completion of a new swing high the low of the red candle that completes the swing high will be above, below or equal to the current trough price.
If the high price of the green candle that completes the current swing low is higher than or equal to the current peak price then the current peak is broken. If the high of the green candle that completes the current swing low is below the current peak price, then the current peak is unbroken.
Similarly, if the low price of the red candle that completes the current swing high is lower than or equal to the current trough price then the current trough is broken. If the low price of the red candle that completes the current swing high is above the current trough price, then the current trough is unbroken.
Range
The range is simply the difference between the current peak and current trough prices, generally expressed in terms of points or pips.
Retracement and Extension Ratios
Retracement and extension ratios are calculated by dividing the current range by the preceding range and multiplying the answer by 100. Retracement ratios are those that are equal to or below 100% of the preceding range and extension ratios are those that are above 100% of the preceding range.
Triple Bottom and Triple Top Patterns
• Triple bottom patterns are composed of two peaks and three troughs, with the second and third troughs being roughly equal to the first trough.
• Triple top patterns are composed of two troughs and three peaks, with the second and third peaks being roughly equal to the first peak.
Measurement Tolerances
In general, tolerance in measurements refers to the allowable variation or deviation from a specific value or dimension. It is the range within which a particular measurement is considered to be acceptable or accurate. In this script I have applied this concept to the measurement of triple bottom and triple top patterns to increase to the frequency of pattern occurrences.
For example, a perfect triple bottom is very rare. We can increase the frequency of pattern occurrences by setting a tolerance. A ratio tolerance of 10% to both downside and upside, which is the default setting, means we would have a tolerable ratio measurement range between 90-110% for the second and third troughs as ratios of the first trough, thus increasing the frequency of occurrence.
█ FEATURES
Inputs
• Unbroken Troughs
• Lower Tolerance
• Upper Tolerance
• Pattern Color
• Neckline Color
• Extend Current Neckline
• Show Labels
• Label Color
• Show Projection Lines
• Extend Current Projection Lines
Alerts
Users can set alerts for when the patterns occur.
█ LIMITATIONS
All green and red candle calculations are based on differences between open and close prices, as such I have made no attempt to account for green candles that gap lower and close below the close price of the preceding candle, or red candles that gap higher and close above the close price of the preceding candle. This may cause some unexpected behaviour on some markets and timeframes. I can only recommend using 24-hour markets, if and where possible, as there are far fewer gaps and, generally, more data to work with.

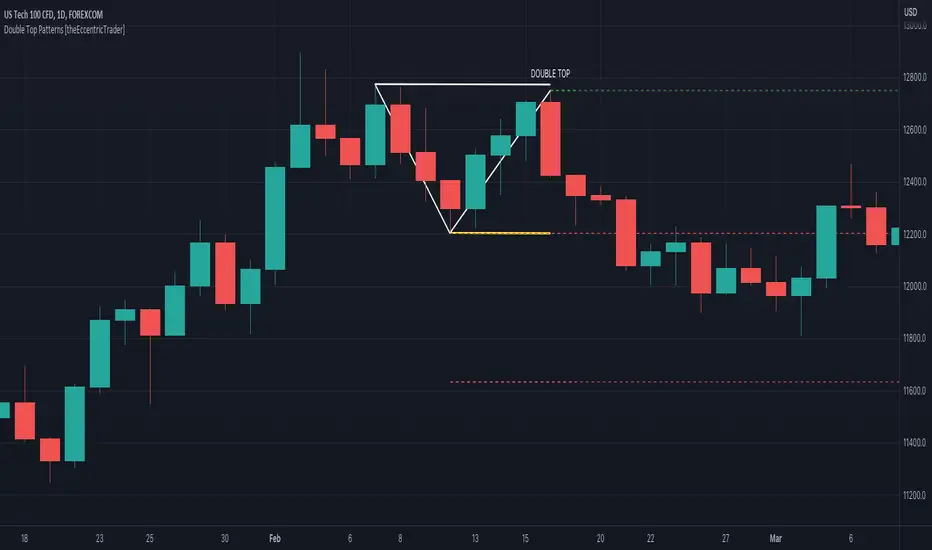
Double Top Patterns [theEccentricTrader]█ OVERVIEW
This indicator automatically draws double top patterns and price projections derived from the ranges that constitute the patterns.
█ CONCEPTS
Green and Red Candles
• A green candle is one that closes with a close price equal to or above the price it opened.
• A red candle is one that closes with a close price that is lower than the price it opened.
Swing Highs and Swing Lows
• A swing high is a green candle or series of consecutive green candles followed by a single red candle to complete the swing and form the peak.
• A swing low is a red candle or series of consecutive red candles followed by a single green candle to complete the swing and form the trough.
Peak and Trough Prices (Basic)
• The peak price of a complete swing high is the high price of either the red candle that completes the swing high or the high price of the preceding green candle, depending on which is higher.
• The trough price of a complete swing low is the low price of either the green candle that completes the swing low or the low price of the preceding red candle, depending on which is lower.
Historic Peaks and Troughs
The current, or most recent, peak and trough occurrences are referred to as occurrence zero. Previous peak and trough occurrences are referred to as historic and ordered numerically from right to left, with the most recent historic peak and trough occurrences being occurrence one.
Broken and Unbroken Peaks and Troughs
Upon the completion of a new swing low the high of the green candle that completes the swing low will be above, below or equal to the current peak price. And similarly, upon the completion of a new swing high the low of the red candle that completes the swing high will be above, below or equal to the current trough price.
If the high price of the green candle that completes the current swing low is higher than or equal to the current peak price then the current peak is broken. If the high of the green candle that completes the current swing low is below the current peak price, then the current peak is unbroken.
Similarly, if the low price of the red candle that completes the current swing high is lower than or equal to the current trough price then the current trough is broken. If the low price of the red candle that completes the current swing high is above the current trough price, then the current trough is unbroken.
Range
The range is simply the difference between the current peak and current trough prices, generally expressed in terms of points or pips.
Retracement and Extension Ratios
Retracement and extension ratios are calculated by dividing the current range by the preceding range and multiplying the answer by 100. Retracement ratios are those that are equal to or below 100% of the preceding range and extension ratios are those that are above 100% of the preceding range.
Double Bottom and Double Top Patterns
• Double bottom patterns are composed of one peak and two troughs, with the second trough being roughly equal to the first trough.
• Double top patterns are composed of one trough and two peaks, with the second peak being roughly equal to the first peak.
Measurement Tolerances
In general, tolerance in measurements refers to the allowable variation or deviation from a specific value or dimension. It is the range within which a particular measurement is considered to be acceptable or accurate. In this script I have applied this concept to the measurement of double bottom and double top patterns to increase to the frequency of pattern occurrences.
For example, a perfect double bottom is very rare. We can increase the frequency of pattern occurrences by setting a tolerance. A ratio tolerance of 10% to both downside and upside, which is the default setting, means we would have a tolerable ratio measurement range between 90-110% for the second trough, thus increasing the frequency of occurrence.
█ FEATURES
Inputs
• Unbroken Troughs
• Lower Tolerance
• Upper Tolerance
• Pattern Color
• Neckline Color
• Extend Current Neckline
• Show Labels
• Label Color
• Show Projection Lines
• Extend Current Projection Lines
Alerts
Users can set alerts for when the patterns occur.
█ LIMITATIONS
All green and red candle calculations are based on differences between open and close prices, as such I have made no attempt to account for green candles that gap lower and close below the close price of the preceding candle, or red candles that gap higher and close above the close price of the preceding candle. This may cause some unexpected behaviour on some markets and timeframes. I can only recommend using 24-hour markets, if and where possible, as there are far fewer gaps and, generally, more data to work with.
ATR and IV Volatility TableThis is a volatility tool designed to get the daily bottom and top values calculated using a daily ATR and IV values.
ATR values can be calculated directly, however for IV I recommend to take the values from external sources for the asset that you want to trade.
Regarding of the usage, I always recommend to go at the end of the previous close day of the candle(with replay function) or beginning of the daily open candle and get the expected values for movements.
For example for 26April for SPX, we have an ATR of 77 points and the close of the candle was 4296.
So based on ATR for 27 April our TOP is going to be 4296 + 77 , while our BOT is going to be 4296-77
At the same time lets assume the IV for today is going to be around 25% -> this is translated to 25 / (sqrt (252)) = 1.57 aprox
So based on IV our TOP is going to be 4296 + 4296 * 0.0157 , while our BOT is going to be 4296 - 4296 * 0.0157
I found out from my calculations that 80-85% of the times these bot and top points act as an amazing support and resistence points for day trading, so I fully recommend you to start including them into your analysis.
If you have any questions let me know !

Half-Pi Cycle CKB top indicator (insanely experimental)This is an insanely experimental script. It's a modified version of the Bitcoin pi-cycle top indicator.
It changes the Bitcoin pi-cycle top formula by halving the number of days in the two DMAs used in calculation, from 350/111 to 175/56. So I call it the half-pi cycle. It correctly picked the top of CKB (Nervos Network) vs USDT on Huobi in spring 2021 within three days.
It probably is a coincidence, and could very easily not pick the next cycle peak correctly at all. Using such a short number of days makes it a little dubious, but I had no choice since there's only so much price history for this coin. I strongly advise you to not make any trades based on this script ! I cannot be held accountable if you lose money due to this script. It hasn't been shown to be accurate multiple times like the Bitcoin pi-cycle top indicator. I simply find this interesting and want to see if it works next time.

Pi Cycle Top Ribbon [Mamo]This is a modification on the original Pi Cycle Top Indicator by Philip Swift.
It consists of 2 moving averages with one of them being multiplied by a chosen number. When the lower moving average crosses the higher (with multiple) moving average, the bull market top is indicated.
The original indicator showed bull market tops within a 3 day accuracy. This version shows the exact tops on the exact day for 2013 and 2017.
There are 7 different perfect solution shown as a band in this modified indicator. Each solution is a color pair and can be viewed separately by turning each combination off or on in the settings.
Double Top/BottomHere is an attempt to identify double top/bottom based on pivot high/lows.
Logic is simple.
Double Bottom:
Last two pivot High Lows make W shape
Last Pivot Low is higher than previous Last Pivot Low.
Last Pivot High is lower than previous last Pivot High.
Price has not gone below Last Pivot Low
Price breaks out of last Pivot High to complete W shape
Double Top:
Last two pivot High Lows make M shape
Last Pivot Low is higher than previous Last Pivot Low.
Last Pivot High is lower than previous last Pivot High.
Price has not gone above Last Pivot High
Price breaks out of last Pivot Low to complete M shape
Prameters:
Parameters PvtLenL , PvtLenR and waitforclose determines pivot points.
FilterPivots clears repetitive pivots formed in same direction before calculating the possible double top/bottom.
For example:
CheckForAbsolutePeaks and AbsolutePeakLoopback works together. When CheckForAbsolutePeaks is enabled, script only generates double bottom or top signal if previous last pivot is absolute high or low for AbsolutePeakLoopback periods.
ConsiderMovingAverage does two things. First, it makes sure that fast moving average and slow moving averages are aligned with the direction we are going to forecast. Second, it makes sure that the crossover happend recently and with last BarCrossoverLimit bars. For example, to call it double bottom, Fast MA should be higher than Slow MA and crossover of FastMA above SlowMA should have happened in last 10 bars (BarCrossoverLimit)
PivotDisplayMode can be Actual, Filtered or None. Actual will display all pivot high low generated. Filtered will only display last 5 pivot high and pivot lows which are filtered . That means, it will remove the repetitive pivots formed without making pivots on the other side.
Welcome and suggestions and feedbacks.

BOSCILLATOR. A BOSS OSCILLATORI would like to first say I do not the indicator pieces. Would like to personally give thanks and credit to @MarkBench for coding this indicator and helping to get my vision for this system finally able to be published and used by anyone. I would also like the thank @lazy bear and @ChrisMoody for their bringing the Firefly oscillator and the SCHAFF TREND and the PPO price percentage oscillator to trading view. and @scilentor for his version of Godmode with LSMA . Thanks to @Shizaru for bringing Frama moving average (which we have adopted into the PPO as one of the base selections for the first time, as well as the ALMA ). Divergences have also been added. and components of the firefly have been removed such as the histogram. I have added two oscillators in the picture. The bottom is the standard settings. The above is how I prefer mine to look after tweaking the settings.
Before I get into explaining how its used. I want to say all the indicators are open and none privately owned or at least owned by indivduals who brought them to trading view. Any due permission is granted at my disclocsure. I also want to say this is not your typical mashup of indicators as the is a very clear way to view and use this specifically. Also I want to say original tools from their original scripts are also improved. For example the PPO being used we have added the FRAMA and ALMA moving average basis option which it did not have before. And now everything has clear divergences and some other minor changers. but here are the rules and examples.
THE BOSCILLATOR - A MULTI-LEVEL CONFLUENCE/CONFIRMATION FILTER VISUALIZATION
Some shorthand
(Main oscillator - firefly)
(background wave thing - PPO )
(the red vertical up and down line with red and green dots - STC )
(the blue, yellow and red dots - warning dots)
WHO IS THIS INDICATOR FOR? - This indicator itself is not meant to be a signal giver to buy or sell right now even though it could be and some of the original scripts are used as such. This indicator is actually meant to be a VISUAL CONFIRMATION & FILTER for trades taken in other methods outside of this indicator. What are some of those methods that may benefit from having this? Pivot point traders, FIB traders, Bollinger band traders, Moving average traders.. just to name a few. This indicator itself is meant to in a quick glance allow the trade to see the condition of many different elements outside of the main price and chart, and determine if that trade looks like it has too much risk, or if that trade looks suitable. It also provides a series of confirmations that could be used for adding to a position at different levels at the trade's discretion.
OPTIMAL CONDITIONS FOR CONSIDERING A SHORT = The PPO is orange/red + the STC is at the TOP + the Firefly is above the midline. The warning dots are being printed at the top. There is regular or hidden bearish divergence present.
OPTIMAL CONDITIONS FOR CONSIDERING A LONG = The PPO is light/dark green + the STC is at the BOTTOM + the Firefly is below the midline. The warning dots are being printed at the bottom. There is regular or hidden bullish divergence present.
Triggers for scaling/adding into your position = Keeping in mind that this oscillator on its own is not meant to be the sole reason for taking a trade, here are some triggers you will see for getting into position (preferably with the optimal conditions being met) The firefly flips from a green line into a red slide and vise versa. The firefly crosses the midline up or down. The STC begins going up/down and triggers a green or red dot while crossing one of the levels at 20 or 80. The warning dots being made begin to be printed lower/higher than the dot before last. The PPO shift from one color to the next in the favored direction of the trade you wish to make.
Signs for taking profit and protecting your trade = The Dots begin to print, the PPO changes colors at the top or bottom. the STC arrived are the top.
FILTER SITUATIONS TO AVOID TRADES = Wise to not take a trade if the PPO and the firefly do not agree. For example - if the PPO is showing green yet the firefly is still red may be an indication that it is getting a bit late for you to enter the trade. Same with opposing divergences and warning dots contradicting the trade you are looking at. The STC being already on the bottom or top may be a small indication that trade may already have been a little too ripe, but on its own is not always the case.
When selecting the PPO settings and moving average you are going to want it to be in favor of what you are trying to accomplish.IF you are one low time frames and trying to swing or scalp trade... chances are you want a reactive MA setting that iss responsive. Iwould recommend the HULL, ALMA, TEMA DEMA. For the Higher time frame the EMA or the T3 WDma can be wuite patient and helpful for a constant reminder of caution
Some notes - for the swing and scalp trading... in my experience the PPO moving average basis sees more responsive changes with the FRAMA , ALMA , HULL settings. for entering a trade, at least a couple of your triggers being present increases the success rate by a lot.
This chart illustrates the usefullness of having a Zero lag function for the firefly. The firefly should not be taken for signals or trades itself. However it is the most precise finder of divergences within the system. It is aways good to flip on and off zero lag just to take a quick look for divergences you might have mixed.
In this chart illustrates the general visual look and order of events to guide you along your way. Starts with the PPO turning green or red or orange which is potentially time to get out of your current trade. Then it switched colors when reversal begins and that is when you want to at the same time see the STC, the firefly, and lower caution dots coming in around the same area (highlighted in blue squares). Now near the end you see a red box. This is a filter aspect. The PPO is green, yet the others are saying down/short. This does not mean it must be a long, however it is great warning to maybe avoid getting to bearish for the downside in that time. You want the PPO and line up with the others and it should be visually apparent that they all want to go the same way.
Here is a list of some key elements (before changes this script made) of parts this oscillator includes. My original publication of my oscillation setup was blocked by the mods here.. this one however includes a large variety of items that have been altered from their original formats and a well-explained trading system to use it with.
// Firefly
Firefly Oscillator
// PPO
PPO PercentileRank Mkt Tops & Bottoms (@PuppyTherapy)
// Divergence
Divergence Indicator (any oscillator)
// Godmode
Godmode3.2+LSMA
// Schaff
Schaff Trend Cycle
// Frama
(FRAMA) Fractal Adaptive Moving Average

CT Reverse Pi Cycle Bitcoin Top IndicatorIntroducing the Reverse BTC Pi Market Cycle Top indicator
Much respect to Philip Swift the original creator of this idea and big thanks to Tradingview author Ninorigo for sharing the script which this indicator is based on.
Philip Swift has noted that:
Using the x2 multiple of the 350 day moving average along with the 111 day moving average provides an interesting market cycle indicator.
Over the past three market cycles, when the 350DMA x2 crosses below the 111DMA, Bitcoin price peaks in its market cycle, this has been accurate to within three days of Bitcoin price topping out.
Here I have modified an existing script by Tradingview author @Ninorigo which shows the moving averages and gives signals upon crossover by adding the following features:
A function which shows the price at which the 350DMA will Cross Below the 111DMA.
(This is calculated from the prior bar closing data and does not repaint)
An “anticipated cross” function which may give a 1 bar advanced warning of a cross.
(this is calculated from current bar values and may change and repaint)
The crossover levels are shown in an info label to the right of the current price.
When there is a BTC Pi Market Cycle Top anticipated cross on the next bar there will be an orange background signal.
When there is an actual BTC Pi Market Cycle Top cross there will be a red background signal
When there is an anticipated cross back there will be a blue background signal
When there is an actual cross back there will be a green background signal
This indicator will show the appropriate moving averages and crossover information from the daily timeframe regardless of the timeframe you are using.
This should be helpful in more accurately identifying the price level where the Pi Market Cycle moving averages will cross denoting a possible market cycle top.
It is interesting to note:
350 / 111 = 3.153
Which is the closest we can get to Pi when dividing 350 by another whole number.
This is a script to give another view and metric on an interesting experimental idea. This is not financial advice.
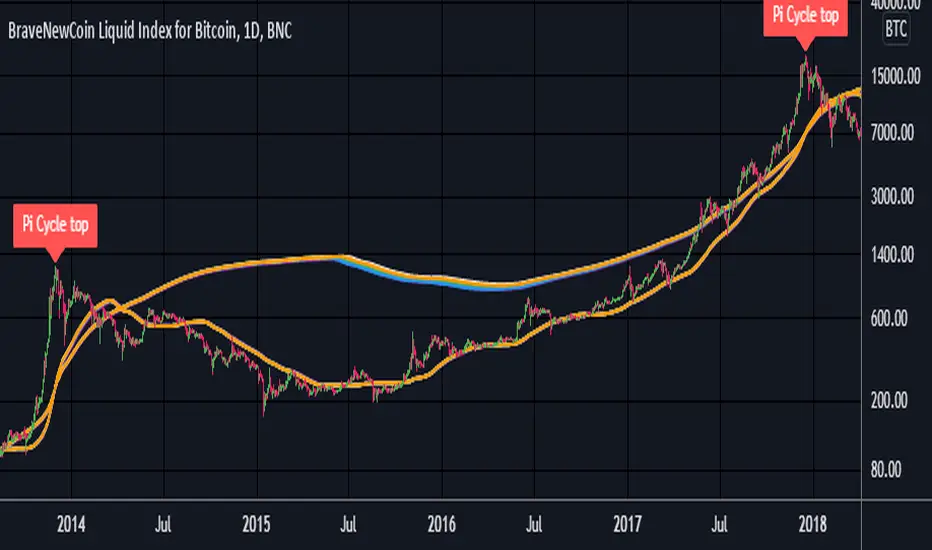
Pi-cycle top for Bitcoin bull-runUsage
Whenever the Pi-Cycle top conditions are met, the red circle appears at the bottom of the chart. Theoretically, this marks the top of the bull-run in Bitcoin within 3 days.
Credit and overview
Indicator Overview
The Pi Cycle Top Indicator has historically been effective in picking out the timing of market cycle highs to within 3 days.
It uses the 111 day moving average (111DMA) and a newly created multiple of the 350 day moving average, the 350DMA x 2.
Note: The multiple is of the price values of the 350DMA not the number of days.
For the past three market cycles, when the 111DMA moves up and crosses the 350DMA x 2 we see that it coincides with the price of Bitcoin peaking.
It is also interesting to note that 350 / 111 is 3.153, which is very close to Pi = 3.142. In fact, it is the closest we can get to Pi when dividing 350 by another whole number.
It once again demonstrates the cyclical nature of Bitcoin price action over long time frames. Though in this instance it does so with a high degree of accuracy over the past 7 years.
How It Can Be Used
Pi Cycle Top is useful to indicate when the market is very overheated. So overheated that the shorter term moving average, which is the 111 day moving average, has reached a x2 multiple of the 350 day moving average. Historically it has proved advantageous to sell Bitcoin at this time in Bitcoin’s price cycles.
Created By Philip Swift

[ProfitTrailer:Feeder] Market Trends Top X / BTCThis script will help you determine your MarketConditions Grouping for PtFeeder. You're able to input the specific top 10/20/xx pairs you want to use to fine-tune your groupings as well as specific BasePairs, there values will be automatically printed on the chart!
When measuring top coins trend, this is how many top coins to check by volume from the exchanges that you have configured PT Feeder for. For, the top 50 coins will be checked and their price change over the MeasureTimes property and the average change calculated. This average is used for the MaxTopCoinAverageChange property
If you like this kind of content, please 'like' and 'follow' and I'll continue publishing these kind of scripts!
Enjoy!

Institutional Top-Bottom by Herman Sangivera (Papua)Institutional Top-Bottom + Volume Profile by Herman Sangivera ( Papua )
📈 Component Description
Orange Line (POC - Point of Control): This represents the "Fair Value." Institutions view prices far above this line as "Expensive" (Premium) and prices below as "Cheap" (Discount).
Green/Red Boxes (Order Blocks): These are footprints left by big banks. A Green Box is a demand zone where institutional buying occurred, and a Red Box is a supply zone where institutional selling happened.
Institutional Labels: These appear when the RSI Divergence confirms that price momentum is fading, signaling a high-probability reversal (Top or Bottom).
🚀 Trading Strategy Guide
1. The High-Probability Buy Setup (Bottom)
Look for a "Confluence" of these three factors:
Location: Price is trading below the Orange POC line (Discount zone).
The Zone: Price enters or touches a Green Order Block.
The Signal: The "INSTITUTIONAL BUY" label appears.
Entry: Enter Buy at the close of the candle with the label.
Stop Loss: Place it just below the Green Order Block.
Take Profit: Target the Orange POC line or the nearest Red Order Block.
2. The High-Probability Sell Setup (Top)
Look for a "Confluence" of these three factors:
Location: Price is trading above the Orange POC line (Premium zone).
The Zone: Price enters or touches a Red Order Block.
The Signal: The "INSTITUTIONAL SELL" label appears.
Entry: Enter Sell at the close of the candle with the label.
Stop Loss: Place it just above the Red Order Block.
Take Profit: Target the Orange POC line or the nearest Green Order Block.
💡 Pro Tips for Accuracy
Timeframes: For the best results, use 15m for Scalping, and 1H or 4H for Day/Swing Trading.
Wait for the Candle Close: Labels are based on Pivot points. Always wait for the current candle to close to ensure the signal is locked and won't "repaint."
Avoid Flat Markets: This indicator works best when there is volatility. Avoid using it during "choppy" or sideways markets with very low volume.

Pi Cycle Top RatioPast cycles show a top prediction within a few days of the top when 111DMA crosses the 350DMA*2 (Pi Cycle top indicator).
Each cycle the 2 ratios have crossed less and for shorter periods of time. In 2021 the 2 averages hardly even crossed each other. It is likely the moving averages will not cross this cycle.
This can be seen more clearly if the two moving averages are divided by each other to give a visual ratio, when this is done you can clearly see the diminishing peaks. A trendline can then be applied across these peaks to account for the decaying signal. When the upper trend is hit this would be indicative of a potential peak. Interestingly, this ratio also represents bottoms consistently across each cycle, when the ratio has gone below 0.35 these matches with BTC lows.

VixTrixVixTrix - Because markets move in both directions.
VixTrix was born from a fundamental limitation in traditional volatility indicators: they only measure downside panic, completely missing the greed-driven extremes that form market tops.
How It Works:
Dual-Component Analysis:
vixBear = Panic selling intensity (distance from recent highs)
vixBull = FOMO buying intensity (distance from recent lows)
Oscillator = vixBear - vixBull = Net fear/greed imbalance
When the oscillator is positive, fear dominates (potential bottom forming). When negative, greed dominates (potential top forming).
Professional-Grade Filtering:
The magic happens with the symmetric RMS (Root Mean Square) bands. Unlike fixed percentage bands or standard deviation, RMS:
Creates mathematically symmetric positive/negative thresholds
Naturally adapts to changing volatility regimes
Provides statistical significance to extremes
VixTrix also adds selectable MA smoothing for the RMS calculation:
WMA (default): Balanced – middle-ground approach
VWMA: Volume-weighted – filters low-volume noise
EMA: Responsive – catches quick reversals
SMA: Stable – for swing trading
HMA: Fast and smooth – ideal for day trading
Signals require triple confirmation:
Statistical Extreme: Oscillator beyond RMS band
Price Action Confirmation: Correct candle color (bullish for bottoms, bearish for tops)
Momentum Continuation: Oscillator still moving toward extreme (exhaustion)
This multi-filter approach reduces premature entries and false signals while maintaining early positioning at potential reversal points.
Why This Matters for Your Trading:
In bull markets, traditional fear indicators sit near zero, giving no warning of impending tops.
VixTrix identifies when greed becomes excessive – when FOMO buying reaches statistical extremes that often precede corrections.
In range-bound markets, VixTrix excels at identifying overreactions in both directions, providing high-probability mean reversion opportunities.
During crashes, it captures the panic selling with the same precision as VixFix, but with better timing through its momentum confirmation.
VixTrix spots continuations through:
"No Signal" = Healthy Trend – Oscillator stays between RMS bands (no exhaustion)
Failed Extremes – Touches band but no triple confirmation = trend likely continues
Hidden Divergence – Price makes higher low while oscillator makes shallower low = uptrend continues
Controlled Emotions – Oscillator negative but not extreme in uptrends (greed present but not excessive)
Key Insight: When VixTrix doesn't give a signal during a pullback, institutions aren't panicking – they're just pausing before resuming the trend.
Green columns = Bullish exhaustion (potential bottoms)
Red columns = Bearish exhaustion (potential tops)
Golden RMS bands = Dynamic thresholds adapting to current volatility
Background highlights = Active signal conditions
The Result: A professional-grade oscillator that works in all market conditions – trending up, trending down, or ranging – by measuring the complete emotional spectrum driving price action.

LEAP Put Edge — Top Risk Oscillator (v6, divergences + HTF)Pinpoint market tops with precision — a composite oscillator built to spot exhaustion, bearish divergences, and high-probability LEAP Put entry zones.
The LEAP Put Edge — Top Risk Oscillator is designed specifically to help identify high-probability entry points for long-dated Put options (LEAPs) by highlighting exhaustion at market tops. Unlike generic overbought/oversold tools, it combines slower MACD and DMI/ADX for trend quality, RSI and Stochastic RSI for momentum extremes, volume spike and upper-wick exhaustion signals for capitulation risk, and optional bearish divergences in RSI and MACD to confirm weakening strength. The output is a smoothed composite score scaled from -100 to +100, where higher values indicate rising top-risk and bearish edge conditions. Clear thresholds, color-coded plots, and built-in alerts make it straightforward and practical for traders seeking simple, actionable signals to time Put entries with confidence.

Intelligent Top & Bottom Finder v9.8 Keyvankh📈 Intelligent Top & Bottom Finder v9.8 Keyvankh
A next-generation all-in-one trading system for precise tops, bottoms, and reversals across all timeframes.
---
🟢 Overview
This indicator is a powerful and intelligent solution for detecting market tops and bottoms, key reversals, and S/R zones with institutional-grade accuracy. Designed for traders seeking an edge in any market (crypto, forex, stocks), it combines advanced candlestick recognition, multi-indicator confirmation, smart support/resistance clustering, and strict signal filtering into one seamless tool.
---
🔎 How Does It Work?
1. Advanced Support & Resistance Clustering
Automatically detects and draws high-probability support and resistance zones using dynamic ATR-based pivot clustering.
Highlights breakouts and retest (flip) zones in real-time, adapting to changing market structure.
2. Full Candlestick Pattern Recognition
Scans for 15+ classic and advanced patterns: Engulfing, Pin Bar, Doji, Three Bar, Marubozu, Hammer, Shooting Star, Three White Soldiers, Three Black Crows, Tweezer, Morning/Evening Star, Kicker, Belt Hold, and more.
Scores each pattern’s strength based on location (S/R zone, retest, breakout), volume context, and confirmation signals.
3. Multi-Indicator Confirmation Engine**
Integrates and scores confirmation from up to five additional sources:
RSI Games 1.2** (smoothed LTF momentum shifts)
MACD Divergence** (bullish/bearish momentum reversal)
QQE+ v7 Advanced** (dynamic volatility filter)
OBV Trend Filter** (volume-backed trend validation)
Volume Game** (net volume spike and reversal detection)
Each module can be enabled or disabled to fit your personal trading style.
4. Institutional S/R and Retest Logic
Real-time recognition of major trendline breaks, retest zones, and price flips.
Automatic labeling and coloring of S/R zones, retest boxes, and confirmation candles.
5. Smart Buy & Sell Signal Generation**
Combines all scoring modules with strict logical filters and “failsafe override” logic (guaranteeing signal on confirmed hammers, engulfings, etc. even if other filters disagree).
Plots clear “BUY” and “SELL” labels only when a strong, multi-factor signal appears—minimizing noise and maximizing reliability.
Built-in fallback logic (optional) for edge cases.
6. Alerts & Automation Ready
TradingView alerts for all BUY, SELL, or ANY signal conditions—perfect for auto-trading or notification setups.
---
*⚙️ Customizable Inputs
Enable/Disable any module (RSI Games, MACD, OBV, QQE+, Candlestick Scanner, Volume Game)
Minimum Confirmations** required for a signal (1–10)
Pivot/Zone Sensitivity:** ATR multiplier, pivots per cluster, retest bar duration
LTF (Lower Timeframe) Confirmation:** Fully configurable
---
📊 How To Use**
Apply on any timeframe and symbol**—crypto, stocks, forex, indices.
Use as a **standalone reversal/entry tool** or to confirm your own technical setups.
Combine with your favorite momentum, trend, or volume indicators for advanced confluence.
Set up **TradingView alerts** for auto-trading, Telegram/email notifications, or trade journaling.
---
🟢 What Makes This Unique?
All-in-one multi-indicator fusion:** No more juggling a dozen scripts.
Institutional logic:** Goes beyond basic signals with true S/R, retest, and volume logic.
Full transparency:** Source code is clear and commented (if published open-source).
Fast and reliable:** Optimized for minimal lag and maximum accuracy.
---
⚠️ Disclaimer**
This indicator is a tool to assist with trade timing and risk management. **No system is 100% accurate.** Always use in conjunction with your own analysis and risk management practices.
---
📚 Credits & License**
Created by Keyvan Khodakhah.
You may use, modify, or share this script under the (mozilla.org).
Please credit the original author if you fork or reuse in public.
---
Questions, feedback, or collaboration? Contact: Keyvankh
---
Precision in technical analysis comes from layers of confluence and discipline. This tool brings that precision to your chart.

Market Sentiment Index US Top 40 [Pt]▮Overview
Market Sentiment Index US Top 40 [Pt} shows how the largest US stocks behave together. You pick one simple measure—High Low breakouts, Above Below moving average, or RSI overbought/oversold—and see how many of your chosen top 10/20/30/40 NYSE or NASDAQ names are bullish, neutral, or bearish.
This tool gives you a quick view of broad-market strength or weakness so you can time trades, confirm trends, and spot hidden shifts in market sentiment.
▮Key Features
► Three Simple Modes
High Low Index: counts stocks making new highs or lows over your lookback period
Above Below MA: flags stocks trading above or below their moving average
RSI Sentiment: marks overbought or oversold stocks and plots a small histogram
► Universe Selection
Top 10, 20, 30, or 40 symbols from NYSE or NASDAQ
Option to weight by market cap or treat all symbols equally
► Timeframe Choice
Use your chart’s timeframe or any intraday, daily, weekly, or monthly resolution
► Histogram Smoothing
Two optional moving averages on the sentiment bars
Markers show when the faster average crosses above or below the slower one
► Ticker Table
Optional on-chart table showing each ticker’s state in color
Grid or single-row layout with adjustable text size and color settings
▮Inputs
► Mode and Lookback
Pick High Low, Above Below MA, or RSI Sentiment
Set lookback length (for example 10 bars)
If using Above Below MA, choose the moving average type (EMA, SMA, etc.)
► Universe Setup
Market: NYSE or NASDAQ
Number of symbols: 10, 20, 30, or 40
Weights: on or off
Timeframe: blank to match chart or pick any other
► Moving Averages on Histogram
Enable fast and slow averages
Set their lengths and types
Choose colors for averages and markers
► Table Options
Show or hide the symbol table
Select text size: tiny, small, or normal
Choose layout: grid or one-row
Pick colors for bullish, neutral, and bearish cells
Show or hide exchange prefixes
▮How to Read It
► Sentiment Bars
Green means bullish
Red means bearish
Near zero means neutral
► Zero Line
Separates bullish from bearish readings
► High Low Line (High Low mode only)
Smooth ratio of highs versus lows over your lookback
► MA Crosses
Fast MA above slow MA hints rising breadth
Fast MA below slow MA hints falling breadth
► Ticker Table
Each cell colored green, gray, or red for bull, neutral, or bear
▮Use Cases
► Confirm Market Trends
Early warning when price makes highs but breadth is weak
Catch rallies when breadth turns strong while price is flat
► Spot Sector Rotation
Switch between NYSE and NASDAQ to see which group leads
Watch tech versus industrial breadth to track money flow
► Filter Trade Signals
Enter longs only when breadth is bullish
Consider shorts when breadth turns negative
► Combine with Other Indicators
Use RSI Sentiment with trend tools to spot overextended moves
Add volume indicators in High Low mode for breakout confirmation
► Timeframe Analysis
Daily for big-picture bias
Intraday (15-min) for precise entries and exits

Altseason Index (Top 10)### Altseason Index (Top 10)
#### Overview
The "Altseason Index (Top 10)" indicator identifies whether the market is in an altseason (altcoins outperforming Bitcoin) or a Bitcoin season. It analyzes the performance of 9 top altcoins (ETH, BNB, ADA, XRP, SOL, DOT, AVAX, SHIB, LINK) against Bitcoin over 90 days, inspired by the Blockchain Center Altcoin Season Index.
#### How It Works
- Calculates the 90-day price change for BTC and 9 altcoins.
- Counts how many altcoins outperform BTC.
- Index = (number of outperforming altcoins / 9) * 100.
- >75%: Altseason (green zone).
- <25%: Bitcoin season (red zone).
- 25–75%: Neutral.
#### Visualization
- Blue line: Index value (0–100).
- Green line at 75: Altseason threshold.
- Red line at 25: Bitcoin season threshold.
- Green/red background fill for altseason/BTC season zones.
#### Usage
Add to your chart and interpret:
- Above 75: Consider altcoin investments.
- Below 25: Focus on Bitcoin.
Ensure tickers match your exchange (e.g., "BTCUSD" or "BINANCE:BTCUSDT").
#### Notes
- Limited to 9 altcoins due to TradingView's request.security() limit.
- Best on daily charts but adaptable to other timeframes.

[ChasinAlts]Top-Wicked Good S/R LinesHello Tradeurs, as per usual, I hope everyone is having a FAN-FRIGGIN-TASTIC day. With the soon incoming bull market approaching fast(Nov 7, 2022), there are a few ideas that I've really been trying to push out to help nail a few coins as they are near their bottom peak of this closing Bear Market. This one may seem very similar to the last one I posted but I think this one takes the cake...esp when you see the next script from my 'Market Overview' series that I will be publishing shortly after this one as it is utilizing this new script for a market scanner that will be SUPER legit and profitable. Though it is alway nice to be noticed, I'm glad that I'm relatively unpopular so the few people that are now following me can have some time to make some money with some of these scripts I'm trying to pump out for the benefit of the community. I will rarely give my full analysis of how I take in and utilize these scripts but I can tell you, QUITE A FEW of them are money in the bank. Esp these last few I've done/am doing and even more-so the ones that are soon to come (I'm speaking of about the next 3-4 that I will be attempting to pump out in this next VERY IMPORTANT week.). One more thing I'll add before going to the script is a little alpha(Im pretty certain this is the way it is going but NOTHING is EVERY 100% in life). What I believe should be realized is the bottoming out of MANY of the crypto coins at the VERY bottom of a LONG TERM Cup and Handle (so it seems but shat can still change in the blink of an eye). Thus there are quite a few coins that I believe have already bottomed and wont be returning to said bottom for a few years or so but there are also quite a few still at the brink of the bottomest part before the real market breakout occurs. My goal with these scripts coming out this week to help you all find those coins that have yet to hit their very bottom (thus the ATH/ATL script recently published). Going back in history looking for the lowest points of long term Cup & Handles I will point out 2 key things. Near the center/bottomest part of these historical CnH you will see either Double Bottoms OR a Huge dump and then its V-shaped recovery. After these print the point of no return has occurred where only a few coins will be going lower than these Double Bottoms/V-Shaped recoveries. So the time is at hand. Now that many coins are seemingly pumping after this long consolidation, I believe we need to keep a keen eye out for THE FINAL RUG PULL (as soon as enough degenerates are leveraging Long their entire savings.). What Im saying is be ready for this final rug pull to finally be seeing these Double Bottoms/V-Shaped recoveries VERY soon. DO NOT waste all your capital yet and MAKE SURE to use stop losses or else rather than stop losses you will be burdened with MUCH WORSE losses. Im currently not even in the market bc I am waiting on said rug pull. Ok for the Script now.
This script is similar to the last one but with the previous one, one general set of settings can produce VASTLY different results (might have 2 S/R lines on one coin and 80 on another). I wanted to fix that with this script, turn it into a "Market Overview" Scanner and create alerts for the MO Scanner to be able to get alerted any time a coin is passing its largest wick S/R levels bc DULY NOTE...it is VERY rare that a coin will blow past it if it hasn't approached it recently. That means that a small retrace of 3-5%(or more) is EASY to acquire (with leverage that can really add up with how many coins are in the Kucoin Margin Coin list that I have in my scanners). Now, once price does shoot through a level you best be sure to be looking down the line for a retest of the S/R level it blew past before as they are MANY times the retest level and price will be coming back to it before continuing
in the direction it was going. Depending on the TF your using this could be a few hours to a few days to a few weeks...you get it. With this script you can choose to draw S/R lines 2 ways: 1) by having it plot S/R lines on the end of the largest 2(3,4,5..however many you choose) wicks that the chart has access to. For the scanner ill just be putting the largest 2-3 wicks and set alerts when coming up to them/crossing them & 2) having it draw S/R lines on the ends of the largest X% of wicks. it will be erasing the lines and drawing new ones on each new candle occurrence so the same general settings will no longer be producing VASTLY diff amounts of S/R lines and will be way more consistent amongst the coins for better utilization with the scanner (when I publish it). There is also a Wick Max Cutoff % so for those coins that had it's first few hours printing 100% sized wicks...you can choose to ignore them so they are not taking up one of your top spots for the S/R lines. There is similarly a Wick % min Size that can be selected so if you’re using the top % setting, it will help decrease those coins that can be still plotting 30 lines even though the top 3% of the largest wicks are set in the settings. Hope Im being clear but it's easy enough. I believe in you and your capabilities of comprehending it all and getting it all figured out. So this script is for a visualization for the scanner that I will be uploading soon-after. It's always nice to get a few comments if my ideas/scripts have been helpful to you and please don't hold back if you have something to tell me that I screwed up on (I am still rather new to this coding thing but I like to think I at least have some fresh ideas that aren’t out there in the public library). Talk to you soon and may the force be with your trades. Peace and love people...peace and love. -ChasinAlts out.

V Bottom & V Top Pattern [Misu]█ This indicator shows V bottom & V top patterns as well as potential V bottom & V top.
These V bottom & V top are chart powerful reversal patterns.
They appear in all markets and time-frames, but due to the nature of the aggressive moves that take place when a market reverses direction, it can be difficult to identify this pattern in real-time.
To address this problem, I added potential V pattern as well as the confirmed one.
█ Usages:
You can use V top & V bottoms for reversal zones.
You can use it for scalping strategies, as a main buy & sell signal.
Potential V patterns can be used to anticipate the market, in addition to volatility or momentum indicators, for example.
█ How it works?
This indicator uses pivot points to determine potential V patterns and confirm them.
Paramaters are available to filter breakouts of varying strengths.
Patterns also have a "max number bars" to be validated.
█ Why a Strategy type indicator?
Due to the many different parameters, this indicator is a strategy type.
This way you can overview the best settings depending on your pair & timeframe.
Parameters are available to filter.
█ Parameters:
Deviation: Parameter used to calculate parameters.
Depth: Parameter used to calculate parameters.
Confirmation Type: Type of signal used to confirme the pattern.
> Mid Pivot: pattern will confirm on mid pivot breakout.
> Opposit Pivot: pattern will confirm on opposit pivot breakout.
> No confirmation: no confirmation.
Lenght Avg Body: Lenght used to calculate the average body size.
First Breakout Factor: This factor multiplied by the "body avg" filters out the non-significant breakout of potential V pattern.
Confirmation Breakout Factor: This factor multiplied by the "body avg" filters out the non-significant breakout for the confirmation.
Max Bars Confirmation: The maximum number of bars needed to validate the pattern.
