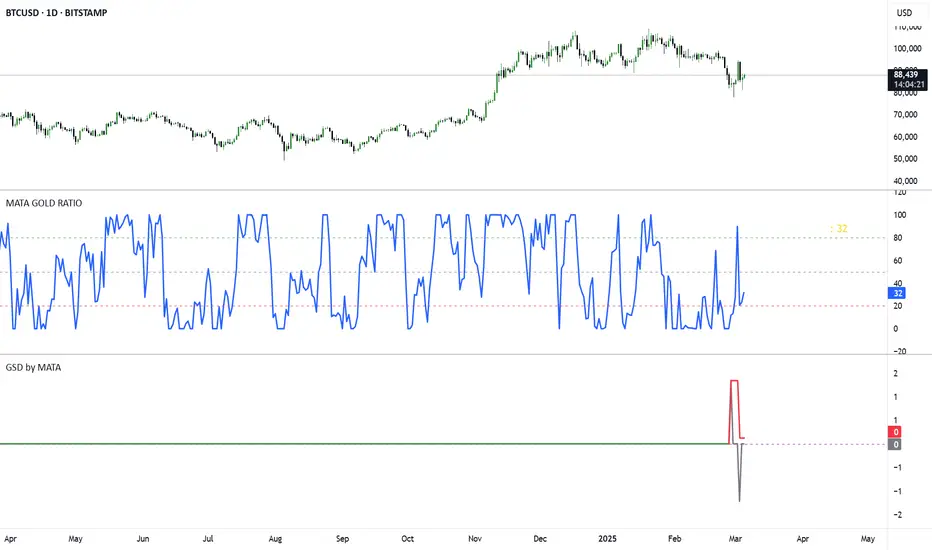
GSD by MATAGSD by MATA - Gold-Sensitive Divergence Indicator
Overview:
The GSD by MATA indicator is designed to analyze the inverse correlation between an instrument’s price movement and gold (XAU/USD) over a selected time period. It helps traders identify whether the instrument tends to move in the opposite direction of gold, providing insights into potential hedging opportunities or market sentiment shifts.
How It Works:
User-Defined Time Period:
The user selects a time frame for comparison (1 Day, 1 Week, 1 Month, 3 Months, 6 Months, or 12 Months).
The indicator calculates the percentage change in both the instrument’s price and gold price over this period.
Inverse Movement Calculation:
If gold increases and the instrument decreases, the indicator registers a negative inverse change.
If gold decreases and the instrument increases, the indicator registers a positive inverse change.
If both move in the same direction, no inverse movement is recorded.
Cumulative Tracking:
The Reverse Change line shows the instant inverse movement.
The Total Change line accumulates the inverse movements over time, helping traders spot trends and long-term divergences.
How to Use:
A rising Total Change line (green) suggests that the instrument frequently moves in the opposite direction of gold, indicating a possible hedge effect.
A falling Total Change line (red) means the instrument has been moving in sync with gold rather than diverging.
The 0 reference line helps identify whether the cumulative effect is positive or negative over time.
Cari dalam skrip untuk "track"
Trading Sessions Highs/Lows | InvrsROBINHOODTrading Sessions Highs/Lows | InvrsROBINHOOD
🚀 A powerful indicator for tracking key trading sessions and the highs and lows of each session!
📌 Description
The Trading Sessions Highs/Lows indicator visually marks the most critical trading sessions—Asia, London, and New York—using small colored dots at the bottom of the candle. It also tracks and plots the highs and lows of each session, along with the Daily Open and Weekly Open levels.
This tool is designed to help traders identify session-based liquidity zones, price reactions, and potential trade setups with minimal chart clutter.
Key Features:
✅ Session markers (Asia, London, NY AM, NY Lunch, NY PM) plotted as small dots
✅ Plots session highs and lows for market structure insights
✅ Daily Open line for intraday reference
✅ Weekly Open line for higher timeframe bias
✅ Alerts for session high/low breaks to capture momentum shifts
✅ User-defined UTC offset for global traders
✅ Customizable session colors for personal preference
📖 How to Use the Indicator
1️⃣ Understanding the Sessions
Asia Session (Yellow Dot) → Marks liquidity buildup & pre-London moves
London Session (Blue Dot) → Strong volatility, breakout opportunities
New York AM Session (Green Dot) → Major trends & institutional participation
New York Lunch (Red Dot) → Low volume, ranging market
New York PM Session (Dark Green Dot) → End-of-day movements & reversals
2️⃣ Session Highs & Lows for Market Structure
Session Highs can act as resistance or breakout points.
Session Lows can act as support or stop-hunt zones.
Break of a session high/low with volume may indicate continuation or reversal.
3️⃣ Using the Daily & Weekly Open
The Daily Open (Black Line) helps gauge the intraday trend.
Above Daily Open → Bearish Bias
Below Daily Open → Bullish Bias
The Weekly Open (Red Line) sets the higher timeframe directional bias.
4️⃣ Alerts for Breakouts
The indicator will trigger alerts when price breaks session highs or lows.
Useful for setting stop-losses, breakout trades, and risk management.
💡 Why This Indicator is Important for Beginners
1️⃣ Avoids Overtrading:
Many beginners trade in low-volume periods (NY Lunch, Asia session) and get stuck in choppy price action.
This indicator highlights when volatility is high so traders focus on better opportunities.
2️⃣ Session-Based Liquidity Traps:
Market makers often run stops at session highs/lows before reversing.
Watching session breaks prevents traders from falling into liquidity grabs.
3️⃣ Reduces Emotional Trading:
If price is above the Daily Open, a beginner shouldn’t look for shorts.
If price is below a key session low, it may signal a fake breakout.
4️⃣ Aligns with Institutional Trading:
Smart money traders use session highs/lows to set stop hunts & reversals.
Beginners can use this indicator to spot these zones before entering trades.
🛡️ How to Mitigate Risk with This Indicator
✅ Wait for Confirmations – Don’t trade blindly at session highs/lows. Look for wicks, rejections, or break/retests.
✅ Use Stop-Loss Above/Below Session Levels – If you’re going long, set SL below a session low. If short, set SL above a session high.
✅ Watch Volume & News Events – Breakouts without strong volume or news may be fake moves.
✅ Combine with Other Strategies – Use price action, trendlines, or EMAs with this indicator for higher probability trades.
✅ Use the Weekly Open for Trend Bias – If price stays below the Weekly Open, avoid bullish setups unless key support holds.
🎯 Who is This Indicator For?
📌 Beginners who need clear session-based trading levels.
📌 Day traders & scalpers looking to refine their intraday setups.
📌 Smart money traders using liquidity concepts.
📌 Swing traders tracking higher timeframe momentum shifts.
🚀 Final Thoughts
This indicator is an essential tool for traders who want to understand market structure, liquidity, and volatility cycles. Whether you’re trading forex, stocks, or crypto, it helps you stay on the right side of the market and avoid unnecessary risks.
🔹 Set it up, customize your colors, define your UTC offset, and start trading smarter today! 🏆📈

Cluster Reversal Zones📌 Cluster Reversal Zones – Smart Market Turning Point Detector
📌 Category : Public (Restricted/Closed-Source) Indicator
📌 Designed for : Traders looking for high-accuracy reversal zones based on price clustering & liquidity shifts.
🔍 Overview
The Cluster Reversal Zones Indicator is an advanced market reversal detection tool that helps traders identify key turning points using a combination of price clustering, order flow analysis, and liquidity tracking. Instead of relying on static support and resistance levels, this tool dynamically adjusts to live market conditions, ensuring traders get the most accurate reversal signals possible.
📊 Core Features:
✅ Real-Time Reversal Zone Mapping – Detects high-probability market turning points using price clustering & order flow imbalance.
✅ Liquidity-Based Support/Resistance Detection – Identifies strong rejection zones based on real-time liquidity shifts.
✅ Order Flow Sensitivity for Smart Filtering – Filters out weak reversals by detecting real market participation behind price movements.
✅ Momentum Divergence for Confirmation – Aligns reversal zones with momentum divergences to increase accuracy.
✅ Adaptive Risk Management System – Adjusts risk parameters dynamically based on volatility and trend state.
🔒 Justification for Mashup
The Cluster Reversal Zones Indicator contains custom-built methodologies that extend beyond traditional support/resistance indicators:
✔ Smart Price Clustering Algorithm: Instead of plotting fixed support/resistance lines, this system analyzes historical price clustering to detect active reversal areas.
✔ Order Flow Delta & Liquidity Shift Sensitivity: The tool tracks real-time order flow data, identifying price zones with the highest accumulation or distribution levels.
✔ Momentum-Based Reversal Validation: Unlike traditional indicators, this tool requires a momentum shift confirmation before validating a potential reversal.
✔ Adaptive Reversal Filtering Mechanism: Uses a combination of historical confluence detection + live market validation to improve accuracy.
🛠️ How to Use:
• Works well for reversal traders, scalpers, and swing traders seeking precise turning points.
• Best combined with VWAP, Market Profile, and Delta Volume indicators for confirmation.
• Suitable for Forex, Indices, Commodities, Crypto, and Stock markets.
🚨 Important Note:
For educational & analytical purposes only.

True Liquidity BlocksSo basically I've been deep diving into liquidity trading concepts similar to ICT (Inner Circle Trader) and developed an indicator that breaks down market movement through a volume-centric lens.
Key Concept:
Markets move not just by price, but by resolving trapped positions
Volume segments, not time intervals, show true market dynamics
VWAP (Volume Weighted Average Price) becomes a key structural reference
What Makes This Different:
Tracks volume segments instead of fixed time frames
Identifies "trapped" trader positions
Measures liquidity level efficiency
Color-codes bars based on nearest liquidity zone
Indicator Features:
Cyan/Red liquidity levels showing buy/sell pressure
Efficiency tracking for each level
Dynamic volume-based segmentation
Bar coloring to show nearest liquidity zone
Theoretical Inspiration: Viewed markets as energy systems where:
Positions create potential energy
Price movement resolves this energy
Trends form through systematic position liquidation
VWAP Recalculation in Each Segment:
Segment Start:
VWAP resets when volume threshold User Inputtable (600,000) is reached
Uses the last 4 price values (High, Low, Close, Close) for calculation
Weighted by volume traded during that segment
Calculation Method:
pineCopy = ta.vwap(hlcc4, na(segment_start) ? true : na, 1)
hlcc4: Combines high, low, close prices
na(segment_start): Ensures reset at new segment
Weighted by volume, not equal time intervals
Key Points:
Dynamic recalculation each segment
Reflects most recent trading activity
Provides real-time fair price reference
Tracks positioning
Essentially, VWAP resets and recalculates with each new volume segment, creating a rolling, volume-weighted average price that maps trader positioning.
BSL (Buy Side Liquidity) and SSL (Sell Side Liquidity) Explained:
When a volume segment closes relative to VWAP, it creates natural positioning traps:
BSL (Cyan) - Created when price closes BELOW THAT SEGMENT'S VWAP:
Bulls are positioned BELOW VWAP (trapped)
Shorts are positioned ABOVE VWAP (In Profit)
SSL (Red) - Created when price closes ABOVE THAT SEGMENT"S VWAP:
Bulls are positioned ABOVE VWAP (trapped)
Shorts are positioned BELOW VWAP (trapped)
Core Mechanism:
VWAP acts as a reference point for trader positioning
Trapped positions create inherent market tension
Levels expand to show accumulating pressure
Color-coded for quick identification of potential move direction
The goal: Visualize where traders are likely "stuck" and must eventually resolve their positions or liquidate other's, driving market movement.
It was just a fun experiment but If ya'll have any thoughts on it or what I could do to improve it, I would appreciate it.
Just a little note, It's optimized for futures, but if u uncheck the "Rest at Futures Open ?" setting, it allow full reign of any asset with volume data.

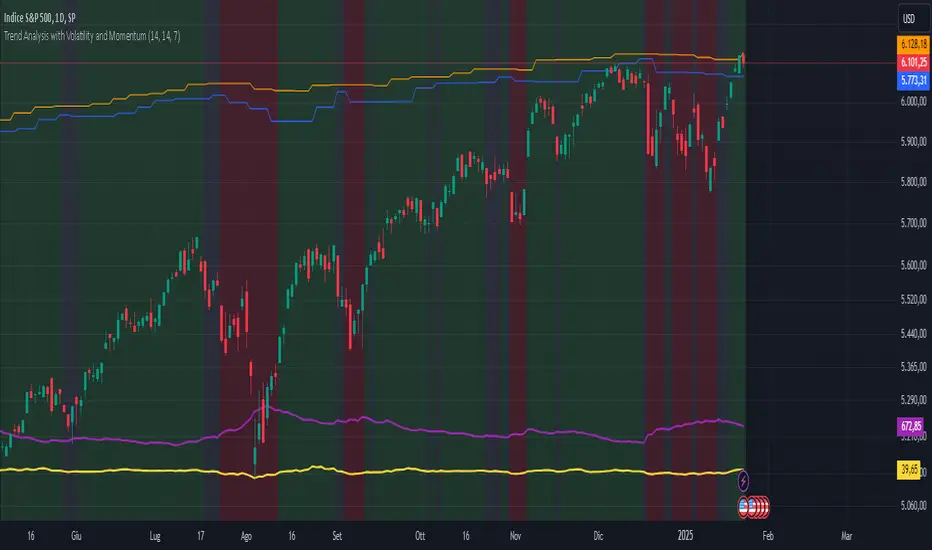
Trend Analysis with Volatility and MomentumVolatility and Momentum Trend Analyzer
The Volatility and Momentum Trend Analyzer is a multi-faceted TradingView indicator designed to provide a comprehensive analysis of market trends, volatility, and momentum. It incorporates key features to identify trend direction (uptrend, downtrend, or sideways), visualize weekly support and resistance levels, and offer a detailed assessment of market strength and activity. Below is a breakdown of its functionality:
1. Input Parameters
The indicator provides customizable settings for precision and adaptability:
Volatility Lookback Period: Configurable period (default: 14) for calculating Average True Range (ATR), which measures market volatility.
Momentum Lookback Period: Configurable period (default: 14) for calculating the Rate of Change (ROC), which measures the speed and strength of price movements.
Support/Resistance Lookback Period: Configurable period (default: 7 weeks) to determine critical support and resistance levels based on weekly high and low prices.
2. Volatility Analysis (ATR)
The Average True Range (ATR) is calculated to quantify the market's volatility:
What It Does: ATR measures the average range of price movement over the specified lookback period.
Visualization: Plotted as a purple line in a separate panel below the price chart, with values amplified (multiplied by 10) for better visibility.
3. Momentum Analysis (ROC)
The Rate of Change (ROC) evaluates the momentum of price movements:
What It Does: ROC calculates the percentage change in closing prices over the specified lookback period, indicating the strength and direction of market moves.
Visualization: Plotted as a yellow line in a separate panel below the price chart, with values amplified (multiplied by 10) for better visibility.
4. Trend Detection
The indicator identifies the current market trend based on momentum and the position of the price relative to its moving average:
Uptrend: Occurs when momentum is positive, and the closing price is above the simple moving average (SMA) of the specified lookback period.
Downtrend: Occurs when momentum is negative, and the closing price is below the SMA.
Sideways Trend: Occurs when neither of the above conditions is met.
Visualization: The background of the price chart changes color to reflect the detected trend:
Green: Uptrend.
Red: Downtrend.
Gray: Sideways trend.
5. Weekly Support and Resistance
Critical levels are calculated based on weekly high and low prices:
Support: The lowest price observed over the last specified number of weeks.
Resistance: The highest price observed over the last specified number of weeks.
Visualization:
Blue Line: Indicates the support level.
Orange Line: Indicates the resistance level.
Both lines are displayed on the main price chart, dynamically updating as new data becomes available.
6. Alerts
The indicator provides configurable alerts for trend changes, helping traders stay informed without constant monitoring:
Uptrend Alert: Notifies when the market enters an uptrend.
Downtrend Alert: Notifies when the market enters a downtrend.
Sideways Alert: Notifies when the market moves sideways.
7. Key Use Cases
Trend Following: Identify and follow the dominant trend to capitalize on sustained price movements.
Volatility Assessment: Measure market activity to determine potential breakouts or quiet consolidation phases.
Support and Resistance: Highlight key levels where price is likely to react, assisting in decision-making for entries, exits, or stop-loss placement.
Momentum Tracking: Gauge the strength and speed of price moves to validate trends or anticipate reversals.
8. Visualization Summary
Main Chart:
Background color-coded for trend direction (green, red, gray).
Blue and orange lines for weekly support and resistance.
Lower Panels:
Purple line for volatility (ATR).
Yellow line for momentum (ROC).
Trend Reversal Probability [Algoalpha]Introducing Trend Reversal Probability by AlgoAlpha – a powerful indicator that estimates the likelihood of trend reversals based on an advanced custom oscillator and duration-based statistics. Designed for traders who want to stay ahead of potential market shifts, this indicator provides actionable insights into trend momentum and reversal probabilities.
Key Features :
🔧 Custom Oscillator Calculation: Combines a dual SMA strategy with a proprietary RSI-like calculation to detect market direction and strength.
📊 Probability Levels & Visualization: Plots average signal durations and their statistical deviations (±1, ±2, ±3 SD) on the chart for clear visual guidance.
🎨 Dynamic Color Customization: Choose your preferred colors for upward and downward trends, ensuring a personalized chart view.
📈 Signal Duration Metrics: Tracks and displays signal durations with columns representing key percentages (80%, 60%, 40%, and 20%).
🔔 Alerts for High Probability Events: Set alerts for significant reversal probabilities (above 84% and 98% or below 14%) to capture key trading moments.
How to Use :
Add the Indicator: Add Trend Reversal Probability to your favorites by clicking the star icon.
Market Analysis: Use the plotted probability levels (average duration and ±SD bands) to identify overextended trends and potential reversals. Use the color of the duration counter to identify the current trend.
Leverage Alerts: Enable alerts to stay informed of high or extreme reversal probabilities without constant chart monitoring.
How It Works :
The indicator begins by calculating a custom oscillator using short and long simple moving averages (SMA) of the midpoint price. A proprietary RSI-like formula then transforms these values to estimate trend direction and momentum. The duration between trend reversals is tracked and averaged, with standard deviations plotted to provide probabilistic guidance on trend longevity. Additionally, the indicator incorporates a cumulative probability function to estimate the likelihood of a trend reversal, displaying the result in a data table for easy reference. When probability levels cross key thresholds, alerts are triggered, helping traders take timely action.

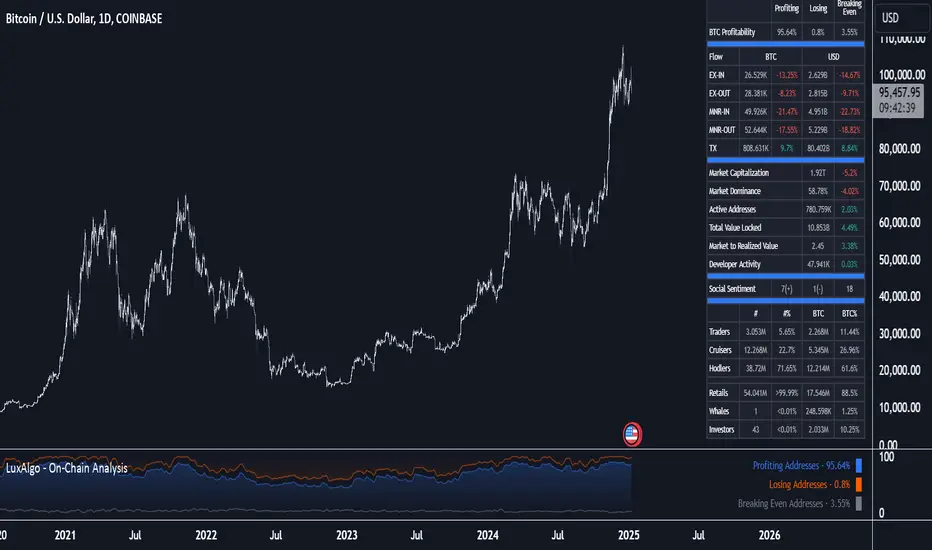
On-Chain Analysis [LuxAlgo]The On-Chain Analysis tool offers a comprehensive overview of essential on-chain metrics, enabling traders and investors to grasp the underlying activity and sentiment within the cryptocurrency market. By integrating metrics like wallet profitability, exchange flows, on-chain volume, social sentiment, and more into your charts, users can gain valuable insights into cryptocurrency network behavior, spot emerging trends, and better manage risk in the cryptocurrency market.
🔶 USAGE
🔹 On-Chain Analysis
When analyzing cryptocurrencies, several fundamental metrics are crucial for assessing the value and potential of a digital asset. This indicator is designed to help traders and analysts evaluate the markets by utilizing various data gathered directly from the blockchain. The gathered on-chain data includes wallet profitability, exchange flows, miner flows, on-chain volume, large buyers/sellers, market capitalization, market dominance, active addresses, total value locked (TVL), market value to realized value (MVRV), developer activity, social sentiment, holder behavior, and balance types.
Use wallet profitability and social sentiment metrics to gauge the overall mood of the market, helping to anticipate potential buying or selling pressure.
On-chain volume and active addresses provide insights into how actively a cryptocurrency is being used, indicating network health and adoption levels.
By tracking exchange flows and holder balance types, you can identify significant moves by whales or institutions, which may signal upcoming price shifts.
Market capitalization and miner flows give you an understanding of the supply side of the market, aiding in evaluating whether an asset is overvalued or undervalued.
The distribution of holdings among retail investors, whales, and institutional groups can greatly influence market dynamics. A large concentration of holdings by whales may indicate the potential for significant price swings, given their capacity to execute substantial trades. A higher proportion of institutional investors often suggests confidence in the asset's long-term potential, as these entities typically conduct thorough research before investing. While retail participation indicates broader adoption, it also introduces higher volatility, as these investors tend to be more reactive to market fluctuations.
Understanding the balance and behavior of short-term traders, mid-term cruisers, and long-term hodlers helps traders and analysts predict market trends and assess the underlying confidence in a particular cryptocurrency.
🔶 DETAILS
This script includes some of the most significant and insightful metrics in the crypto space, designed to evaluate and enhance trading decisions by assessing the value and growth potential of cryptocurrencies. The introduced metrics are:
🔹 Wallet Profitability
Definition: Represents the percentage distribution of addresses by profitability at the current price.
Importance: Indicates potential selling pressure or reduced selling pressure based on whether addresses are in profit or loss.
🔹 Exchange Flow
Definition: The total amount of a cryptocurrency moving in and out of exchanges.
Importance: Large inflows to exchanges can indicate potential selling pressure, while large outflows might suggest accumulation or long-term holding.
🔹 Miner Flow
Definition: Tracks the inflow and outflow of funds by miners.
Importance: High inflows could indicate selling pressure, whereas low inflows or outflows might reflect miner confidence.
🔹 On-Chain Volume
Definition: The total value of transactions conducted on a blockchain within a specific period.
Importance: On-chain volume reflects actual usage of the network, indicating how actively a cryptocurrency is being utilized for transactions.
🔹 Large Buyers/Sellers
Definition: Tracks the number of large buyers (bulls) and sellers (bears) based on transaction volume.
Importance: Comparing the number of large buyers (bulls) to large sellers (bears) helps gauge market trends and sentiment.
🔹 Market Capitalization
Definition: The total value of a cryptocurrency's circulating supply, calculated by multiplying the current price by the total supply.
Importance: Market cap is a key indicator of a cryptocurrency’s size and market dominance. It helps compare the relative size of different cryptocurrencies.
🔹 Market Dominance
Definition: Market dominance represents a cryptocurrency’s share of the total market capitalization of all cryptocurrencies. It is calculated by dividing the market cap of the cryptocurrency by the total market cap of the cryptocurrency market.
Importance: Market dominance is a crucial indicator of a cryptocurrency's influence and relative position in the market. It helps assess the strength of a cryptocurrency compared to others and provides insights into its market presence and potential influence.
Special Consideration: Since BTC and ETH dominance is relatively high compared to other cryptocurrencies, specific adjustments are made during the presentation of values and charts. When analyzing BTC, the total market capitalization is used. For ETH analysis, BTC is excluded from the total market cap. For any other cryptocurrency besides BTC and ETH, both BTC and ETH are excluded from the total market cap to provide a more accurate view.
🔹 Active Addresses
Definition: The number of unique addresses involved in transactions within a specific period.
Importance: A higher number of active addresses suggests greater network activity and user adoption, which can be a sign of a healthy ecosystem.
🔹 Total Value Locked (TVL)
Definition: The total value of assets locked in a decentralized finance (DeFi) protocol.
Importance: TVL is a key metric for DeFi platforms, indicating the level of trust and the amount of liquidity in a protocol.
🔹 Market Value to Realized Value (MVRV)
Definition: A ratio comparing the market cap to realized cap.
Importance: A high ratio may indicate overvaluation (potential selling), while a low ratio could signal undervaluation (potential buying).
🔹 Developer Activity
Definition: The level of activity on a cryptocurrency’s public repositories (e.g., GitHub).
Importance: Strong developer activity is a sign of ongoing innovation, updates, and a healthy project.
🔹 Social Sentiment
Definition: The general sentiment or mood of the community and investors as expressed on social media and forums.
Importance: Positive sentiment often correlates with price increases, while negative sentiment can signal potential downtrends.
🔹 Holder Balance (Behavior)
Definition: Distribution of addresses by holding behavior: Traders (short-term), Cruisers (mid-term), and Hodlers (long-term).
Importance: Helps predict market behavior based on different holder types.
🔹 Holder Balance (Type)
Definition: Distribution of cryptocurrency holdings among Retail (small holders), Whales (large holders), and Investors (institutional players).
Importance: Assesses the potential impact of different user groups on the market. A more decentralized distribution is generally viewed as positive, reducing the risk of price manipulation by large holders.
These metrics provide a comprehensive view of a cryptocurrency’s health, adoption, and potential for growth, making them essential for fundamental analysis in the crypto space.
🔶 SETTINGS
The script offers a range of customizable settings to tailor the analysis to your trading needs.
🔹 On-Chain Analysis
On-Chain Data: Choose the specific on-chain metric from the drop-down menu. Options include Wallet Profitability, Exchange Flow, Miner Flow, On-Chain Volume, Large Buyers/Sellers (Volume), Market Capitalization, Market Dominance, Active Addresses, Total Value Locked, Market Value to Realized Value, Developer Activity, Social Sentiment, Holder Balance (Behavior), and Holder Balance (Type).
Smoothing: Set the smoothing level to refine the displayed data. This can help in filtering out noise and getting a clearer view of trends.
Signal Line: Choose a signal line type (SMA, EMA, RMA, or None) and the length of the moving average for signal line calculation.
🔹 On-Chain Dashboard
On-Chain Stats: Toggle the display of the on-chain statistics.
Dashboard Size, Position, and Colors: Customize the size, position, and colors of the on-chain dashboard on the chart.
🔶 LIMITATIONS
Availability of on-chain data may vary and may not be accessible for all crypto assets.
🔶 RELATED SCRIPTS
Market-Sentiment-Technicals
Volatility IndicatorThe volatility indicator presented here is based on multiple volatility indices that reflect the market’s expectation of future price fluctuations across different asset classes, including equities, commodities, and currencies. These indices serve as valuable tools for traders and analysts seeking to anticipate potential market movements, as volatility is a key factor influencing asset prices and market dynamics (Bollerslev, 1986).
Volatility, defined as the magnitude of price changes, is often regarded as a measure of market uncertainty or risk. Financial markets exhibit periods of heightened volatility that may precede significant price movements, whether upward or downward (Christoffersen, 1998). The indicator presented in this script tracks several key volatility indices, including the VIX (S&P 500), GVZ (Gold), OVX (Crude Oil), and others, to help identify periods of increased uncertainty that could signal potential market turning points.
Volatility Indices and Their Relevance
Volatility indices like the VIX are considered “fear gauges” as they reflect the market’s expectation of future volatility derived from the pricing of options. A rising VIX typically signals increasing investor uncertainty and fear, which often precedes market corrections or significant price movements. In contrast, a falling VIX may suggest complacency or confidence in continued market stability (Whaley, 2000).
The other volatility indices incorporated in the indicator script, such as the GVZ (Gold Volatility Index) and OVX (Oil Volatility Index), capture the market’s perception of volatility in specific asset classes. For instance, GVZ reflects market expectations for volatility in the gold market, which can be influenced by factors such as geopolitical instability, inflation expectations, and changes in investor sentiment toward safe-haven assets. Similarly, OVX tracks the implied volatility of crude oil options, which is a crucial factor for predicting price movements in energy markets, often driven by geopolitical events, OPEC decisions, and supply-demand imbalances (Pindyck, 2004).
Using the Indicator to Identify Market Movements
The volatility indicator alerts traders when specific volatility indices exceed a defined threshold, which may signal a change in market sentiment or an upcoming price movement. These thresholds, set by the user, are typically based on historical levels of volatility that have preceded significant market changes. When a volatility index exceeds this threshold, it suggests that market participants expect greater uncertainty, which often correlates with increased price volatility and the possibility of a trend reversal.
For example, if the VIX exceeds a pre-determined level (e.g., 30), it could indicate that investors are anticipating heightened volatility in the equity markets, potentially signaling a downturn or correction in the broader market. On the other hand, if the OVX rises significantly, it could point to an upcoming sharp movement in crude oil prices, driven by changing market expectations about supply, demand, or geopolitical risks (Geman, 2005).
Practical Application
To effectively use this volatility indicator in market analysis, traders should monitor the alert signals generated when any of the volatility indices surpass their thresholds. This can be used to identify periods of market uncertainty or potential market turning points across different sectors, including equities, commodities, and currencies. The indicator can help traders prepare for increased price movements, adjust their risk management strategies, or even take advantage of anticipated price swings through options trading or volatility-based strategies (Black & Scholes, 1973).
Traders may also use this indicator in conjunction with other technical analysis tools to validate the potential for significant market movements. For example, if the VIX exceeds its threshold and the market is simultaneously approaching a critical technical support or resistance level, the trader might consider entering a position that capitalizes on the anticipated price breakout or reversal.
Conclusion
This volatility indicator is a robust tool for identifying market conditions that are conducive to significant price movements. By tracking the behavior of key volatility indices, traders can gain insights into the market’s expectations of future price fluctuations, enabling them to make more informed decisions regarding market entries and exits. Understanding and monitoring volatility can be particularly valuable during times of heightened uncertainty, as changes in volatility often precede substantial shifts in market direction (French et al., 1987).
References
• Bollerslev, T. (1986). Generalized Autoregressive Conditional Heteroskedasticity. Journal of Econometrics, 31(3), 307-327.
• Christoffersen, P. F. (1998). Evaluating Interval Forecasts. International Economic Review, 39(4), 841-862.
• Whaley, R. E. (2000). Derivatives on Market Volatility. Journal of Derivatives, 7(4), 71-82.
• Pindyck, R. S. (2004). Volatility and the Pricing of Commodity Derivatives. Journal of Futures Markets, 24(11), 973-987.
• Geman, H. (2005). Commodities and Commodity Derivatives: Modeling and Pricing for Agriculturals, Metals and Energy. John Wiley & Sons.
• Black, F., & Scholes, M. (1973). The Pricing of Options and Corporate Liabilities. Journal of Political Economy, 81(3), 637-654.
• French, K. R., Schwert, G. W., & Stambaugh, R. F. (1987). Expected Stock Returns and Volatility. Journal of Financial Economics, 19(1), 3-29.

Portfolio [Afnan]🚀 Portfolio - Advanced Portfolio Management Indicator 📊
A game-changing portfolio management tool designed to help traders stay on top of their positions and manage risk efficiently. This indicator combines detailed tracking, real-time analytics, and visual clarity to ensure traders are well-equipped for the dynamic world of financial markets.
📈 Key Features 💡
Track up to 14 positions with ease
Real-time Profit & Loss (P&L) updates and risk metrics
Visual representation of entry, stop-loss (SL), and target levels
Alerts for stop-loss breaches and target achievements
Comprehensive portfolio summaries for quick analysis
Customizable options to suit individual trading styles
🔍 Main Components ⚙️
📊 1. Position Tracking
Detailed position data: entry, stop-loss, target levels, and more
Real-time risk-reward ratios
Insights into position size and exposure percentages
Continuous updates on P&L in real-time
📉 2. Visual Indicators
Clear visual markers for entry, SL, and target prices
Price labels with detailed percentage changes
Indicators that show the current position's market status
💼 3. Portfolio Summary
Aggregate account values and exposure
Summarized P&L metrics across all positions
Risk management insights for better decision-making
Daily performance tracking to evaluate strategies
⚠️ 4. Alert System
Instant notifications for stop-loss breaches
Alerts when target prices are hit
Alerts operate for the current chart symbol
⚡ Customization Options 🎨
Show or hide specific data columns
Adjust the table's position and size for better visibility
Personalize color schemes and text styles
Switch between full portfolio view and single symbol focus
📱 How to Use 📝
Input your positions in the indicator's settings
Enable or disable specific positions dynamically
Customize display preferences to your liking
Set up alerts for proactive risk management
Monitor all your trading activities in one comprehensive dashboard
📌 Important Notes ℹ️
Compatible with any trading symbol
Updates seamlessly during market hours
Alerts are specific to the currently active chart symbol
Maximum capacity: 14 simultaneous positions
Created by: @AfnanTAjuddin
⚠️ Disclaimer ⚠️
This indicator is a tool for informational purposes only. Ensure all calculations are verified and consult a financial professional before making investment decisions.
🎯 "Stay disciplined, trade smart, and let data guide your decisions." 📊

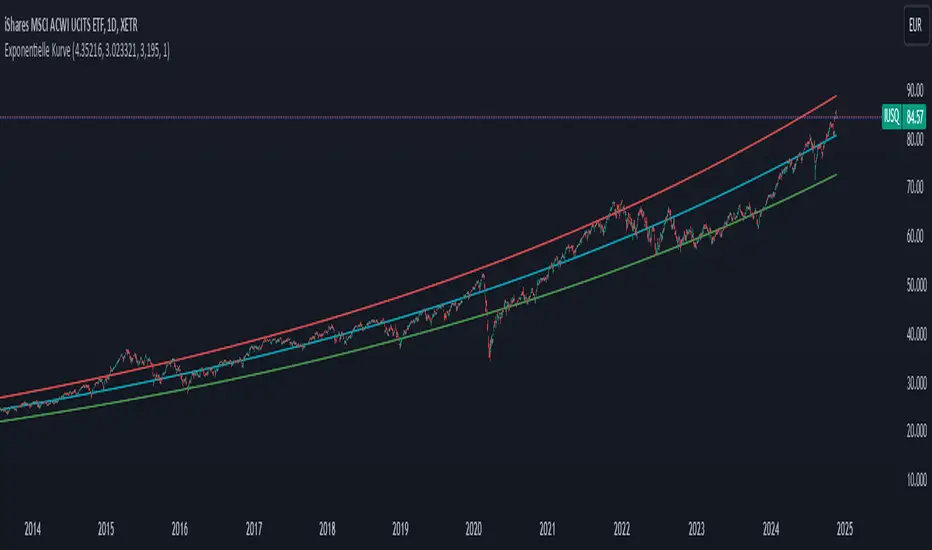
Exponential growthPurpose
The indicator plots an exponential curve based on historical price data and supports toggling between exponential regression and linear logarithmic regression. It also provides offset bands around the curve for additional insights.
Key Inputs
1. yxlogreg and dlogreg:
These are the "Endwert" (end value) and "Startwert" (start value) for calculating the slope of the logarithmic regression.
2. bars:
Specifies how many historical bars are considered in the calculation.
3.offsetchannel:
Adds an adjustable percentage-based offset to create upper and lower bands around the main exponential curve.
Default: 1 (interpreted as 10% bands).
4.lineareregression log.:
A toggle to switch between exponential function and linear logarithmic regression.
Default: false (exponential is used by default).
5.Dynamic Labels:
Creates a label showing the calculated regression values and historical bars count at the latest bar. The label is updated dynamically.
Use Cases
Exponential Growth Tracking:
Useful for assets or instruments exhibiting exponential growth trends.
Identifying Channels:
Helps identify support and resistance levels using the offset bands.
Switching Analysis Modes:
Flexibility to toggle between exponential and linear logarithmic analysis.
Comprehensive Time Chain Indicator - AYNETFeatures and Enhancements
Dynamic Timeframe Handling:
The script monitors new intervals of a user-defined timeframe (e.g., daily, weekly, monthly).
Flexible interval selection allows skipping intermediate time periods (e.g., every 2 days).
Custom Marker Placement:
Markers can be placed at:
High, Low, or Close prices of the bar.
A custom offset above or below the close price.
Special Highlights:
Automatically detects the start of a week (Monday) and the start of a month.
Highlights these periods with a different marker color.
Connecting Lines:
Markers are connected with lines to visually link the events.
Line properties (color, width) are fully customizable.
Dynamic Labels:
Optional labels display the timestamp of the event, formatted as per user preferences (e.g., yyyy-MM-dd HH:mm).
How It Works:
Timeframe Event Detection:
The is_new_interval flag identifies when a new interval begins in the selected timeframe.
Special flags (is_new_week, is_new_month) detect key calendar periods.
Dynamic Marker Drawing:
Markers are drawn using label.new at the specified price levels.
Colors dynamically adjust based on the type of event (interval vs. special highlight).
Connecting Lines:
The script dynamically connects markers with line.new, creating a time chain.
Previous lines are updated for styling consistency.
Customization Options:
Timeframe (main_timeframe):
Adjust the timeframe for detecting new intervals, such as daily, weekly, or hourly.
Interval (interval):
Skip intermediate events (e.g., draw a marker every 2 days).
Visualization:
Enable or disable markers and labels independently.
Customize colors, line width, and marker positions.
Special Periods:
Highlight the start of a week or month with distinct markers.
Applications:
Event Tracking:
Highlight and connect key time intervals for easier analysis of patterns or trends.
Custom Time Chains:
Visualize periodic data, such as specific trading hours or cycles.
Market Session Analysis:
Highlight market opens, closes, or other critical time-based events.
Usage Instructions:
Copy and paste the code into the Pine Script editor on TradingView.
Adjust the input settings for your desired timeframe, visualization preferences, and special highlights.
Apply the script to a chart to see the time chain visualized.
This implementation provides robust functionality while remaining easy to customize. Let me know if further enhancements are required! 😊
Gaussian Filter [BigBeluga]The Gaussian Filter - BigBeluga indicator is a trend-following tool that uses a Gaussian filter to smooth price data and identify directional shifts in the market. It provides dynamic signals for entering and exiting trades based on trend changes, helping traders stay aligned with the market's momentum. What sets this indicator apart is its ability to display precise entry and exit points with real-time tracking of percentage price changes, making it ideal for trend-based strategies.
SP500:
NIFTY50:
🔵 KEY FEATURES & USAGE
◉ Gaussian Filter Trend Line:
//@function GaussianFilter is used for smoothing, reducing noise, and computing derivatives of data.
//@param src (float) The source data (e.g., close price) to be smoothed.
//@param params (GaussianFilterParams) Gaussian filter parameters that include length and sigma.
//@returns (float) The smoothed value from the Gaussian filter.
gaussian_filter(float src, params) =>
var float weights = array.new_float(params.length) // Array to store Gaussian weights
total = 0.0
pi = math.pi
for i = 0 to params.length - 1
weight = math.exp(-0.5 * math.pow((i - params.length / 2) / params.sigma, 2.0))
/ math.sqrt(params.sigma * 2.0 * pi)
weights.set(i, weight)
total := total + weight
for i = 0 to params.length - 1
weights.set(i, weights.get(i) / total)
sum = 0.0
for i = 0 to params.length - 1
sum := sum + src * weights.get(i)
sum
The core functionality of the Gaussian Filter line is to show trend direction. When the trend line increases four times consecutively, it indicates an uptrend signal. Similarly, if it decreases four times in a row, it signals a downtrend. The smoothness of the filter helps traders stay on the right side of the market by filtering out noise and emphasizing the dominant trend direction.
◉ Entry and Exit Levels with Real-Time Price and Performance Data:
Each time the indicator detects a trend change, it plots an entry or exit level on the chart. For an uptrend, an entry level is marked, and for a downtrend, an exit level is plotted. These levels display the price at the time of the signal.
While the trend is ongoing, the indicator tracks the percentage change in price from the initial entry or exit signal to the current bar, updating in real-time. When a trend concludes, it displays the total percentage change from the entry or exit point to the trend's end. This feature provides valuable insights into how much the price has moved during each trend phase and allows traders to monitor the performance of each trade.
◉ Color-Coded Candlestick Representation with Trend Shift Alerts:
In addition to coloring the candlesticks based on the trend direction, the indicator also uses gray candles to highlight potential early trend shifts. For example, if the Gaussian Filter detects a downtrend but the price moves above the filter line, the candles turn gray, signaling a possible reversal or shift in momentum. Similarly, in an uptrend, if the price moves below the Gaussian Filter line, the candles turn gray as an early indication of potential bearish momentum. This visual cue helps traders stay alert to possible faster shifts in market direction, allowing for quicker decision-making.
🔵 CUSTOMIZATION
Length and Sigma for Gaussian Filter:
Adjust the length and sigma parameters to control how the Gaussian Filter smooths the price data. A longer length provides smoother trend lines, while adjusting sigma can fine-tune the level of smoothing applied.
Levels Display and Candle Coloring:
You can toggle the visibility of entry and exit levels as well as enable or disable the dynamic coloring of candlesticks based on the trend direction. The additional gray color setting provides an extra layer of information, allowing you to spot potential trend reversals early.
🔵 CONCLUSION
The Gaussian Filter indicator is a powerful tool for identifying and following market trends. By providing clear entry and exit signals, along with real-time tracking of price changes, it gives traders a structured way to manage trades and monitor performance. The color-coded candles, including gray to highlight possible trend shifts, add another dimension to visualizing market dynamics. The added flexibility of customizing colors and trend levels makes it a versatile indicator suitable for both trend-following and reversal strategies.

Triple Moving Average CrossoverBelow is the Pine Script code for TradingView that creates an indicator with three user-defined moving averages (with default periods of 10, 50, and 100) and labels for buy and sell signals at key crossovers. Additionally, it creates a label if the price increases by 100 points from the buy entry or decreases by 100 points from the sell entry, with the label saying "+100".
Explanation:
Indicator Definition: indicator("Triple Moving Average Crossover", overlay=true) defines the script as an indicator that overlays on the chart.
User Inputs: input.int functions allow users to define the periods for the short, middle, and long moving averages with defaults of 10, 50, and 100, respectively.
Moving Averages Calculation: The ta.sma function calculates the simple moving averages for the specified periods.
Plotting Moving Averages: plot functions plot the short, middle, and long moving averages on the chart with blue, orange, and red colors.
Crossover Detection: ta.crossover and ta.crossunder functions detect when the short moving average crosses above or below the middle moving average and when the middle moving average crosses above or below the long moving average.
Entry Price Tracking: Variables buyEntryPrice and sellEntryPrice store the buy and sell entry prices. These prices are updated whenever a bullish or bearish crossover occurs.
100 Points Move Detection: buyTargetReached checks if the current price has increased by 100 points from the buy entry price. sellTargetReached checks if the current price has decreased by 100 points from the sell entry price.
Plotting Labels: plotshape functions plot the buy and sell labels at the crossovers and the +100 labels when the target moves are reached. The labels are displayed in white and green colors.
ATH finder showing passed daysATH Finder Showing Passed Days Indicator
Introducing the "ATH Finder Showing Passed Days" – a cutting-edge TradingView indicator meticulously designed for traders and investors focused on capturing and analyzing the all-time highs (ATHs) of financial markets. Whether you're navigating the volatile waves of cryptocurrencies, the dynamic shifts of the stock market, forex, or any other trading instrument, this indicator is your essential tool for highlighting and understanding ATHs with precision.
Core Features:
Dynamic ATH Tracking: Seamlessly identifies and marks the most recent ATHs in any given market, ensuring that you are always up-to-date with significant price levels that matter the most.
Days Since ATH Visualization: Innovatively displays the number of days that have passed since the last ATH was reached. This powerful feature provides crucial insights into market sentiment, offering a clear view of how long the current price has been consolidating or retreating from its peak.
Visual Enhancements: Features a striking yellow arrow precisely at the ATH point, drawing immediate attention to pivotal market moments without cluttering your chart.
Strategic Placement of Information: Incorporates a non-intrusive label placed in the top right corner of your chart, summarizing the ATH value alongside the days elapsed since its occurrence. This approach ensures your chart remains clean and organized, allowing for other analyses to be conducted without distraction.
Customizable to Fit Your Needs: While it's ready to use out of the box, the indicator provides flexibility for customization, making it adaptable to various timeframes and individual trading strategies.
Benefits for Traders and Investors:
Provides a historical context to current price levels, helping to gauge the strength and potential of market trends.
Aids in identifying potential resistance levels, offering strategic insights for entry and exit points.
Enhances market analysis with a clear, visual representation of significant price milestones and their temporal context.
Easy Setup:
To integrate the "ATH Finder Showing Passed Days" indicator into your trading strategy, simply add it from the TradingView Indicators menu to your chart. Customize according to your preferences and let the indicator illuminate your path to more informed decision-making.
Why Choose the ATH Finder Showing Passed Days?
In the quest for market excellence, understanding the nuances of price movements and their historical significance is paramount. The "ATH Finder Showing Passed Days" indicator not only highlights where and when the market reached its zenith but also contextualizes these moments within the broader tapestry of trading days. Equip yourself with the insight to discern the momentum and potential retracements, elevating your trading to new heights.

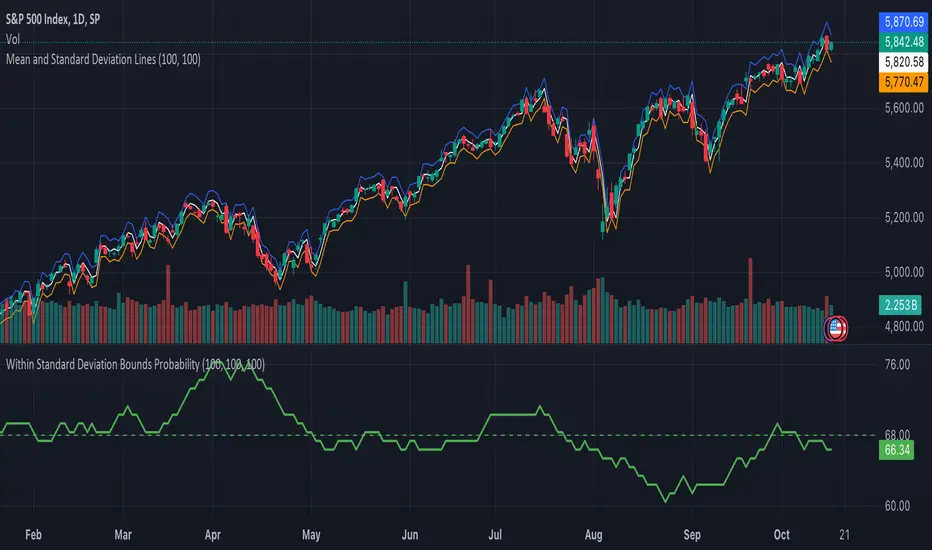
Within Standard Deviation Bounds ProbabilityThis indicator calculates the probability of the closing price remaining within the upper and lower bounds defined by the mean and standard deviation of historical percent changes. It also plots the probability line and a horizontal line at 68%, which would be the expected probability for a normal distribution. It is designed to be used with my other indicator "Mean and Standard Deviation Lines.
Inputs:
period (Days): This defines the number of bars used to calculate the mean and standard deviation.
Calculations:
Percent change: Calculates the daily percentage change between closing prices.
Mean and standard deviation: Calculates the mean and standard deviation of the percent changes over the specified period.
Bounds: Calculates the upper and lower bounds by adding/subtracting the standard deviation from the mean, multiplied by the closing price.
Crossover tracking: Iterates through bars and counts crosses above and below the bounds.
Probability calculation: Calculates the total crossover probability as a percentage of the period.
Plotting: Plots the probability line and the horizontal line at 68%.
Limitations:
Assumes a normal distribution of price changes, which may not be accurate in real markets.
Overall:
This indicator provides a way to visualize the probability of the price staying within calculated bounds based on historical volatility. However, it's important to be aware of its limitations and interpret the results within the context of your trading strategy and risk management.
Simple Volume-Based Support & Resistance IndicatorWelcome to my open-source indicator that uses trading volume and market trends to identify potential support and resistance levels. This tool is great for seeing where the price might pause or reverse, helping you make more informed trading decisions.
Why You'll Love This Indicator:
Volume Awareness: It looks at how much trading is happening to better predict support (where the price might stop falling) and resistance (where the price might stop rising).
Trend Tracking: The indicator uses the market's ups and downs to refine these support and resistance areas.
Easy to Read: We've made the lines and zones clear and simple to understand, so you can focus on what matters.
How to Use This Tool:
No complicated settings needed! Since it's open-source, feel free to explore the code and tweak it if you like.
The chart will show support zones in green and resistance zones in red. These are your clues for potential price turns.
The Open-Source Advantage:
This script is completely open for you to use, modify, and share. I believe in community-driven improvements, so dive into the code, see how it works, and if you've got a knack for coding, you can even make it better!
Understanding the Chart:
You'll see the support and resistance levels dynamically drawn on your chart. Green shades are where the price might bounce up, and red shades indicate where it might bounce down.
This indicator is my way of giving back to the trading community. By sharing it openly, I hope we can all help improve it and learn from each other. Happy trading!

Standardized Median Proximity [AlgoAlpha]Introducing the Standardized Median Proximity by AlgoAlpha 🚀📊 – a dynamic tool designed to enhance your trading strategy by analyzing price fluctuations relative to the median value. This indicator is built to provide clear visual cues on the price deviation from its median, allowing for a nuanced understanding of market trends and potential reversals.
🔍 Key Features:
1. 📈 Median Tracking: At the core of this indicator is the calculation of the median price over a specified lookback period. By evaluating the current price against this median, the indicator provides a sense of whether the price is trending above or below its recent median value.
medianValue = ta.median(priceSource, lookbackLength)
2. 🌡️ Normalization of Price Deviation: The deviation of the price from the median is normalized using standard deviation, ensuring that the indicator's readings are consistent and comparable across different time frames and instruments.
standardDeviation = ta.stdev(priceDeviation, 45)
normalizedValue = priceDeviation / (standardDeviation + standardDeviation)
3. 📌 Boundary Calculations: The indicator sets upper and lower boundaries based on the normalized values, helping to identify overbought and oversold conditions.
upperBoundary = ta.ema(positiveValues, lookbackLength) + ta.stdev(positiveValues, lookbackLength) * stdDevMultiplier
lowerBoundary = ta.ema(negativeValues, lookbackLength) - ta.stdev(negativeValues, lookbackLength) * stdDevMultiplier
4. 🎨 Visual Appeal and Clarity: With carefully chosen colors, the plots provide an intuitive and clear representation of market states. Rising trends are indicated in a shade of green, while falling trends are shown in red.
5. 🚨 Alert Conditions: Stay ahead of market movements with customizable alerts for trend shifts and impulse signals, enabling timely decisions.
alertcondition(ta.crossover(normalizedValue, 0), "Bullish Trend Shift", "Median Proximity Crossover Zero Line")
🔧 How to Use:
- 🎯 Set your preferred lookback lengths and standard deviation multipliers to tailor the indicator to your trading style.
- 💹 Utilize the boundary plots to understand potential overbought or oversold conditions.
- 📈 Analyze the color-coded column plots for quick insights into the market's direction relative to the median.
- ⏰ Set alerts to notify you of significant trend changes or conditions that match your trading criteria.
Basic Logic Explained:
- The indicator first calculates the median of the selected price source over your chosen lookback period. This median serves as a baseline for measuring price deviation.
- It then standardizes this deviation by dividing it by the standard deviation of the price deviation over a 45-period lookback, creating a normalized value.
- Upper and lower boundaries are computed using the exponential moving average (EMA) and standard deviation of these normalized values, adjusted by your selected multiplier.
- Finally, color-coded plots provide a visual representation of these calculations, offering at-a-glance insights into market conditions.
Remember, while this tool offers valuable insights, it's crucial to use it as part of a comprehensive trading strategy, complemented by other analysis and indicators. Happy trading!
🚀

COT CFTC Title: Enhanced COT CFTC Analysis Tool
Description:
Introducing the 'Enhanced COT CFTC Analysis Tool', meticulously designed to dissect the CFTC's Commitments of Traders (COT) data. This sophisticated tool aims to equip traders and investors with profound insights into market dynamics, utilizing the positions of Large Speculators, Commercials, and Non-Reportable Positions for a comprehensive market overview.
Key Features:
Large Speculators Analysis: Visualizes the net positions of large speculators, offering insights into speculative market sentiments.
Commercials Insights: Provides a deep dive into the trading activities of commercials, known for their strategic hedging practices.
Non-Reportable Positions Tracking: Displays the activities of smaller speculators, often considered as contrarian indicators.
Additional Plots:
Options Share: Allows selection between the proportion of options in the market.
Net, Short, and Long Positions: Offers options to view net, short, and long positions.
Percentage of Net Short and Long Positions: Displays the percentage of net short and long positions, either as raw data or as an index over a specified time period.
Extreme Value Indicators: Highlights extreme values in the market data, providing critical insights into market peaks and troughs.
This tool features an intuitive display with color-coded lines and charts, simplifying the complex data analysis process. It also includes an innovative 5% detector, highlighting extreme market positions for enhanced market understanding.
Spread Analysis: This feature provides an insightful visualization of the spread between various COT data points, enabling users to gauge the market’s depth and liquidity effectively.
Usage Tips:
Utilize divergence analysis between different groups to identify potential trend reversals.
Keep a close eye on the 5% detector for early indications of market overextensions.
The 'Enhanced COT CFTC Analysis Tool' is a vital addition to your trading arsenal, designed to enrich your trading strategy with precise and actionable market insights. It’s not just an indicator; it’s a comprehensive market analysis suite.
Disclaimer: This indicator is for educational purposes only. Trading decisions should always be approached with caution and based on thorough personal analysis.

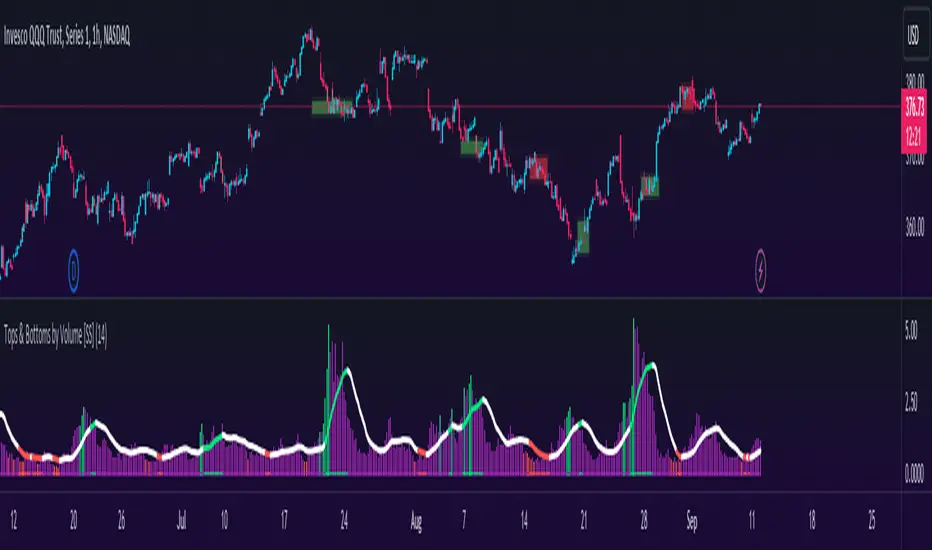
Tops & Bottoms by Volume [SS]Hey everyone,
Releasing this indicator that helps you time entries by alerting to potential tops and bottoms in the market.
Background to the indicator:
I was playing around with things that signalled reversals / tops and bottoms in SPSS and R using Pivot Points to mark tops and bottoms. Happened to come across a generally statistically significant relationship between sell to buy volume that was tracked over 10 to 50 candles back and pivot highs and pivot lows.
So I put it into a beta version of an indicator to see how it looked and was a bit surprised.
Since then, I have went back and narrowed down the details of what works/what doesn't work and this is the tentative result!
What it does / How to Use:
It tracks the cumulative buy vs sell volume. Buy volume is cumulated as close > open (or green candles) and sell is open > close (or red candles).
It then cumulates this over a user-defined period (defaulted to 14). It then looks back to see the highest vs lowest areas of sell and buy volume and makes determinations based on this relationship.
The relationship was determined by me using my own analysis and programmed into the indicators algorithm (using highest vs lowest function in pine).
It will plot areas of potential reversal to the upside as green on the histogram or red for a downside reversal. Once this becomes significant enough to signal an actual bottom or top, it will then change the SMA colour from white to green (for bottom) or red (for top).
Your entries generally should be once the SMA turns back to white. So from green to white, you would enter long or inverse for red to white (enter short).
Settings and Customizability:
Here are the key points to keep in mind if you are using this indicator:
Your lookback length should be between 10 to 50. I have left it open for you to modify it below and above this lookback period; however, this is the major periods deemed to be significant in identifying tops and bottoms. Thus, I advise against operating outside of those parameters.
You can toggle between smoothed look or historgram with SMA. The strength in this indicator comes from using the SMA and watching the SMA for signals of reversals, so if you want to filter out the background noise, you can simply look at the plotted SMA. If you want a more responsive indication of impending reversals, leave the smoothed option off and view the histogram in conjunction with the SMA.
The indicator will change the candle colour to red for bearish reversal and green to bullish reversal. This is based on the SMA. You can toggle this off and/or on as desired.
It is recommended to leave ETH (extended trading hours) turned off and RTH turned on.
Please read the instructions carefully.
If you require further assistance, I have posted a tutorial video.
Please be sure you are reading and/or watching carefully.
If you have questions, please feel free to post them below. But bear in mind I likely will not respond if it is already addressed in the description above (this happens often).
Also, feel free to leave your comments or suggestions below as well.
Thanks for checking this out. If you are interested in volume based trading, I suggest also checking out my Buyer to Seller volume indicator which cumulates total buying vs selling volume over a designated lookback period. Both of these used in conjunction are very powerful tools for volume based traders! ( Available here )
NOTE:
The boxes drawn in the chart are my own for demonstration purposes. I unfortunately cannot get the indicator to overlay the boxes on the chart in a separate viewing pane. That is why I opted to use the barcolor function to change the candle color instead :-).
Thanks again everyone and safe trades!
Multi-Day VWAP V2Updated from V1.
Chart the multi-day Volume Weighted Average Price ( VWAP ). Normally, the VWAP is tracked for the current day, from the first bar of the day (regular or extended session). The VWAP shows the current value of:
-> sum(hlc3 * volume , barsForDay) / sum( volume , barsForDay),
-> where 'barsForDay' is the total number bars that have elapsed during the day for the chart interval.
The multi-day version tracks the VWAP for N days back, by averaging the previous N - 1 day bars VWAP and the current VWAP for the current bar (chart interval).
This is very different that simply using a volume weighted moving average , since the closing VWAP values are used for the historical day bars. The results are interesting for intraday trades... especially for values of 1, 2, 3, 4, and 5 days.
Version 2 includes the closing VWAP for the previous day. There are enough instances where the price chooses to bounce from the previous day's closing VWAP value that it is worth discussing. Usually this value is at or near the daily pivot, but sometimes not. Circled in the chart are some areas of recent SPY bounces on the previous day's closing VWAP.
It seems that when the 5-Day VWAP and normal VWAP have "enough" percentage separation, that there can be good intraday swing opportunities using bounces off VWAP indicators. This is similar to waiting for Hourly/Daily/Weekly/Monthly/etc pivots to have "enough" separation to allow for swing setups. When pivots are "closely" spaced, odds are the price is range bound for the time period (daily range in the case of day pivots, etc).
Previous closing VWAPs can be plotted for all 5 of the original. As with my other scripts, I welcome all comments to spark new ideas that we can all benefit from.
Enjoy.

Multi-Day VWAP
Chart the multi-day Volume Weighted Average Price ( VWAP ). Normally, the VWAP is tracked for the current day, from the first bar of the day (regular or extended session). The VWAP shows the current value of:
-> sum(hlc3 * volume , barsForDay) / sum( volume , barsForDay),
-> where 'barsForDay' is the total number bars that have elapsed during the day for the chart interval.
The multi-day version tracks the VWAP for N days back, by averaging the previous N - 1 day bars VWAP and the current VWAP for the current bar (chart interval).
This is very different that simply using a volume weighted moving average , since the closing VWAP values are used for the historical day bars. The results are interesting for intraday trades... especially for values of 1, 2, 3, 4, and 5 days.
Enjoy.

Liquidity Hunter: Stop Hunts & Volume ClustersStop Hunt Wick Detection
What it catches:
Wicks that are 2x+ larger than the candle body (adjustable)
Minimum wick size to filter out noise
Optional volume confirmation (stops hunts usually have higher volume)
Marks bullish stop hunts (long lower wicks) with 💎 and "BUY LIQ"
Marks bearish stop hunts (long upper wicks) with 💎 and "SELL LIQ"
Extends dashed lines showing where liquidity was grabbed
Volume Cluster Detection
What it tracks:
Bars with volume 1.5x+ above average (adjustable)
Automatically merges nearby clusters within 3 bars
Shows different colors based on volume intensity:
Yellow = 3x+ average volume (extreme)
Orange = 2x+ average volume (strong)
Blue = 1.5x+ average volume (moderate)
Draws horizontal zones showing where volume accumulated
Labels show the volume multiplier (e.g., "VOL: 2.3x")
Adjustable Settings
You can tune:
Wick-to-body ratio threshold
Minimum wick size percentage
Volume confirmation requirements
Cluster sensitivity and merge distance
The theory: Stop hunts grab liquidity above/below key levels, then price reverses. Volume clusters show where institutions accumulated positions. Both mark areas price is likely to revisit.
Try it out and let me know what needs tweaking!

Kalman Hull Kijun [BackQuant]Kalman Hull Kijun
A trend baseline that merges three ideas into one clean overlay, Kalman filtering for noise control, Hull-style responsiveness, and a Kijun-like Donchian midline for structure and bias.
Context and lineage
This indicator sits in the same family as two related scripts:
Kalman Price Filter
This is the foundational building block. It introduces the Kalman filter concept, a state-estimation algorithm designed to infer an underlying “true” signal from noisy measurements, originally used in aerospace guidance and later adopted across robotics, economics, and markets.
Kalman Hull Supertrend
This is the original script made, which people loved. So it inspired me to create this one.
Kalman Hull Kijun uses the same core philosophy as the Supertrend variant, but instead of building a Supertrend band system, it produces a single structural baseline that behaves like a Kijun-style reference line.
What this indicator is trying to solve
Most trend baselines sit on a bad trade-off curve:
If you smooth hard, the line reacts late and misses turns.
If you react fast, the line whipsaws and tracks noise.
Kalman Hull Kijun is designed to land closer to the middle:
Cleaner than typical fast moving averages in chop.
More responsive than slow averages in directional phases.
More “structure aware” than pure averages because the baseline is range-derived (Kijun-like) after filtering.
Core idea in plain language
The plotted line is a Kijun-like baseline, but it is not built from raw candles directly.
High level flow:
Start with a chosen price stream (source input).
Reduce measurement noise using Kalman-style state estimation.
Add Hull-style responsiveness so the filtered stream stays usable for trend work.
Build a Kijun-like baseline by taking a Donchian midpoint of that filtered stream over the base period.
So the output is a single baseline that is intended to be:
Less jittery than a simple fast MA.
Less laggy than a slow MA.
More “range anchored” than standard smoothing lines.
How to read it
1) Trend and bias (the primary use)
Price above the baseline, bullish bias.
Price below the baseline, bearish bias.
Clean flips across the baseline are regime changes, especially when followed by a hold or retest.
2) Retests and dynamic structure
Treat the baseline like dynamic S/R rather than a signal generator:
In uptrends, pullbacks that respect the baseline can act as continuation context.
In downtrends, reclaim failures around the baseline can act as continuation context.
Repeated back-and-forth around the line usually means compression or chop, not clean trend.
3) Extension vs compression (using the fill)
The fill is meant to communicate “distance” and “pressure” visually:
Large separation between price and baseline suggests expansion.
Price compressing into the baseline suggests rebalancing and decision points.
Inputs and what they change
Kijun Base Period
Controls the structural memory of the baseline.
Higher values track broader swings and reduce flips.
Lower values track tighter swings and react faster.
Kalman Price Source
Defines what data the filter is estimating.
Close is usually the cleanest default.
HL2 often “feels” smoother as an average price.
High/Low sources can become more reactive and less stable depending on the market.
Measurement Noise
Think of this as the main smoothness knob:
Higher values generally produce a calmer filtered stream.
Lower values generally produce a faster, more reactive stream.
Process Noise
Think of this as adaptability:
Higher values adapt faster to changing conditions but can get twitchy.
Lower values adapt slower but stay stable.
Plotting and UI (what you see on chart)
1) Adaptive line coloring
Baseline turns bullish color when price is above it.
Baseline turns bearish color when price is below it.
This makes the state readable without extra panels.
2) Gradient “energy” fill
Bull fill appears between price and baseline when above.
Bear fill appears between price and baseline when below.
The goal is clarity on separation and control, not decoration.
3) Rim effect
A subtle band around price that only appears on the active side.
Helps highlight directional control without hiding candles.
4) Candle painting (optional)
Candles can be colored to match the current bias.
Useful for scanning many charts quickly.
Disable if you prefer raw candles.
Alerts
Long state alert when price is above the baseline.
Short state alert when price is below the baseline.
Best used as a bias or regime notification, not a standalone entry trigger.
Where it fits in a workflow
This is a context layer, it pairs well with:
Market structure tools, BOS/MSB, OBs, FVGs.
Momentum triggers that need a regime filter.
Mean reversion tools that need “do not fade trends” context.
Limitations
No baseline eliminates chop whipsaws, tuning only manages the trade-off.
Settings should not be copy pasted across assets without checking behavior.
This does not forecast, it estimates and smooths state, then expresses it as a structural baseline.
Disclaimer
Educational and informational only, not financial advice.
Not a complete trading system.
If you use it in any trading workflow, do proper backtesting, forward testing, and risk management before any live execution.
