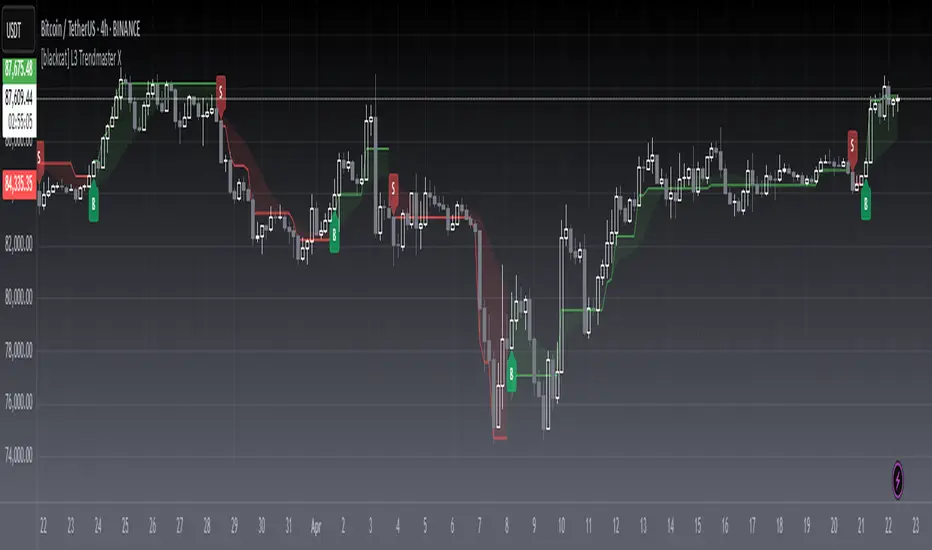
[blackcat] L3 Trendmaster XOVERVIEW
The L3 Trendmaster X is an advanced trend-following indicator meticulously crafted to assist traders in identifying and capitalizing on market trends. This sophisticated tool integrates multiple technical factors, including Average True Range (ATR), volume dynamics, and price spreads, to deliver precise buy and sell signals. By plotting dynamic trend bands directly onto the chart, it offers a comprehensive visualization of potential trend directions, enabling traders to make informed decisions swiftly and confidently 📊↗️.
FEATURES
Customizable Input Parameters: Tailor the indicator to match your specific trading needs with adjustable settings:
Trendmaster X Multiplier: Controls the sensitivity of the ATR-based levels.
Trendmaster X Period: Defines the period over which the ATR is calculated.
Window Length: Specifies the length of the moving window for standard deviation calculations.
Volume Averaging Length: Determines how many periods are considered for averaging volume.
Volatility Factor: Adjusts the impact of volatility on the trend bands.
Core Technical Metrics:
Dynamic Range: Measures the range between high and low prices within each bar.
Candle Body Size: Evaluates the difference between open and close prices.
Volume Average: Assesses the cumulative On-Balance Volume relative to the dynamic range.
Price Spread: Computes the standard deviation of the price ranges over a specified window.
Volatility Factor: Incorporates volatility into the calculation of trend bands.
Advanced Trend Bands Calculation:
Upper Level: Represents potential resistance levels derived from the ATR multiplier.
Lower Level: Indicates possible support levels using the same ATR multiplier.
High Band and Low Band: Dynamically adjust to reflect current trend directions, offering a clear view of market sentiment.
Visual Representation:
Plots distinct green and red trend lines representing bullish and bearish trends respectively.
Fills the area between these trend lines and the middle line for enhanced visibility.
Displays clear buy ('B') and sell ('S') labels on the chart for immediate recognition of trading opportunities 🏷️.
Alert System:
Generates real-time alerts when buy or sell conditions are triggered, ensuring timely action.
Allows customization of alert messages and frequencies to align with individual trading strategies 🔔.
HOW TO USE
Adding the Indicator:
Open your TradingView platform and navigate to the "Indicators" section.
Search for " L3 Trendmaster X" and add it to your chart.
Adjusting Settings:
Fine-tune the input parameters according to your preferences and trading style.
For example, increase the Trendmaster X Multiplier for higher sensitivity during volatile markets.
Decrease the Window Length for shorter-term trend analysis.
Monitoring Trends:
Observe the plotted trend bands and labels on the chart.
Look for buy ('B') labels at potential support levels and sell ('S') labels at resistance levels.
Setting Up Alerts:
Configure alerts based on the generated buy and sell signals.
Choose notification methods (e.g., email, SMS) and set alert frequencies to stay updated without constant monitoring 📲.
Combining with Other Tools:
Integrate the Trendmaster X with other technical indicators like Moving Averages or RSI for confirmation.
Utilize fundamental analysis alongside the indicator for a holistic approach to trading.
Backtesting and Optimization:
Conduct thorough backtests on historical data to evaluate performance.
Optimize parameters based on backtest results to enhance accuracy and reliability.
Real-Time Application:
Apply the optimized settings to live charts and monitor real-time signals.
Execute trades based on confirmed signals while considering risk management principles.
LIMITATIONS
Market Conditions: The indicator might produce false signals in highly volatile or sideways-trending markets due to increased noise and lack of clear direction 🌪️.
Complementary Analysis: Traders should use this indicator in conjunction with other analytical tools to validate signals and reduce the likelihood of false positives.
Asset-Specific Performance: Effectiveness can vary across different assets and timeframes; therefore, testing on diverse instruments is recommended.
NOTES
Data Requirements: Ensure adequate historical data availability for accurate calculations and reliable signal generation.
Demo Testing: Thoroughly test the indicator on demo accounts before deploying it in live trading environments to understand its behavior under various market scenarios.
Parameter Customization: Regularly review and adjust parameters based on evolving market conditions and personal trading objectives.
Cari dalam skrip untuk "trend"
TrendlinesTrendline S&R
This indicator is an automated technical analysis tool designed to identify the most relevant Support and Resistance (S&R) zones based on market pivots. Unlike standard pivot indicators that clutter the chart with historic lines, this script uses a "Closest-to-Price" algorithm to display only the single most relevant Support (Green) and Resistance (Red) zone currently interacting with price action.
It solves common frustrations with automated trendlines—specifically the issue of lines disappearing immediately upon a breakout—by introducing a Stability Buffer.
Key Features & Importance
The script scans hundreds of potential trendlines but only draws the one geographically closest to the current price.
Importance: This ensures you are looking at the zone that matters right now. It filters out distant or irrelevant historic lines, keeping your chart clean and focused on immediate price action.
🛡️ 5-Bar Stability Buffer (Anti-Flicker)
Feature: A hardcoded 5-bar "memory" prevents the zone from disappearing the moment price touches or breaks it.
Importance: This is critical for trading breakouts. It allows you to see the zone persist while price breaches it, helping you distinguish between a true breakout, a fakeout, or a retest, without the reference level vanishing from your screen.
🔍 Dynamic Pivot Filtering
Feature: Uses a restricted Pivot Strength (5-15) and Minimum Confirmation (2-8 touches).
Importance: By enforcing these limits, the indicator ignores insignificant market noise and micro-swings, ensuring that drawn zones represent structural market levels with genuine liquidity.
🔔 Integrated Alert System
Feature: Built-in alerts for "Zone Breakout" (candle close crossing the zone) and "Zone Touch" (wick entering the zone).
Importance: Allows you to set the indicator and walk away. You will be notified instantly when price interacts with these key levels, removing the need to stare at the chart.
📉 Adaptive Tolerance (Fixed ATR)
Feature: Uses a fixed ATR multiplier internally to determine the width of the zone.
Importance: This automatically adjusts the thickness of the support/resistance zone based on the asset's volatility.
Settings Guide
Bars to Apply: How far back in history the script looks for pivots (Default: 300).
Pivot Source: Choose between calculating from "High/Low" (wicks) or "Close" (bodies).
Pivot Strength: The number of bars required on each side to define a swing point (Range: 5–15).
Min Pivot Confirmation: The minimum number of touches required to validate a trendline (Range: 2–8).
How to Use
Add the indicator to your chart.
Adjust Pivot Strength if you want to catch smaller swings (lower number) or major structures (higher number).
Set an alert in TradingView by clicking the "Clock" icon, selecting this indicator, and choosing "Zone Breakout" or "Zone Touch".

TrendlinesDowntrend lines are one of the most important tools in technical analysis. A downtrend line is created by connecting a series of lower highs which forms a clear visual line where price repeatedly finds resistance. Traders use these lines to understand trend direction, time entries, plan exits, and quickly recognize when momentum is shifting.
This indicator automatically finds and maintains the strongest downtrend lines on any timeframe. It removes the guesswork and inconsistency that comes with manually drawing trendlines.
Unlike most other trendline indicators that just draw lines from swing highs to the current high, this indicator actively scans for new pivot highs, tests each potential line against live price action and only promotes a line to valid status once it has proven itself as a true trendline by price touching or respecting the line a user defined number of times, with the default set to three. This filters out noise and leaves only the most meaningful and reliable trendlines on your chart.
When price eventually breaks a respected downtrend line the indicator highlights the breakout immediately. Traders often use these moments for entries confirmation signals or to prepare for a potential shift in market behavior. The breakout alert is built directly into the indicator so you never miss an important move.
This indicator also works with the Pine Screener to find tickers with current valid trendlines.
How are trendlines determined?
The indicator begins by anchoring to the most recent pivot high. From there it draws a temporary line to the current bar and evaluates every bar between the two points.
Each time a high comes within a user selected buffer zone around that line it is counted as a touch. Once the required number of touches is confirmed and price has never exceeded the buffer to the upside the trendline becomes valid and is displayed on the chart as an active downtrend line.

abstractchartpatternsLibrary "abstractchartpatterns"
Library having abstract types and methods for chart pattern implementations
checkBarRatio(p1, p2, p3, properties)
checks if three zigzag pivot points are having uniform bar ratios
Parameters:
p1 (chart.point) : First pivot point
p2 (chart.point) : Second pivot point
p3 (chart.point) : Third pivot point
properties (ScanProperties)
Returns: true if points are having uniform bar ratio
getRatioDiff(p1, p2, p3)
gets ratio difference between 3 pivot combinations
Parameters:
p1 (chart.point)
p2 (chart.point)
p3 (chart.point)
Returns: returns the ratio difference between pivot2/pivot1 ratio and pivot3/pivot2 ratio
method inspect(points, stratingBar, endingBar, direction, ohlcArray)
Creates a trend line between 2 or 3 points and validates and selects best combination
Namespace types: chart.point
Parameters:
points (chart.point ) : Array of chart.point objects used for drawing trend line
stratingBar (int) : starting bar of the trend line
endingBar (int) : ending bar of the trend line
direction (float) : direction of the last pivot. Tells whether the line is joining upper pivots or the lower pivots
ohlcArray (OHLC type from Trendoscope/ohlc/1) : Array of OHLC values
Returns: boolean flag indicating if the trend line is valid and the trend line object as tuple
method draw(this)
draws pattern on the chart
Namespace types: Pattern
Parameters:
this (Pattern) : Pattern object that needs to be drawn
Returns: Current Pattern object
method erase(this)
erase the given pattern on the chart
Namespace types: Pattern
Parameters:
this (Pattern) : Pattern object that needs to be erased
Returns: Current Pattern object
method push(this, p, maxItems)
push Pattern object to the array by keeping maxItems limit
Namespace types: Pattern
Parameters:
this (Pattern ) : array of Pattern objects
p (Pattern) : Pattern object to be added to array
@oaram maxItems Max number of items the array can hold
maxItems (int)
Returns: Current Pattern array
method deepcopy(this)
Perform deep copy of a chart point array
Namespace types: chart.point
Parameters:
this (chart.point ) : array of chart.point objects
Returns: deep copy array
DrawingProperties
Object containing properties for pattern drawing
Fields:
patternLineWidth (series int) : Line width of the pattern trend lines
showZigzag (series bool) : show zigzag associated with pattern
zigzagLineWidth (series int) : line width of the zigzag lines. Used only when showZigzag is set to true
zigzagLineColor (series color) : color of the zigzag lines. Used only when showZigzag is set to true
showPatternLabel (series bool) : display pattern label containing the name
patternLabelSize (series string) : size of the pattern label. Used only when showPatternLabel is set to true
showPivotLabels (series bool) : Display pivot labels of the patterns marking 1-6
pivotLabelSize (series string) : size of the pivot label. Used only when showPivotLabels is set to true
pivotLabelColor (series color) : color of the pivot label outline. chart.bg_color or chart.fg_color are the appropriate values.
deleteOnPop (series bool) : delete the pattern when popping out from the array of Patterns.
Pattern
Object containing Individual Pattern data
Fields:
points (chart.point )
originalPoints (chart.point )
trendLine1 (Line type from Trendoscope/LineWrapper/1) : First trend line joining pivots 1, 3, 5
trendLine2 (Line type from Trendoscope/LineWrapper/1) : Second trend line joining pivots 2, 4 (, 6)
properties (DrawingProperties) : DrawingProperties Object carrying common properties
patternColor (series color) : Individual pattern color. Lines and labels will be using this color.
ratioDiff (series float) : Difference between trendLine1 and trendLine2 ratios
zigzagLine (series polyline) : Internal zigzag line drawing Object
pivotLabels (label ) : array containning Pivot labels
patternLabel (series label) : pattern label Object
patternType (series int) : integer representing the pattern type
patternName (series string) : Type of pattern in string
ScanProperties
Object containing properties for pattern scanning
Fields:
offset (series int) : Zigzag pivot offset. Set it to 1 for non repainting scan.
numberOfPivots (series int) : Number of pivots to be used in pattern search. Can be either 5 or 6
errorRatio (series float) : Error Threshold to be considered for comparing the slope of lines
flatRatio (series float) : Retracement ratio threshold used to determine if the lines are flat
checkBarRatio (series bool) : Also check bar ratio are within the limits while scanning the patterns
barRatioLimit (series float) : Bar ratio limit used for checking the bars. Used only when checkBarRatio is set to true
avoidOverlap (series bool) : avoid overlapping patterns.
allowedPatterns (bool ) : array of bool encoding the allowed pattern types.
allowedLastPivotDirections (int ) : array of int representing allowed last pivot direction for each pattern types
themeColors (color ) : color array of themes to be used.

chartpatternsLibrary "chartpatterns"
Library having complete chart pattern implementation
method draw(this)
draws pattern on the chart
Namespace types: Pattern
Parameters:
this (Pattern) : Pattern object that needs to be drawn
Returns: Current Pattern object
method erase(this)
erase the given pattern on the chart
Namespace types: Pattern
Parameters:
this (Pattern) : Pattern object that needs to be erased
Returns: Current Pattern object
method findPattern(this, properties, patterns)
Find patterns based on the currect zigzag object and store them in the patterns array
Namespace types: zg.Zigzag
Parameters:
this (Zigzag type from Trendoscope/ZigzagLite/2) : Zigzag object containing pivots
properties (PatternProperties) : PatternProperties object
patterns (Pattern ) : Array of Pattern objects
Returns: Current Pattern object
PatternProperties
Object containing properties for pattern scanning
Fields:
offset (series int) : Zigzag pivot offset. Set it to 1 for non repainting scan.
numberOfPivots (series int) : Number of pivots to be used in pattern search. Can be either 5 or 6
errorRatio (series float) : Error Threshold to be considered for comparing the slope of lines
flatRatio (series float) : Retracement ratio threshold used to determine if the lines are flat
checkBarRatio (series bool) : Also check bar ratio are within the limits while scanning the patterns
barRatioLimit (series float) : Bar ratio limit used for checking the bars. Used only when checkBarRatio is set to true
avoidOverlap (series bool)
patternLineWidth (series int) : Line width of the pattern trend lines
showZigzag (series bool) : show zigzag associated with pattern
zigzagLineWidth (series int) : line width of the zigzag lines. Used only when showZigzag is set to true
zigzagLineColor (series color) : color of the zigzag lines. Used only when showZigzag is set to true
showPatternLabel (series bool) : display pattern label containing the name
patternLabelSize (series string) : size of the pattern label. Used only when showPatternLabel is set to true
showPivotLabels (series bool) : Display pivot labels of the patterns marking 1-6
pivotLabelSize (series string) : size of the pivot label. Used only when showPivotLabels is set to true
pivotLabelColor (series color) : color of the pivot label outline. chart.bg_color or chart.fg_color are the appropriate values.
allowedPatterns (bool ) : array of bool encoding the allowed pattern types.
themeColors (color ) : color array of themes to be used.
Pattern
Object containing Individual Pattern data
Fields:
pivots (Pivot type from Trendoscope/ZigzagLite/2) : array of Zigzag Pivot points
trendLine1 (Line type from Trendoscope/LineWrapper/1) : First trend line joining pivots 1, 3, 5
trendLine2 (Line type from Trendoscope/LineWrapper/1) : Second trend line joining pivots 2, 4 (, 6)
properties (PatternProperties) : PatternProperties Object carrying common properties
patternColor (series color) : Individual pattern color. Lines and labels will be using this color.
ratioDiff (series float) : Difference between trendLine1 and trendLine2 ratios
zigzagLine (series polyline) : Internal zigzag line drawing Object
pivotLabels (label ) : array containning Pivot labels
patternLabel (series label) : pattern label Object
patternType (series int) : integer representing the pattern type
patternName (series string) : Type of pattern in string

Momentum Trend Bands (MTB)📌 What Is the Momentum Trend Bands (MTB) Indicator?
The Momentum Trend Bands (MTB) is a custom-built trend detection indicator that blends momentum and volatility into a dynamic, visual system. Its core goal is to help traders identify the beginning and strength of a trend earlier than traditional tools like moving averages, while filtering out market noise.
🧠 What Is It Built On?
The indicator is built on two foundational concepts:
1. Rate of Change (ROC): This measures the speed at which the price is moving. We use a fast and a slow version of ROC and then calculate their difference. This difference gives us a momentum signal — it shows whether the price is gaining upward or downward strength.
2. Standard Deviation (Volatility): This shows how much the price fluctuates. By calculating it over a certain period, we can measure market noise and filter out weak, insignificant moves that might otherwise cause false signals.
Together, momentum shows direction, and volatility shows confidence.
🛠️ How Does It Work?
• The core of the indicator is a smoothed momentum signal, representing the net difference between fast and slow momentum.
• Around this signal, we build upper and lower bands — these are dynamic boundaries that expand or contract based on volatility.
• When the momentum breaks above or below these bands, it signals a strong directional move — suggesting the start or continuation of a trend.
The bands also serve a visual filter:
• If momentum stays within the bands, it implies the market is consolidating or ranging.
• When it exits the bands decisively, it implies strength in that direction.
📈 How to Use It?
1. Trend Entry:
o When the momentum signal rises above the upper band, it suggests a strong bullish trend may be starting.
o When the signal drops below the lower band, it indicates a bearish trend.
2. Stay Out of Chop:
o If the signal moves sideways within the bands, it’s best to avoid trading — the market is likely consolidating or ranging.
3. Visual Confirmation:
o The background color changes with the trend: green for bullish, red for bearish, gray for neutral. This makes it quick to read visually.
4. Signal Arrows:
o Small up or down arrows appear when trends begin, serving as early entry points.
⚙️ What Kind of Market Does It Work Best In?
• Trending Markets: MTB shines in markets with strong directional movement — whether up or down. It's designed to pick up momentum early and hold through trend continuation.
• Volatile Instruments: The built-in volatility filter helps in markets like crypto or commodities where price action is fast and erratic.
• Avoid Flat or Low-Volume Conditions: In sideways markets, MTB may stay gray or flip often — these are not ideal times to trade using this indicator alone.
💎 Why Is It Unique?
Unlike many indicators that react slowly (like moving averages) or trigger too often (like raw momentum), MTB balances early detection with reliability. Its unique combination of:
• ROC difference for directional intent,
• Smoothing for signal clarity,
• Bands scaled by volatility for robustness,
…makes it stand apart from commonly available indicators on platforms like TradingView.

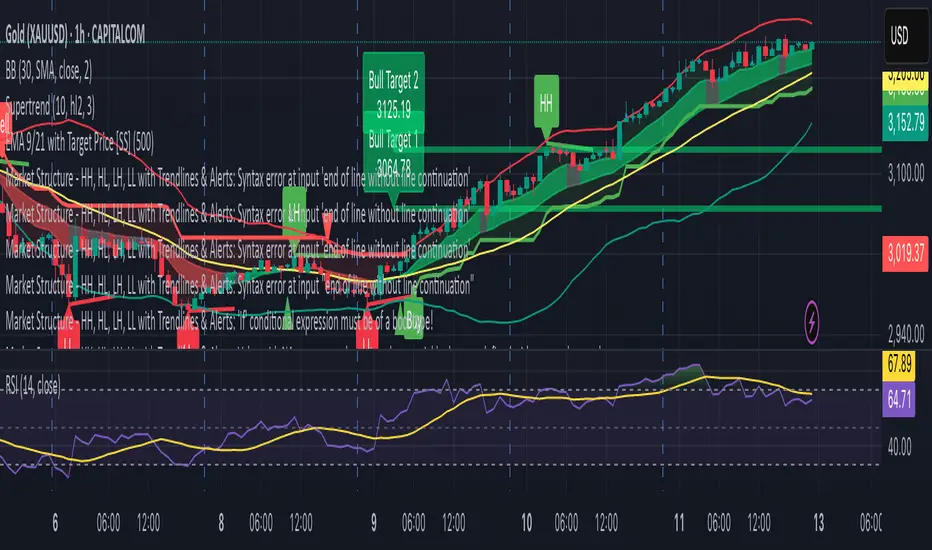
Market Structure - HH, HL, LH, LL with Trendlines & AlertsMarket Structure Script – HH, HL, LH, LL with Trendlines & Alerts
This Pine Script is designed to help identify key market structure patterns such as Higher Highs (HH), Higher Lows (HL), Lower Highs (LH), and Lower Lows (LL) on price charts. It also draws trendlines connecting the respective swing points and provides alerts when these important price patterns occur.
Key Features:
Swing High and Low Detection:
The script uses the ta.pivothigh and ta.pivotlow functions to identify significant swing highs and swing lows based on the pivot length (pivotLen). These points mark local peaks and troughs in the price action.
Dynamic Pivot Length:
The script adjusts the pivotLen (which defines the number of bars used to calculate swing points) based on the current timeframe of the chart. For example, for a 15-minute chart, it uses a pivot length of 5 bars, while for a daily chart, it uses 10 bars. This dynamic adjustment ensures that the script works across different timeframes.
Higher Highs (HH), Higher Lows (HL), Lower Highs (LH), Lower Lows (LL):
Higher High (HH): Identifies a price peak that is higher than the previous swing high, indicating an uptrend.
Higher Low (HL): Identifies a price trough that is higher than the previous swing low, supporting the idea of an ongoing uptrend.
Lower High (LH): Identifies a price peak that is lower than the previous swing high, suggesting a potential reversal or downtrend.
Lower Low (LL): Identifies a price trough that is lower than the previous swing low, indicating a downtrend.
Trendlines:
For each identified Higher High, Higher Low, Lower High, or Lower Low, the script automatically draws a trendline connecting the corresponding swing points. These trendlines provide a visual representation of the market’s price structure, showing support and resistance levels.
Labels:
The script places labels on the chart next to the respective swing points. These labels mark whether the point is a Higher High (HH), Higher Low (HL), Lower High (LH), or Lower Low (LL). This helps traders easily visualize the price pattern at a glance.
Alerts:
Alert conditions are set for when a Higher High (HH), Higher Low (HL), Lower High (LH), or Lower Low (LL) is detected. Users can set up alerts to be notified whenever one of these key market structure patterns forms. Alerts are an essential feature for traders who want to act quickly when important trend changes are happening.
TrendLibrary "Trend"
calculateSlopeTrend(source, length, thresholdMultiplier)
Parameters:
source (float)
length (int)
thresholdMultiplier (float)
Purpose:
The primary goal of this function is to determine the short-term trend direction of a given data series (like closing prices). It does this by calculating the slope of the data over a specified period and then comparing that slope against a dynamic threshold based on the data's recent volatility. It classifies the trend into one of three states: Upward, Downward, or Flat.
Parameters:
`source` (Type: `series float`): This is the input data series you want to analyze. It expects a series of floating-point numbers, typically price data like `close`, `open`, `hl2` (high+low)/2, etc.
`length` (Type: `int`): This integer defines the lookback period. The function will analyze the `source` data over the last `length` bars to calculate the slope and standard deviation.
`thresholdMultiplier` (Type: `float`, Default: `0.1`): This is a sensitivity factor. It's multiplied by the standard deviation to determine how steep the slope needs to be before it's considered a true upward or downward trend. A smaller value makes it more sensitive (detects trends earlier, potentially more false signals), while a larger value makes it less sensitive (requires a stronger move to confirm a trend).
Calculation Steps:
Linear Regression: It first calculates the value of a linear regression line fitted to the `source` data over the specified `length` (`ta.linreg(source, length, 0)`). Linear regression finds the "best fit" straight line through the data points.
Slope Calculation: It then determines the slope of this linear regression line. Since `ta.linreg` gives the *value* of the line on the current bar, the slope is calculated as the difference between the current bar's linear regression value (`linRegValue`) and the previous bar's value (`linRegValue `). A positive difference means an upward slope, negative means downward.
Volatility Measurement: It calculates the standard deviation (`ta.stdev(source, length)`) of the `source` data over the same `length`. Standard deviation is a measure of how spread out the data is, essentially quantifying its recent volatility.
Adaptive Threshold: An adaptive threshold (`threshold`) is calculated by multiplying the standard deviation (`stdDev`) by the `thresholdMultiplier`. This is crucial because it means the definition of a "flat" trend adapts to the market's volatility. In volatile times, the threshold will be wider, requiring a larger slope to signal a trend. In quiet times, the threshold will be narrower.
Trend Determination: Finally, it compares the calculated `slope` to the adaptive `threshold`:
If the `slope` is greater than the positive `threshold`, the trend is considered **Upward**, and the function returns `1`.
If the `slope` is less than the negative `threshold` (`-threshold`), the trend is considered **Downward**, and the function returns `-1`.
If the `slope` falls between `-threshold` and `+threshold` (inclusive of 0), the trend is considered **Flat**, and the function returns `0`.
Return Value:
The function returns an integer representing the determined trend direction:
`1`: Upward trend
`-1`: Downward trend
`0`: Flat trend
In essence, this library function provides a way to gauge trend direction using linear regression, but with a smart filter (the adaptive threshold) to avoid classifying minor noise or low-volatility periods as significant trends.
EMA 50 + 200 Trend Signal TableEMA 50 + 200 Trend Signal Table (ETT)
This indicator provides a multi-timeframe trend signal table based on the 50-period and 200-period Exponential Moving Averages (EMAs). It visually plots the EMA 50 and EMA 200 on the chart, along with a customizable, compact table that indicates the trend direction across multiple timeframes. This tool is useful for traders looking to quickly identify market trends and momentum on various timeframes.
How It Works
- EMA Trend Analysis: The script compares the EMA 50 and EMA 200 values to determine the trend. When EMA 50 is above EMA 200, the trend is considered Bullish; if EMA 50 is below EMA 200, the trend is Bearish. If EMA 200 data is unavailable (e.g., on very short timeframes), the trend status will display as Neutral.
- Multi-Timeframe Trend Signals: The table displays the trend signals across five user-defined timeframes, updating in real time. Each timeframe row shows either Bullish, Bearish, or Neutral, with colors customizable to your preference.
Features
- EMA 50 and EMA 200 Visualization: Plots EMA 50 and EMA 200 lines directly on the chart. Users can customize the color and line thickness for each EMA to fit their charting style.
- Trend Signal Table: A table positioned on the chart (with options for positioning in the corners) shows the trend direction for the selected timeframes.
Bullish Trend: Highlighted in green (default) with 50% opacity.
Bearish Trend: Highlighted in red (default) with 50% opacity.
Neutral Trend: Highlighted in gray (default) with 50% opacity.
- Customizable Table Appearance: Allows users to select the position of the table (top-right, top-left, bottom-right, or bottom-left) and choose between compact sizes (Extra Small, Small, Normal).
- Adjustable Colors: Users can specify custom colors for each trend status (Bullish, Bearish, Neutral) as well as for the text and table border colors.
Inputs and Customizations
- Timeframes: Choose up to five different timeframes for trend analysis.
- EMA Colors and Line Widths: Customize the color and line width of EMA 50 and EMA 200 plotted on the chart.
- Table Settings: Control the position, size, and color options of the trend signal table for improved visibility and integration with your chart layout.
Use Case This indicator is ideal for traders who employ a multi-timeframe approach to confirm trends and filter entries. By monitoring the relative positions of EMA 50 and EMA 200 across various timeframes, traders can get a quick snapshot of trend strength and direction, aiding in informed trading decisions.

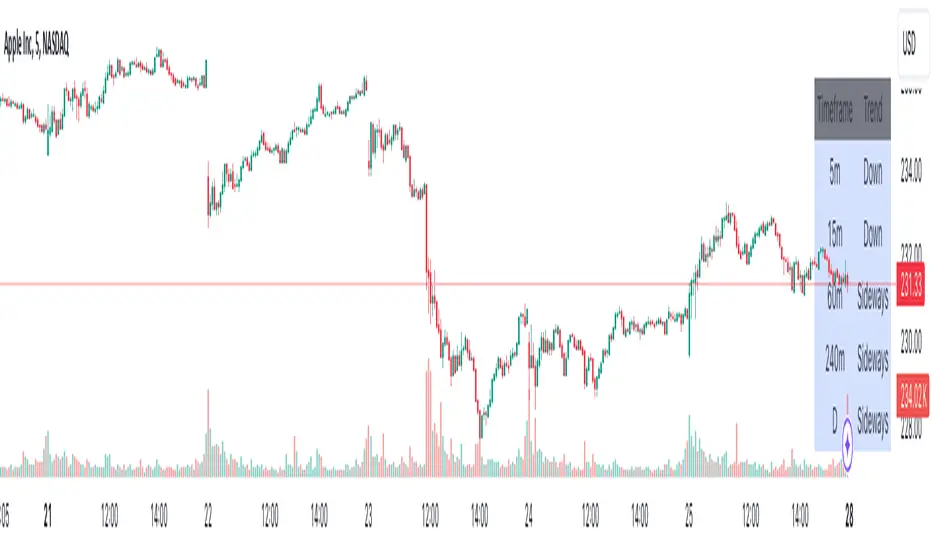
Advanced Multi-Timeframe Trend DetectorThis script is designed to provide a multi-timeframe trend analysis, combining moving averages (MAs) and the Relative Strength Index (RSI) to determine market direction across different timeframes. Here's a breakdown of what the script does:
Key Components of the Script
Inputs:
Moving Averages: Short and long moving average lengths (9 and 21 periods).
ATR and RSI Lengths: ATR (Average True Range) and RSI (Relative Strength Index) lengths set to 14 periods.
RSI Levels: Overbought and oversold levels for the RSI set to 70 and 30, respectively.
Trend Determination:
A function called trendDirection evaluates the trend based on the closing prices of the current and previous periods, as well as the RSI value.
It classifies the trend as "Up", "Down", or "Sideways" based on the conditions:
Up: Current close is higher than the previous close and RSI is below the overbought level.
Down: Current close is lower than the previous close and RSI is above the oversold level.
Sideways: If neither condition is met.
Table Creation:
A table is created at the bottom right of the chart to display the trend for different timeframes (5m, 15m, 60m, 240m, and Daily).
The table is initialized with headers and then populated with the trend results for each timeframe.
Calculating Trends for Each Timeframe:
The script fetches the current and previous close prices for each timeframe using request.security().
It calculates the RSI for each timeframe and then calls the trendDirection function to determine the trend.
Displaying Trends:
The results are displayed in a table format, with each timeframe and its corresponding trend.
Summary
Overall, this script provides a concise way to visualize market trends across multiple timeframes, using MAs and RSI to offer a more nuanced view of potential market movements. This can help traders make more informed decisions based on the prevailing trends.
TP RSITP RSI - Integrated Trend, Momentum, and Volatility Analyzer
The TP RSI indicator is an innovative 3-in-1 technical analysis tool that combines RSI, Bollinger Bands, and an EMA ribbon to provide traders with a comprehensive view of trend, momentum, and volatility in a single, easy-to-interpret visual display.
Why This Combination? This mashup addresses three critical aspects of market analysis simultaneously:
Trend identification and strength (EMA ribbon)
Momentum measurement (RSI)
Volatility assessment (Bollinger Bands)
By integrating these components, traders can make more informed decisions based on multiple factors without switching between different indicators.
How Components Work Together:
1. EMA Ribbon (Trend):
10 EMAs form 5 color-coded bands
Blue: Uptrend, Red: Downtrend
Provides a nuanced view of trend strength and potential reversals
2. RSI (Momentum):
Color-coded for quick interpretation
Blue: Upward momentum, Red: Downward momentum, White: Neutral
Position relative to the ribbon offers additional insight
3. Bollinger Bands (Volatility):
Applied to RSI for dynamic overbought/oversold levels
Narrow bands indicate low volatility, suggesting potential breakouts
Unique Aspects and Originality:
Synergistic visual cues: Color coordination between ribbon and RSI
Multi-factor confirmation: Requires alignment of trend, momentum, and volatility for strong signals
Volatility-adjusted momentum: RSI interpreted within the context of Bollinger Bands
How these components work together:
Buy Signal: Blue ribbon with blue RSI outside the ribbon.
Sell Signal: Red ribbon with red RSI outside the ribbon.
Neutral: White RSI or RSI inside the ribbon (not recommended for trading)
Increasing Momentum: RSI crossing above upper Bollinger Band (upward) or below lower Band (downward).
Trend Strength: RSI rejection by the ribbon, while all bands are colored along with the trend direction, identifies a strong trend.

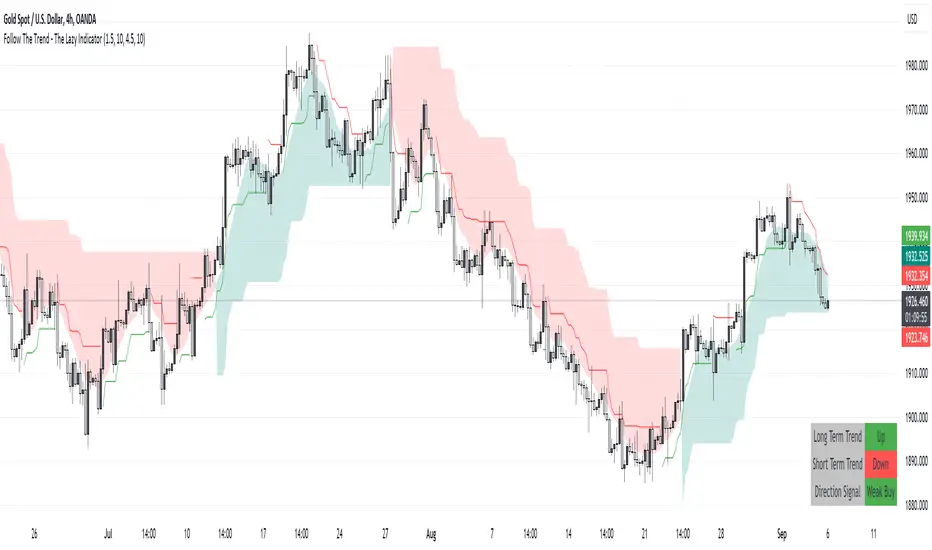
Follow The Trend - The Lazy Indicator**Understanding the 'Follow The Trend - The Lazy Indicator'**
This indicator is designed to help traders visualize the trend direction over both short-term and long-term periods. Let's dive deeper into understanding how it's designed and how it can be beneficial.
**1. How It's Designed:**
* **User Inputs:**
The first few lines ask the user for specific inputs related to the Average True Range (ATR) length and values for both short-term and long-term trends. ATR is a volatility indicator and, in this context, is used as part of the SuperTrend calculation.
* **SuperTrend Calculations:**
This indicator uses the SuperTrend, a popular trend-following indicator. Here, two SuperTrends are being calculated – one for short-term trends and another for long-term trends. The direction of the SuperTrend is also determined, signaling whether the trend is upwards or downwards.
* **Visual Representations:**
* The short-term SuperTrend is represented using green lines (for uptrend) and red lines (for downtrend).
* The indicator also provides a "cloud" between a Simple Moving Average (SMA) of the closing price (over the past 10 periods) and the long-term SuperTrend. This cloud changes color based on the direction of the long-term trend, providing another visual cue about market direction.
* **Signal Evaluation:**
This part of the code interprets the combination of short-term and long-term trends and assigns trading signals like "Strong Buy," "Weak Buy," "Strong Sell," "Weak Sell," and so on. This can act as a guide for traders, suggesting potential trading actions based on the prevailing trends.
* **Signal Coloration:**
The indicator also assigns colors to each signal. For instance, "Strong Buy" is green, "Strong Sell" is red, and there are transparency adjustments for weak signals to differentiate them from strong ones.
* **Tabular Presentation:**
At the end of the script, there’s a table displayed on the chart, summarizing the direction of both the long-term and short-term trends, as well as the overall trading signal. It provides a quick snapshot for traders to understand the current market scenario.
**2. How It May Be Helpful:**
* **Simplicity:**
The "Follow The Trend" indicator, despite its underlying complexity, is presented in a very user-friendly way. By just looking at the color cues and the table, traders can quickly understand the market's trend and potential direction.
* **Dual Trend Analysis:**
By analyzing both short-term and long-term trends, traders get a comprehensive view. This helps in understanding if the market is just having a short-term retracement (temporary reverse in direction) or if there's a genuine change in the long-term trend.
* **Adaptability:**
Traders can adjust the ATR values and lengths to customize the sensitivity of the indicator. This means it can be adapted to different assets or varying market conditions.
* **Actionable Signals:**
The signals like "Strong Buy" or "Weak Sell" are direct suggestions that can help in decision-making. Especially for beginners or those who might be overwhelmed by complex charts, such signals can be very beneficial.
* **Visual Appeal:**
The combination of trend lines, cloud coloring, and tabulated information provides a visually pleasing and easy-to-understand representation of market data. This can help reduce analysis fatigue and make chart reading more enjoyable.
In conclusion, the "Follow The Trend - The Lazy Indicator" is designed to make trend-following more accessible and actionable. By providing clear visual cues and combining short-term and long-term trend analysis, it offers traders a tool that's both comprehensive and user-friendly. Whether you're a beginner looking for clear signals or an experienced trader wanting an overview of the market trend, this indicator might be a useful addition to your toolkit.
cphelperLibrary "cphelper"
ACPU helper library - for private use. Not so meaningful for others.
calculate_rr(targetArray, rrArray, breakevenOnTarget1)
calculates risk reward for given targets
Parameters:
targetArray (float ) : array of targets
rrArray (float ) : array of risk reward
breakevenOnTarget1 (simple bool) : option to breakeven
Returns: array rrArray
trendPairs(l1StartX, l1StartY, l1EndX, l1EndY, l2StartX, l2StartY, l2EndX, l2EndY, zgColor)
creates trendline pairs
Parameters:
l1StartX (int) : startX of first line
l1StartY (float) : startY of first line
l1EndX (int) : endX of first line
l1EndY (float) : endY of first line
l2StartX (int) : startX of second line
l2StartY (float) : startY of second line
l2EndX (int) : endX of second line
l2EndY (float) : endY of second line
zgColor (color) : line color
Returns:
find_type(l1t, l2t, channelThreshold)
Finds type based on trendline pairs
Parameters:
l1t (line) : line1
l2t (line) : line2
channelThreshold (simple float) : theshold for channel identification
Returns: pattern type and flags
getFlags(flags)
Flatten flags
Parameters:
flags (bool ) : array of flags
Returns: - flattened flags isChannel, isTriangle, isWedge, isExpanding, isContracting, isFlat, isRising, isFalling
getType(typeNum)
Get type based on type number
Parameters:
typeNum (int) : number representing type
Returns: String value of type
getStatus(status, maxStatus)
Get status based on integer value representations
Parameters:
status (int) : integer representing current status
maxStatus (int) : integer representing max status
Returns: String status value
calculate_simple_targets(trendLines, settingsMatrix, patternTypeMapping, patternType)
Calculate targets based on trend lines
Parameters:
trendLines (line ) : trendline pair array
settingsMatrix (matrix) : matrix containing settings
patternTypeMapping (string ) : array containing pattern type mapping
patternType (int) : pattern type
Returns: arrays containing long and short calculated targets
recalculate_position(patternTypeAndStatusMatrix, targetMatrix, index, pIndex, status, maxStatus, targetValue, stopValue, dir, breakevenOnTarget1)
Recalculate position values
Parameters:
patternTypeAndStatusMatrix (matrix) : matrix containing pattern type and status
targetMatrix (matrix) : matrix containing targets
index (int) : current index
pIndex (int) : pattern index
status (int) : current status
maxStatus (int) : max status reached
targetValue (float) : current target value
stopValue (float) : current stop value
dir (int) : direction
breakevenOnTarget1 (simple bool) : flag to breakeven upon target1
Returns: new status and maxStatus values
draw_targets(longTargets, shortTargets, index, labelColor, patternName, positionIndex, longMaxStatus, longStatus, shortMaxStatus, shortStatus, tempBoxes, tempLines, tempLabels)
Draw targets on chart
Parameters:
longTargets (matrix) : matrix containing long targets
shortTargets (matrix) : matrix containing short targets
index (int) : current index
labelColor (color) : color of lines and labels
patternName (string) : Pattern name
positionIndex (int) : position on the chart
longMaxStatus (int) : max status for long
longStatus (int) : long status value
shortMaxStatus (int) : max status for short
shortStatus (int) : short status value
tempBoxes (box ) : temporary box array
tempLines (line ) : temporary lines array
tempLabels (label ) : temporary labels array
Returns: void
populate_open_stats(patternIdArray, barMatrix, patternTypeAndStatusMatrix, patternColorArray, longTargets, shortTargets, patternRRMatrix, OpenStatPosition, lblSizeOpenTrades)
Populate open stats table
Parameters:
patternIdArray (int ) : pattern Ids
barMatrix (matrix) : matrix containing bars
patternTypeAndStatusMatrix (matrix) : matrix containing pattern type and status
patternColorArray (color ) : array containing current patter colors
longTargets (matrix) : matrix of long targets
shortTargets (matrix) : matrix of short targets
patternRRMatrix (matrix) : pattern risk reward matrix
OpenStatPosition (simple string) : table position
lblSizeOpenTrades (simple string) : text size
Returns: void
draw_pattern_label(trendLines, patternFlagMatrix, patternTypeAndStatusMatrix, patternColorArray, patternFlags, patternLabelArray, zgColor, patternType, drawLabel, clearOldPatterns, safeRepaint, maxPatternsReference)
Parameters:
trendLines (line )
patternFlagMatrix (matrix)
patternTypeAndStatusMatrix (matrix)
patternColorArray (color )
patternFlags (bool )
patternLabelArray (label )
zgColor (color)
patternType (int)
drawLabel (simple bool)
clearOldPatterns (simple bool)
safeRepaint (simple bool)
maxPatternsReference (simple int)
populate_closed_stats(patternTypeAndStatusMatrix, bullishCounts, bearishCounts, bullishRetouchCounts, bearishRetouchCounts, bullishSizeMatrix, bearishSizeMatrix, bullishRR, bearishRR, ClosedStatsPosition, lblSizeClosedTrades, showSelectivePatternStats, showPatternStats, showStatsInPercentage)
Parameters:
patternTypeAndStatusMatrix (matrix)
bullishCounts (matrix)
bearishCounts (matrix)
bullishRetouchCounts (matrix)
bearishRetouchCounts (matrix)
bullishSizeMatrix (matrix)
bearishSizeMatrix (matrix)
bullishRR (matrix)
bearishRR (matrix)
ClosedStatsPosition (simple string)
lblSizeClosedTrades (simple string)
showSelectivePatternStats (simple bool)
showPatternStats (simple bool)
showStatsInPercentage (simple bool)
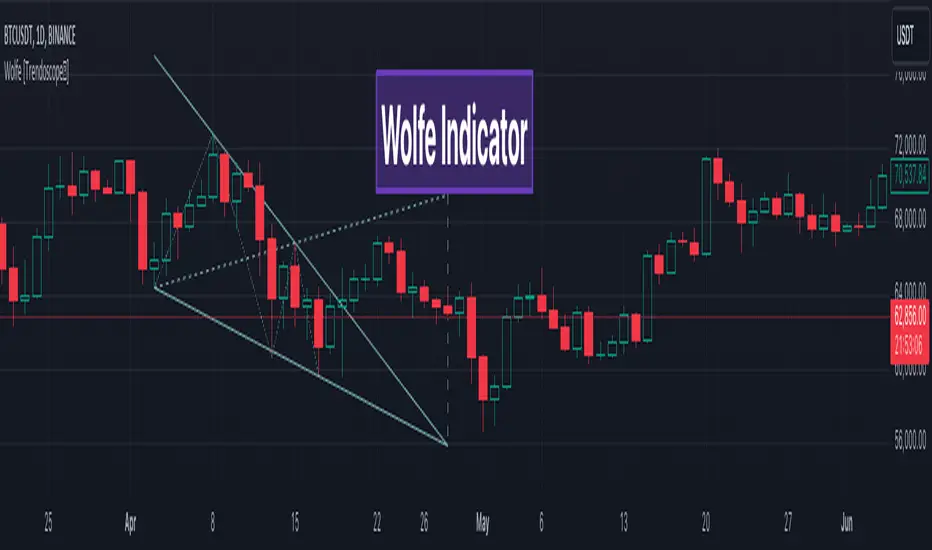
Wolfe Scanner (Multi - zigzag) [HeWhoMustNotBeNamed]Before getting into the script, I would like to explain bit of history around this project. Wolfe was in the back of my mind for some time and I had several attempts so far.
🎯Initial Attempt
When I first developed harmonic patterns, I got many requests from users to develop script to automatically detect Wolfe formation. I thought it would be easy and started boasting everywhere that I am going to attempt this next. However I miserably failed that time and started realising it is not as simple as I thought it would be. I started with Wolfe in mind. But, ran into issues with loops. Soon figured out that finding and drawing wedge is more trickier. I decided will explore trendline first so that it can help find wedge better. Soon, the project turned into something else and resulted in Auto-TrendLines-HeWhoMustNotBeNamed and Wolfe left forgotten.
🎯Using predefined ratios
Wolfe also has predefined fib ratios which we can use to calculate the formation. But, upon initial development, it did not convince me that it matches visual inspection of Wolfe all the time. Hence, I decided to fall back on finding wedge first.
🎯 Further exploration in finding wedge
This attempt was not too bad. I did not try to jump into Wolfe and nor I bragged anywhere about attempting anything of this sort. My target this time was to find how to derive wedge. I knew then that if I manage to calculate wedge in efficient way, it can help further in finding Wolfe. While doing that, ended up deriving Wedge-and-Flag-Finder-Multi-zigzag - which is not a bad outcome. I got few reminders on Wolfe after this both in comments and in PM.
🎯You never fail until you stop trying!!
After 2 back to back hectic 50hr work weeks + other commitments, I thought I will spend some time on this. Took less than half weekend and here we are. I was surprised how much little time it took in this attempt. But, the plan was running in my subconscious for several weeks or even months. Last two days were just putting these plans into an action.
Now, let's discuss about the script.
🎲 Wolfe Concept
Wolfe concept is simple. Whenever a wedge is formed, draw a line joining pivot 1 and 4 as shown in the chart below:
Converging trendline forms the stop loss whereas line joining pivots 1 and 4 form the profit taking points.
🎲 Settings
Settings are pretty straightforward. Explained in the chart below.
Strategy Template - V2This is an educational script created to demonstrate few basic building blocks of a trend based strategy and how to achieve different entry and exit types. My initial intention was to create a comprehensive strategy template which covers all the aspects of strategy. But, ended up creating fully fledged strategy based on trend following.
This is an enhancement on Strategy-Template But this script is comparitively more complex. Hence I decided to create new version instead of updating the existing one.
Lets dive deep.
SIMPLE COMPONENTS OF TREND FOLLOWING STRATEGY
TREND BIAS - This defines the direction of trend. Idea is not to trade against the trend direction. If the bias is bullish, look for long opportunities and if bias is bearish, look for short opportunities. Stay out of the market when the bias is neutral.
Often, trend bias is determined based on longer timeframe conditions. Example - 200 Moving Average, Higher timeframe moving averages, Higher timeframe high-lows etc. can be used for determining the trend bias.
In this script, I am using Weekly donchian channels combined with daily donchian channels to define trend bias.
Long Bias - 40 Day donchian channel sits completely in upper portion of 40 Week dochnial channel.
Short Bias - 40 Day donchian channel sits completely in lower portion of 40 Week donchian channel.
ENTRY CONDITION - Entry signals are generated only in the direction of bias. Hence, when in LongBias, we only get Long signals and when in short bias, we only get short signals.
In our case, when in Long Bias - if price hits 40 day high for the first time, this creates our long entry signal. Similarly when in Short Bias , price hitting 40 day low will create signal for going short. Since we do not take trades opposite to trend, no entry conditions are formed when price hits 40 day high in Short Bias or 40 day low in Long Bias.
EXIT CONDITION - Exit conditions are formed when we get signals of trend failure.
In our case, when in long trade, price hitting 40 day low creates exit signal. Similarly when in short trade price hitting 40 day high creates exit signal for short trade.
DIFFERENT TYPES OF ENTRY AND EXIT
In this script, I have tried to demonstrate different entry and exit types.
Entry types
Market - Enter immediately when entry signal is received. That is, in this case when price crossover over high in long bias and crosses under low in short bias
Stop - This method includes estimating at what level new highs are made and creating a stop buy order at that level. This way, we do not miss if the break out is stronger. But, susciptible to fail during fakeouts.
Limit - This method includes executing a limit order to buy at lower price or sell at higher price. In trend following methods, downside of limit order is when there is genuine breakout, these limit orders may not hit and during trend failures the limit orders are likely to hit and go straight to stop.
Stop-Limit - this is same as stop order but will also place a limit condition to avoid buying on overextended breakout or with lots of slippage.
Exit types
Market - whether to keep the existing trade running or whether to close it is determined after close of each bar and exit orders are executed manually upon receiving exit signal.
Stop - We place stop loss orders beforehand when there is a trade in place. This can help in avoiding big movements against trade within bar. But, this may also stop on false signals or fakeouts.
Take profit
Stop - No take profits are configured.
Target - 30% of the positions are closed when take profit levels are hit. Take profit levels are defined by risk reward.
USING THE CODE AS TEMPLATE
As mentioned earlier, I intended to create a fully fledged strategy template. But, ended up creating a fully fledged stratgy. However, you can take some part of this code and use it to start your own strategy. Will explain what all things can be adopted without worrying about the strategy implementation within
Strategy definition : This can be copied as is and just change the title of strategy. This defines some of the commonly used parameters of strategy which can help with close to realistic backtesting results for your coded strategy and comparison with buy and hold.
Generic Strategy Parameters : The parameter which defines controlling alllowed trade direction and trading window are present here. This again can be copied as is and variable inDateRange can be directly used in entry conditions.
Generic Methods : f_getMovingAverage and f_secureSecurity are handy and can be used as is. atr method provideded by pine gives you ATR based on RMA. If you want SMA or any other moving average based ATR, you can use the method f_getCustomAtr
Trade Statements : This section has all types of trading instructions which includes market/stop/limit/stop-limit type of entries and exits and take profit statements. You can adopt the type of entry you are interested in and change when condition to suit your strategy.
Trade conditions and levels : This section is required. But, cannot be copied. All the trade logic goes here which also sets parameters which are used in when of Trade Statements.
Hope this helps.

TrendMaAlignmentStrategy - Long term tradesThis is another strategy based on moving average alignment and HighLow periods. This is more suitable for long term trend traders and mainly for stocks.
Candle is colored lime if : Lookback Period has at least one bar with moving averages fully aligned OR None of the bars in Lookback periods has negatively aligned moving averages (More than half are positively aligned).
Candle is colored orange if : Lookback Period has at least one bar with moving averages fully aligned in negative way OR none of the bars in lookback has positively aligned moving averages (More than half are negatively aligned).
If either of above conditions are met, candle is colored silver.
Moving average alignment parameters:
Moving Average Type : MA Type for calculating Aligned Moving Average Index
Lookback Period : Lookback period to check highest and lowest Moving Average index.
HighLow parameters:
Short High/Low Period: Short period to check highs and lows
Long High/Low Period: Longer Period to check highs and lows.
If short period high == long period high, which means, instrument has made new high in the short period.
ATR Parameters:
ATR Length: ATR periods
StopMultiplyer: To set stop loss.
ReentryStopMultiplyer: This is used when signal is green buy stop loss on previous trade is hit. In such cases, new order will not be placed until it has certain distance from stop line.
Trade Prameters:
Exit on Signal : To be used with caution. Enabling it will allow us to get out on bad trades early and helps exit trades in long consolidation periods. But, this may also cause early exit in the trend. If instrument is trending nicely, it is better to keep this setting unchecked.
Trade direction : Default is long only. Short trades are not so successful in backtest. Use it with caution.
Backtest years : limit backtesting to certain years.
Part of the logic used from study's below:
Other strategies based on these two studies are below (which are meant for short - medium terms):

Breakouts & Pullbacks [Trendoscope®]🎲 Breakouts & Pullbacks - All-Time High Breakout Analyzer
Probability-Based Post-Breakout Behavior Statistics | Real-Time Pullback & Runup Tracker
A professional-grade Pine Script v6 indicator designed specifically for analyzing the historical and real-time behavior of price after strong All-Time High (ATH) breakouts. It automatically detects significant ATH breakouts (with configurable minimum gap), measures the depth and duration of pullbacks, the speed of recovery, and the subsequent run-up strength — then turns all this data into easy-to-read statistical probabilities and percentile ranks.
Perfect for swing traders, breakout traders, and anyone who wants objective, data-driven insight into questions like:
“How deep do pullbacks usually get after a strong ATH breakout?”
“How many bars does it typically take to recover the breakout level?”
“What is the median run-up after recovery?”
“Where is the current pullback or run-up relative to historical ones?”
🎲 Core Concept & Methodology
Indicator is more suitable for indices or index ETFs that generally trade in all-time highs however subjected to regular pullbacks, recovery and runups.
For every qualified ATH breakout, the script identifies 4 distinct phases:
Breakout Point – The exact bar where price closes above the previous ATH after at least Minimum Gap bars.
Pullback Phase – From breakout candle high → lowest low before price recovers back above the breakout level.
Recovery Phase – From the pullback low → the bar where price first trades back above the original breakout price.
Post-Recovery Run-up Phase – From the recovery point → current price (or highest high achieved so far).
Each completed cycle is stored permanently and used to build a growing statistical database unique to the loaded chart and timeframe.
🎲 Visual Elements
Yellow polyline triangle connecting Previous ATH / Pullback point(start), New ATH Breakout point (end), Recovery point (lowest pullback price), and extends to recent ATH price.
Small green label at the pullback low showing detailed tooltip on hover with all measured values
Clean, color-coded statistics table in the top-right corner (visible only on the last bar)
Powerful Statistics Table – The Heart of the Indicator
The table constantly compares the current situation against all past qualified breakouts and shows details about pullbacks, and runups that help us calculate the probability of next pullback, recovery or runup.
🎲 Settings & Inputs
Minimum Gap
The minimum number of bars that must pass between breaking a new ATH and the previous one.
Higher values = stricter filter → only the strongest, cleanest breakouts are counted.
Lower values = more data points (useful on lower timeframes or very trending instruments).
Recommendation:
Daily charts: 30–50
4H charts: 40–80
1H charts: 100–200
🎲 How to Use It in Practice
This indicator helps investors to understand when to be bullish, bearish or cautious and anticipate regular pullbacks, recovery of markets using quantitative methods.
The indicator does not generate buy/sell signals. However, helps traders set expectations and anticipate market movements based on past behavior.

reversalchartpatternsLibrary "reversalchartpatterns"
User Defined Types and Methods for reversal chart patterns - Double Top, Double Bottom, Triple Top, Triple Bottom, Cup and Handle, Inverted Cup and Handle, Head and Shoulders, Inverse Head and Shoulders
method delete(this)
Deletes the drawing components of ReversalChartPatternDrawing object
Namespace types: ReversalChartPatternDrawing
Parameters:
this (ReversalChartPatternDrawing) : ReversalChartPatternDrawing object
Returns: current ReversalChartPatternDrawing object
method delete(this)
Deletes the drawing components of ReversalChartPattern object. In turn calls the delete of ReversalChartPatternDrawing
Namespace types: ReversalChartPattern
Parameters:
this (ReversalChartPattern) : ReversalChartPattern object
Returns: current ReversalChartPattern object
method lpush(this, obj, limit, deleteOld)
Array push with limited number of items in the array. Old items are deleted when new one comes and exceeds the limit
Namespace types: array
Parameters:
this (array) : array object
obj (ReversalChartPattern) : ReversalChartPattern object which need to be pushed to the array
limit (int) : max items on the array. Default is 10
deleteOld (bool) : If set to true, also deletes the drawing objects. If not, the drawing objects are kept but the pattern object is removed from array. Default is false.
Returns: current ReversalChartPattern object
method draw(this)
Draws the components of ReversalChartPatternDrawing
Namespace types: ReversalChartPatternDrawing
Parameters:
this (ReversalChartPatternDrawing) : ReversalChartPatternDrawing object
Returns: current ReversalChartPatternDrawing object
method draw(this)
Draws the components of ReversalChartPatternDrawing within the ReversalChartPattern object.
Namespace types: ReversalChartPattern
Parameters:
this (ReversalChartPattern) : ReversalChartPattern object
Returns: current ReversalChartPattern object
method scan(zigzag, patterns, errorPercent, shoulderStart, shoulderEnd, allowedPatterns, offset)
Scans zigzag for ReversalChartPattern occurences
Namespace types: zg.Zigzag
Parameters:
zigzag (Zigzag type from Trendoscope/Zigzag/11) : ZigzagTypes.Zigzag object having array of zigzag pivots and other information on each pivots
patterns (array) : Existing patterns array. Used for validating duplicates
errorPercent (float) : Error threshold for considering ratios. Default is 13
shoulderStart (float) : Starting range of shoulder ratio. Used for identifying shoulders, handles and necklines
shoulderEnd (float) : Ending range of shoulder ratio. Used for identifying shoulders, handles and necklines
allowedPatterns (array) : array of int containing allowed pattern types
offset (int) : Offset of zigzag to consider only confirmed pivots
Returns: int pattern type
method createPattern(zigzag, patternType, patternColor, properties, offset)
Create Pattern from ZigzagTypes.Zigzag object
Namespace types: zg.Zigzag
Parameters:
zigzag (Zigzag type from Trendoscope/Zigzag/11) : ZigzagTypes.Zigzag object having array of zigzag pivots and other information on each pivots
patternType (int) : Type of pattern being created. 1 - Double Tap, 2 - Triple Tap, 3 - Cup and Handle, 4 - Head and Shoulders
patternColor (color) : Color in which the patterns are drawn
properties (ReversalChartTradeProperties)
offset (int)
Returns: ReversalChartPattern object created
method getName(this)
get pattern name of ReversalChartPattern object
Namespace types: ReversalChartPattern
Parameters:
this (ReversalChartPattern) : ReversalChartPattern object
Returns: string name of the pattern
method getDescription(this)
get consolidated description of ReversalChartPattern object
Namespace types: ReversalChartPattern
Parameters:
this (ReversalChartPattern) : ReversalChartPattern object
Returns: string consolidated description
method init(this)
initializes the ReversalChartPattern object and creates sub object types
Namespace types: ReversalChartPattern
Parameters:
this (ReversalChartPattern) : ReversalChartPattern object
Returns: ReversalChartPattern current object
ReversalChartPatternDrawing
Type which holds the drawing objects for Reversal Chart Pattern Types
Fields:
patternLines (array type from Trendoscope/Drawing/2) : array of Line objects representing pattern
entry (Line type from Trendoscope/Drawing/2) : Entry price Line
targets (array type from Trendoscope/Drawing/2)
stop (Line type from Trendoscope/Drawing/2) : Stop price Line
patternLabel (Label type from Trendoscope/Drawing/2)
ReversalChartTradeProperties
Trade properties of ReversalChartPattern
Fields:
riskAdjustment (series float) : Risk Adjustment for calculation of stop
useFixedTarget (series bool) : Boolean flag saying use fixed target type wherever possible. If fixed target type is not possible, then risk reward/fib ratios are used for calculation of targets
variableTargetType (series int) : Integer value which defines whether to use fib based targets or risk reward based targets. 1 - Risk Reward, 2 - Fib Ratios
variableTargetRatios (array) : Risk reward or Fib Ratios to be used for calculation of targets when fixed target is not possible or not enabled
entryPivotForWm (series int) : which Pivot should be considered as entry point for WM patterns. 0 refers to the latest breakout pivot where as 5 refers to initial pivot of the pattern
ReversalChartPattern
Reversal Chart Pattern master type which holds the pattern components, drawings and trade details
Fields:
pivots (array type from Trendoscope/Zigzag/11) : Array of Zigzag Pivots forming the pattern
patternType (series int) : Defines the main type of pattern 1 - Double Tap, 1 - Triple Tap, 3 - Cup and Handle, 4 - Head and Shoulders, 5- W/M Patterns, 6 - Full Trend, 7 - Half Trend
patternColor (series color) : Color in which the pattern will be drawn on chart
properties (ReversalChartTradeProperties)
drawing (ReversalChartPatternDrawing) : ReversalChartPatternDrawing object which holds the drawing components
trade (Trade type from Trendoscope/TradeTracker/1) : TradeTracker.Trade object holding trade components

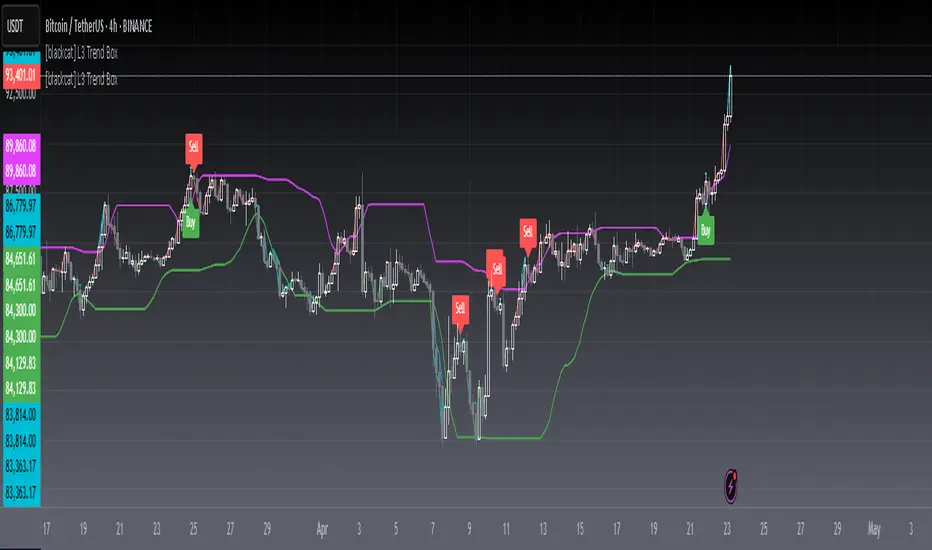
[blackcat] L3 Trend BoxOVERVIEW
The L3 Trend Box indicator is a sophisticated technical analysis tool designed to assist traders in identifying trends and pinpointing potential entry and exit points within the market. By leveraging multiple moving averages and price level analyses, this indicator provides a detailed view of market dynamics. It plots several key lines and labels directly onto the chart, offering clear visual signals for both bullish and bearish scenarios. Its adaptability through customizable parameters makes it suitable for various trading strategies and market conditions 📊✅.
FEATURES
Comprehensive Parameter Customization: Tailor the indicator to match specific trading preferences:
High Length: Defines the period over which the highest prices are considered.
Low Length: Specifies the period for evaluating the lowest prices.
Upper Box Length: Smoothes out the upper boundary of the trend box using a specified period.
Lower Box Length: Smoothes out the lower boundary of the trend box similarly.
Trend Line Length: Determines the period for calculating the overall trend line.
Fast EMA Length: Sets the period for the fast-moving exponential moving average (EMA), crucial for capturing short-term movements.
MA15 EMA Length: Configures the period for the medium-term moving average (MA15 EMA) to provide a balanced perspective.
Short Spirit Length: Influences how quickly the indicator responds to recent price changes.
Golden EMA Length: Fine-tunes the long-term EMA for stability and reliability.
Buy Price Length: Establishes the lookback period for determining optimal buy prices.
Var1 Length & Var2 Length: Adjusts periods for variance calculations, enhancing the accuracy of trend detection.
Detailed Chart Plots:
Upper Box Top: A fuchsia-colored line representing the smoothed highest prices, marking resistance levels.
Lower Box Bottom: A green-colored line showing the smoothed lowest prices, highlighting support zones.
MA15 Up/Down: Dynamic red and green lines illustrating the directionality of the 15-period EMA, helping gauge momentum shifts.
Conditional Plots: Multiple lines based on intricate price actions and computed values, such as closing below the lower box while also closing at or above/below the opening price, ensuring nuanced insights into market behavior.
Buy/Sell Labels: Clearly marked 'Buy' and 'Sell' labels positioned strategically on the chart, facilitating quick decision-making without missing critical signals 🎯.
Alert System: Automatically generates alerts based on predefined buy and sell conditions, enabling timely responses to market changes 🛎️.
HOW TO USE
Adding the Indicator: Start by adding the L3 Trend Box to your TradingView chart via the indicators menu.
Parameter Configuration: Adjust each parameter according to your trading style and market volatility. For instance, increasing the High Length can make the indicator less sensitive to minor fluctuations but more responsive to significant trends.
Monitoring Signals: Keep an eye on the plotted lines and labels. Pay special attention to the crossover events between the fast EMA and the lower box bottom, as these often signify strong buy signals.
Setting Alerts: Configure alerts based on the buy/sell conditions provided by the indicator. This ensures you never miss an opportunity due to inattention.
Combining Strategies: While powerful on its own, combining this indicator with others like RSI or Bollinger Bands can enhance its predictive power and reduce false positives.
LIMITATIONS
Market Volatility: In extremely volatile or sideways-trending markets, the indicator might produce false signals. Always verify with additional confirmations.
Asset-Specific Performance: Different assets and timeframes will yield varying results; thorough backtesting across diverse instruments is recommended.
Over-Reliance Risk: Avoid relying solely on this indicator. Integrate it into a broader analytical framework that includes fundamental analysis and other technical indicators.
NOTES
Data Sufficiency: Ensure ample historical data is available for precise computations. Lack of data can skew results and lead to inaccurate signals.
Demo Testing: Before deploying the indicator in real trades, rigorously test it on demo accounts under varied market conditions to understand its strengths and weaknesses.
Customization Flexibility: Feel free to tweak the parameters continuously until they align perfectly with your unique trading approach and risk tolerance.
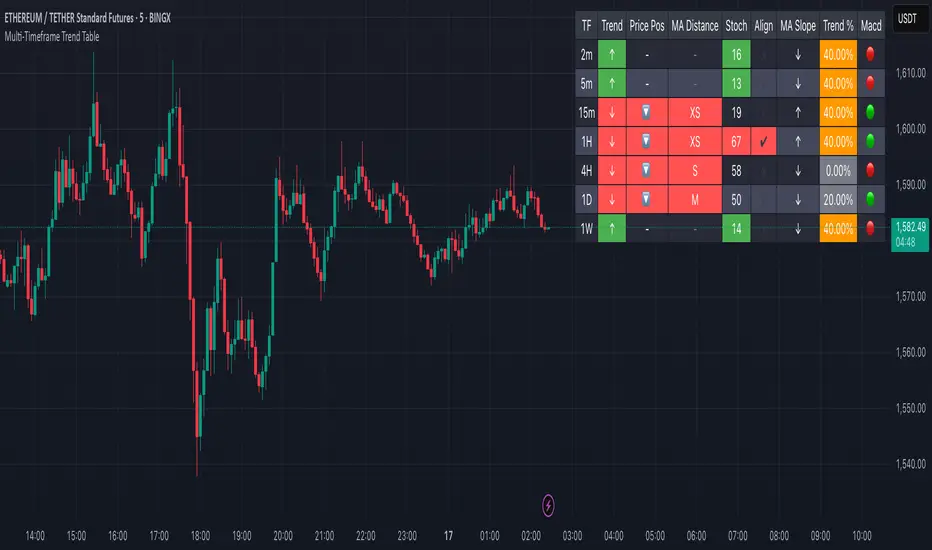
Multi-Timeframe Trend Table📊 Multi-Timeframe Trend Table
Overview
This powerful trend-tracking tool gives you a real-time snapshot of market trends across multiple timeframes — all in one compact and color-coded table. Designed for traders who want fast, clean, and multi-timeframe awareness at a glance.
⸻
✅ Features
• 7 Key Timeframes Monitored:
2min · 5min · 15min · 1h · 4h · 1d · 1w
• Trend Detection Based on EMAs
Uses a fast (default 20) and slow (default 200) EMA to determine if a timeframe is trending:
• 🟢 Uptrend: Fast EMA is above slow EMA
• 🔴 Downtrend: Slow EMA is above fast EMA
• 🟠 Sideways: EMAs are close (configurable threshold)
• Raw EMA Distance
See the actual difference between fast and slow EMAs for each timeframe — great for gauging trend strength.
• EMA Slope Analysis
A unique “Slope” column tells you the current behavior of EMAs:
• 📈 Pointing Up
• 📉 Pointing Down
• 🔄 Crossing Up/Down
• ➡️ Lateral
• Instant Alerts
Alerts fire the moment a trend flips on any timeframe, keeping you ahead of market shifts.
• Optional Chart EMAs
Toggle on/off the fast and slow EMAs on your active chart for extra clarity.
⸻
🧠 Use Case Examples
• Confirm trades with alignment across multiple timeframes
• Spot early trend reversals with crossing behavior
• Add a higher-timeframe filter to your scalping system
• Monitor key EMAs without changing your chart timeframe
⸻
⚙️ Configuration
• EMA lengths and sideways threshold are fully adjustable
• Enable/disable chart overlays for EMAs
• Table dynamically updates in real time
⸻
💡 Pro Tip: Use this indicator alongside your entry strategy to only trade in the direction of the dominant trends.
⸻
projectiontrackingLibrary "projectiontracking"
Library contains few data structures and methods for tracking harmonic patterns and projections via pinescript.
method erase(this)
erase Harmonic Projection Drawing
Namespace types: HarmonicProjectionDrawing
Parameters:
this (HarmonicProjectionDrawing) : HarmonicProjectionDrawing object
Returns: void
method erase(this)
erase HarmonicProjection
Namespace types: HarmonicProjection
Parameters:
this (HarmonicProjection) : HarmonicProjection object
Returns: void
method draw(this)
draw HarmonicProjection
Namespace types: HarmonicProjection
Parameters:
this (HarmonicProjection) : HarmonicProjection object
Returns: HarmonicProjection object
method getRanges(projectionPrzRanges, dir)
Convert PRZRange to Projection ranges
Namespace types: array
Parameters:
projectionPrzRanges (array type from Trendoscope/HarmonicMapLib/1) : array of PrzRange objects
dir (int) : Projection direction
Returns: array
ProjectionRange
Harmonic Projection Range
Fields:
patterns (array) : array of pattern names
start (series float) : Start Range
end (series float) : End Range
status (series int) : Projection Status
ProjectionProperties
Harmonic Projection Properties
Fields:
fillMajorTriangles (series bool) : Use linefill for major triangles
fillMinorTriangles (series bool) : Use linefill for minor triangles
majorFillTransparency (series int) : transparency of major triangles
minorFillTransparency (series int) : transparency of minor triangles
showXABC (series bool) : Show XABC labels
lblSizePivots (series string) : Pivot labels size
showRatios (series bool) : Show ratio labels
useLogScaleForScan (series bool) : Log scale is used for scanning projections
activateOnB (series bool) : Activate projections on reaching B
activationRatio (series float) : Use activation ratio for activation
confirmationRatio (series float) : Confirmation ratio of projection before removal
HarmonicProjectionDrawing
Harmonic Projection Projection drawing objects
Fields:
xa (series line) : line xa
ab (series line) : line ab
bc (series line) : line bc
xb (series line) : line xb
ac (series line) : line ac
x (series label) : Pivot label x
a (series label) : Pivot label a
b (series label) : Pivot label b
c (series label) : Pivot label c
xabRatio (series label) : Label XAB Ratio
abcRatio (series label) : Label ABC Ratio
HarmonicProjection
Harmonic Projection Projection object
Fields:
patternId (series int) : id of the pattern
dir (series int) : projection direction
x (chart.point) : Pivot X
a (chart.point) : Pivot A
b (chart.point) : Pivot B
c (chart.point) : Pivot C
patternColor (series color) : Color in which pattern is displayed
przRange (PrzRange type from Trendoscope/HarmonicMapLib/1) : PRZ Range
activationPrice (series float) : Projection activation price
reversalPrice (series float) : Projection reversal price
status (series int) : Projection status
properties (ProjectionProperties) : Projection properties
projectionRanges (array) : array of Projection Ranges
initialD (series float) : Initial D pivot
d (chart.point) : Pivot D
drawing (HarmonicProjectionDrawing) : HarmonicProjectionDrawing Object

ACCURATE TREND LEVELS - TABLE PSv6.1Accurate Trend Level Indicator
Description:
The "Accurate Trend Level" indicator is a powerful tool designed to identify market trends and potential reversals with precision. Built on the concept (foundation) of Swing Highs and Swing Lows, this indicator easily detects uptrends and downtrends, providing traders with clear signals for trend continuation or reversal. Whether you are a swing trader or a trend follower, this indicator offers customization options to suit your trading style.
Key Features:
Trend Identification: Accurately identifies uptrends and downtrends based on Swing High and Swing Low points. This indicator provides signals for Up after Down and Down after Up.
Percentage Adjustment: Includes a customizable percentage factor that reduces false signals and helps identify accurate and strong trends.
Trend Table: Displays essential data in a table, such as:
Last and running Trend Position (Uptrend/Downtrend)
Date and Time of the last and running trend change
Reversal Level (price level for the next potential trend change)
Max. Run-up feature is also provided, which shows how much the market has moved according to the trend.
How It Works:
The indicator analyzes price action using Swing Highs and Lows to determine the current trend direction. A user-defined percentage threshold filters out minor fluctuations, ensuring only significant trends are highlighted. The table provides a quick snapshot of the latest trend data, while reversal levels help traders anticipate the next move.

PitchforkLibrary "Pitchfork"
Pitchfork class
method tostring(this)
Converts PitchforkTypes/Fork object to string representation
Namespace types: Fork
Parameters:
this (Fork) : PitchforkTypes/Fork object
Returns: string representation of PitchforkTypes/Fork
method tostring(this)
Converts Array of PitchforkTypes/Fork object to string representation
Namespace types: array
Parameters:
this (array) : Array of PitchforkTypes/Fork object
Returns: string representation of PitchforkTypes/Fork array
method tostring(this, sortKeys, sortOrder)
Converts PitchforkTypes/PitchforkProperties object to string representation
Namespace types: PitchforkProperties
Parameters:
this (PitchforkProperties) : PitchforkTypes/PitchforkProperties object
sortKeys (bool) : If set to true, string output is sorted by keys.
sortOrder (int) : Applicable only if sortKeys is set to true. Positive number will sort them in ascending order whreas negative numer will sort them in descending order. Passing 0 will not sort the keys
Returns: string representation of PitchforkTypes/PitchforkProperties
method tostring(this, sortKeys, sortOrder)
Converts PitchforkTypes/PitchforkDrawingProperties object to string representation
Namespace types: PitchforkDrawingProperties
Parameters:
this (PitchforkDrawingProperties) : PitchforkTypes/PitchforkDrawingProperties object
sortKeys (bool) : If set to true, string output is sorted by keys.
sortOrder (int) : Applicable only if sortKeys is set to true. Positive number will sort them in ascending order whreas negative numer will sort them in descending order. Passing 0 will not sort the keys
Returns: string representation of PitchforkTypes/PitchforkDrawingProperties
method tostring(this, sortKeys, sortOrder)
Converts PitchforkTypes/Pitchfork object to string representation
Namespace types: Pitchfork
Parameters:
this (Pitchfork) : PitchforkTypes/Pitchfork object
sortKeys (bool) : If set to true, string output is sorted by keys.
sortOrder (int) : Applicable only if sortKeys is set to true. Positive number will sort them in ascending order whreas negative numer will sort them in descending order. Passing 0 will not sort the keys
Returns: string representation of PitchforkTypes/Pitchfork
method createDrawing(this)
Creates PitchforkTypes/PitchforkDrawing from PitchforkTypes/Pitchfork object
Namespace types: Pitchfork
Parameters:
this (Pitchfork) : PitchforkTypes/Pitchfork object
Returns: PitchforkTypes/PitchforkDrawing object created
method createDrawing(this)
Creates PitchforkTypes/PitchforkDrawing array from PitchforkTypes/Pitchfork array of objects
Namespace types: array
Parameters:
this (array) : array of PitchforkTypes/Pitchfork object
Returns: array of PitchforkTypes/PitchforkDrawing object created
method draw(this)
draws from PitchforkTypes/PitchforkDrawing object
Namespace types: PitchforkDrawing
Parameters:
this (PitchforkDrawing) : PitchforkTypes/PitchforkDrawing object
Returns: PitchforkTypes/PitchforkDrawing object drawn
method delete(this)
deletes PitchforkTypes/PitchforkDrawing object
Namespace types: PitchforkDrawing
Parameters:
this (PitchforkDrawing) : PitchforkTypes/PitchforkDrawing object
Returns: PitchforkTypes/PitchforkDrawing object deleted
method delete(this)
deletes underlying drawing of PitchforkTypes/Pitchfork object
Namespace types: Pitchfork
Parameters:
this (Pitchfork) : PitchforkTypes/Pitchfork object
Returns: PitchforkTypes/Pitchfork object deleted
method delete(this)
deletes array of PitchforkTypes/PitchforkDrawing objects
Namespace types: array
Parameters:
this (array) : Array of PitchforkTypes/PitchforkDrawing object
Returns: Array of PitchforkTypes/PitchforkDrawing object deleted
method delete(this)
deletes underlying drawing in array of PitchforkTypes/Pitchfork objects
Namespace types: array
Parameters:
this (array) : Array of PitchforkTypes/Pitchfork object
Returns: Array of PitchforkTypes/Pitchfork object deleted
method clear(this)
deletes array of PitchforkTypes/PitchforkDrawing objects and clears the array
Namespace types: array
Parameters:
this (array) : Array of PitchforkTypes/PitchforkDrawing object
Returns: void
method clear(this)
deletes array of PitchforkTypes/Pitchfork objects and clears the array
Namespace types: array
Parameters:
this (array) : Array of Pitchfork/Pitchfork object
Returns: void
PitchforkDrawingProperties
Pitchfork Drawing Properties object
Fields:
extend (series bool) : If set to true, forks are extended towards right. Default is true
fill (series bool) : Fill forklines with transparent color. Default is true
fillTransparency (series int) : Transparency at which fills are made. Only considered when fill is set. Default is 80
forceCommonColor (series bool) : Force use of common color for forks and fills. Default is false
commonColor (series color) : common fill color. Used only if ratio specific fill colors are not available or if forceCommonColor is set to true.
PitchforkDrawing
Pitchfork drawing components
Fields:
medianLine (Line type from Trendoscope/Drawing/2) : Median line of the pitchfork
baseLine (Line type from Trendoscope/Drawing/2) : Base line of the pitchfork
forkLines (array type from Trendoscope/Drawing/2) : fork lines of the pitchfork
linefills (array type from Trendoscope/Drawing/2) : Linefills between forks
Fork
Fork object property
Fields:
ratio (series float) : Fork ratio
forkColor (series color) : color of fork. Default is blue
include (series bool) : flag to include the fork in drawing. Default is true
PitchforkProperties
Pitchfork Properties
Fields:
forks (array) : Array of Fork objects
type (series string) : Pitchfork type. Supported values are "regular", "schiff", "mschiff", Default is regular
inside (series bool) : Flag to identify if to draw inside fork. If set to true, inside fork will be drawn
Pitchfork
Pitchfork object
Fields:
a (chart.point) : Pivot Point A of pitchfork
b (chart.point) : Pivot Point B of pitchfork
c (chart.point) : Pivot Point C of pitchfork
properties (PitchforkProperties) : PitchforkProperties object which determines type and composition of pitchfork
dProperties (PitchforkDrawingProperties) : Drawing properties for pitchfork
lProperties (LineProperties type from Trendoscope/Drawing/2) : Common line properties for Pitchfork lines
drawing (PitchforkDrawing) : PitchforkDrawing object