Oscillator Volume Profile [Trendoscope®]The Oscillator Volume Profile indicator is designed to construct a volume profile based on predefined oscillator levels. It integrates volume data with oscillator readings to offer a unique perspective on market dynamics.
🎲 Selectable Oscillators:
Users can select from an array of oscillator options for the basis of the volume profile, including:
Relative Strength Index (RSI)
Chande Momentum Oscillator (CMO)
Center of Gravity (COG)
Money Flow Index (MFI)
Rate of Change (ROC)
Commodity Channel Index (CCI)
Stochastic Oscillator (Stoch)
True Strength Index (TSI)
Williams %R (WPR)
The length parameters - Length, Fast Length, Slow Length allows users to define the period over which the chosen oscillator is calculated, tailoring the sensitivity of the indicator to their trading strategy.
🎲 Dynamic Overbought/Oversold Ranges:
This indicator enhances traditional concepts by introducing dynamic overbought and oversold levels. These adaptable thresholds are calculated using various methods, including:
🎯 Highest/Lowest Range Method : This method establishes the range based on the highest and lowest values of the oscillator within the last N bars.
🎯 Moving Average Range Method : The range is derived from a moving average of the oscillator, providing a smoothed threshold that reflects more recent market conditions.
In addition to these methods, the indicator incorporates a unique 'Sticky Border' feature:
🎯 Sticky Border: With this option enabled, the dynamic ranges maintain their levels until the oscillator breaks out of the range. Once a breakout occurs, the levels are recalculated and updated. This mechanism ensures that the borders remain consistent and relevant, only adjusting to significant market movements that warrant a recalculation.
Users can select their preferred method for determining dynamic ranges, allowing for a customized approach that aligns with their analysis and trading strategy. The sticky border feature further refines this functionality, offering continuity until a decisive market move occurs.
🎲 Volume Profile Calculation Parameters:
🎯 Trend Filter: The indicator provides a versatile trend filter with four selectable options:
Uptrend: The volume profile is calculated when the oscillator indicates an uptrend.
Downtrend: The volume profile is calculated when the oscillator indicates a downtrend.
Any: The volume profile is calculated regardless of the trend.
External: Users can input values from an external indicator. The volume profile is then calculated only when the external indicator's value is non-zero, integrating external analysis into the volume profile construction.
🎯 Precision: Users have the option to define the precision for calculating the volume profile, which is crucial due to the varying scales of different oscillators (e.g., some oscillators range from 0 to 100, while others from -1 to 1). Selecting an appropriate precision ensures that the volume profile is accurately aligned with the minimal price range significant to the chosen oscillator. This setting requires user intervention for optimal configuration, as automatic calculation is not feasible due to the diverse nature of oscillator ranges.
🎯 Number of Bars: Users can select a specific number of bars for volume profile calculation, or opt to include all available historical bars for a comprehensive profile.
🎲 Selecting the right precision:
Users must select the right precision based on their choice of indicator. For example, RSI values range from 0-100. Hence, the default precision of 1 work fine on RSI as the volume profiles are plotted from 0 to 100 at the interval of 0.1
But, the default precision of 1 will not be ok on TSI because TSI values range from -1 to 1. Hence, using 1 as precision will result in very less volume profile lines as shown below.
Due to this, it is necessary to increase the precision for oscillators such as TSI where the range between highest and lowest value is far less. Once we set the precision to 2, we can see more appropriate volume profile division.
🎲 Note of thanks:
This publication uses polyline feature for drawing volume profiles. The advantage of using polyline is that we can overcome max 500 lines issue that we face by using the regular line objects. More details of polyline can be found in the tradingview blog post
Further, using polyline for display of volume profiles is inspired by the publications of fikira and KioseffTrading
Cari dalam skrip untuk "trend"

Volume Spike Analysis [Trendoscope]The Volume Spike Analysis is designed to detect volume spikes in a trading instrument's data. Rather than relying on the traditional method of comparing volume to its moving average, this indicator employs a distinctive approach to ensure accuracy.
Methodology
Historical Volume Comparison: The indicator first assesses the current bar's volume, say 100k, and looks back historically to determine the last instance when the volume was equal to or exceeded this level.
High Volume Bar Gap Calculation: The intervals or gaps between high volume bars are recorded. These gaps help in determining how common or rare a particular volume spike is.
Spike Magnitude Determination: Here, the extent of the volume spike is gauged in relation to either the median, lowest, or average volume of the intervening bars. The reference metric (median, lowest, or average) can be chosen by the user through the "Volume Spike Reference" input parameter.
Spike Percentile Analysis: The calculated spike magnitude (as a percentage of the reference volume) is cataloged. This collection aids in understanding the relative intensity of the current volume spike when compared to previous spikes.
Threshold Comparisons: The indicator then compares the calculated "High Volume Distance Percentile" to the "Last High Volume Distance Percentile" and the "Volume Spike Percentile" to the "Volume Spike Threshold". If these values surpass the preset thresholds, the current bar is flagged as a high volume or volume spike bar.
Visual Components
Bar Highlighting : High volume or volume spike bars are accentuated with bright colors for easy identification. All other bars have increased transparency to reduce visual clutter.
Distance from the High Volume Bar: Indication of the number of bars since the last high volume occurrence and its respective percentile.
Comparative Factors: A factor representing the magnitude by which the current volume surpasses the lowest, median, and average volumes.
Lowest, Median and Average Volumes: The lowest and median volumes are indicated by tooltips on lines marking the respective bars. The average volume is depicted as a dotted horizontal line, with a triangle marker tooltip revealing its value.
This indicator offers a nuanced analysis of volume spikes, aiding traders in making more informed decisions.

Angled Volume Profile [Trendoscope]Volume profile is useful tool to understand the demand and supply zones on horizontal level. But, what if you want to measure the volume levels over trend line? In trending markets, the feature to measure volume over angled levels can be very useful for traders who use these measures. Here is an attempt to provide such tool.
🎲 How to use
🎯 Interactive input for selecting starting point and angle.
Upon loading the script, you will be prompted to select
Start time and price - this is a point which you can select by moving the maroon highlighted label.
End price - though this is shown as maroon bullet, this is price only input. Hence, when you click on the bullet, a horizontal line will appear. Users can move the line to use different End price.
Start and End price are used for identifying the angle at which volume profile need to be calculated. Whereas start time is used as starting time of the volume profile. Last bar of the chart is considered as ending bar.
🎯 Other settings.
From settings, users can select the colour of volume profile and style. Step multiplier defines the distance at which the profile lines needs to be drawn. Higher multiplier leads to less dense profile lines whereas lower multiplier leads to higher density of profile lines.
🎲 Limitations
🎯 Max 500 lines
Pinescript only allows max 500 lines on an indicator. Due to this, if we set very low multiplier - this can lead to more than 500 profile lines. Due to this some lines can get removed.
On the contrary, if multiplier is too high, then you will see very few lines which may not be meaningful.
Hence, it is important to select optimal multiplier based on your timeframe
🎯 No updates on new bar
Since the profile can spawn many bars, it is not possible to recalculate the whole volume profile when price creates new bars. Hence, there will not be visual update when new bars are created. But, to update the chart, users only need to make another movement of Start or ending point on interactive input.

Harmonic Patterns Based Trend FollowerEarlier this week, published an idea on how harmonic patterns can be used for trend following. This script is an attempt to implement the same.
🎲 Process
🎯 Derive Zigzag and scan harmonic patterns for last 5 confirmed pivots
🎯 If a pattern is found, highest point of pattern will become the bullish zone and lower point of the pattern will become bearish zone.
🎯 Since it is trend following method, when price reaches bullish zone, then the trend is considered as bullish and when price reaches bearish zone, the trend is considered as bearish.
🎯 If price does not touch both regions, then trend remains unchanged.
🎯 Bullish and bearish zone will change as and when new patterns are formed.
🎲 Note
Patterns are not created on latest pivot as last pivot will be unconfirmed and moving. Due to this, patterns appear after certain delay - patterns will not be real time. But, this is expected and does not impact the overall process.
When new pattern formed
When price breaks over the zones
🎲 Output
🎯 Patterns formed are drawn in blue coloured lines. Due to pine limitation of max 500 lines, older patterns automatically get deleted when new ones come.
🎯 Bullish Zone and Bearish Zone are plotted in green and red colours and the zone will change whenever new pattern comes along.
🎯 Bar colors are changed according to calculated trend. Trend value can be 1 or -1 based on the current trend. You can also find the value in data window.
🎯 For simplicity purpose, input option for selection of specific patterns are not provided and also pattern names are not displayed on the chart.
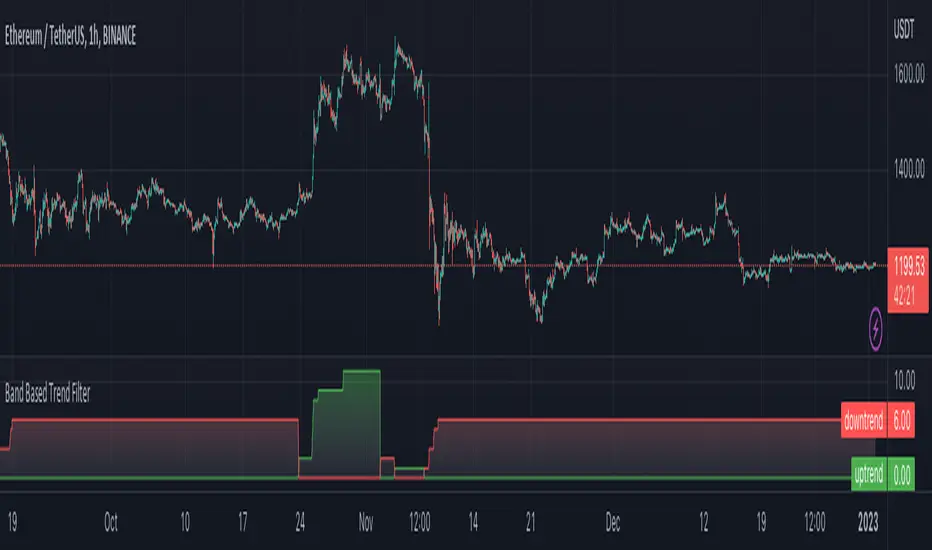
Band Based Trend FilterSimilar to RelativeBandwidthFilter , this script is also a simple trend filter which can be used to define your trading zone.
🎲 Concept
On contrary to reversal mindset, we define trend when price hits either side of the band. If close price hits upper band then it is considered as bullish and if close price hits lower band, then it is considered bearish. Further, trend strength is measured in terms of how many times the price hits one side of the band without hitting other side. Hit is counted only if price has touched middle line in between the touches. This way price walks on the bands are considered as just one hit.
🎲 Settings
Settings are minimal and details can be found in the tooltips against each parameters
🎲 Usage
This can be used with your own strategy to filter your trading/non-trading zones based on trend . Script plots a variable called "Trend" - which is not shown on chart pane. But, it is available in the data window. This can be used in another script as external input and apply logic.
Trend values can be
1 : Allow only Long
-1 : Allow only short
0 : Do not allow any trades
Extreme Trend Reversal Points [HeWhoMustNotBeNamed]Using moving average crossover for identifying the change in trend is very common. However, this method can give lots of false signals during the ranging markets. In this algorithm, we try to find the extreme trend by looking at fully aligned multi-level moving averages and only look at moving average crossover when market is in the extreme trend - either bullish or bearish. These points can mean long term downtrend or can also cause a small pullback before trend continuation. In this discussion, we will also check how to handle different scenarios.
🎲 Components
🎯 Recursive Multi Level Moving Averages
Multi level moving average here refers to applying moving average on top of base moving average on multiple levels. For example,
Level 1 SMA = SMA(source, length)
Level 2 SMA = SMA(Level 1 SMA, length)
Level 3 SMA = SMA(Level 2 SMA, length)
..
..
..
Level n SMA = SMA(Level (n-1) SMA, length)
In this script, user can select how many levels of moving averages need to be calculated. This is achieved through " recursive moving average " algorithm. Requirement for building such algorithm was initially raised by @loxx
While I was able to develop them in minimal code with the help of some of the existing libraries built on arrays and matrix , I also thought why not extend this to find something interesting.
Note that since we are using variable levels - we will not be able to plot all the levels of moving average. (This is because plotting cannot be done in the loop). Hence, we are using lines to display the latest moving average levels in front of the last candle. Lines are color coded in such a way that least numbered levels are greener and higher levels are redder.
🎯 Finding the trend and range
Strength of fully aligned moving average is calculated based on position of each level with respect to other levels.
For example, in a complete uptrend, we can find
source > L(1)MA > L(2)MA > L(3)MA ...... > L(n-1)MA > L(n)MA
Similarly in a complete downtrend, we can find
source < L(1)MA < L(2)MA < L(3)MA ...... < L(n-1)MA < L(n)MA
Hence, the strength of trend here is calculated based on relative positions of each levels. Due to this, value of strength can range from 0 to Level*(Level-1)/2
0 represents the complete downtrend
Level*(Level-1)/2 represents the complete uptrend.
Range and Extreme Range are calculated based on the percentile from median. The brackets are defined as per input parameters - Range Percentile and Extreme Range Percentile by using Percentile History as reference length.
Moving average plot is color coded to display the trend strength.
Green - Extreme Bullish
Lime - Bullish
Silver - range
Orange - Bearish
Red - Extreme Bearish
🎯 Finding the trend reversal
Possible trend reversals are when price crosses the moving average while in complete trend with all the moving averages fully aligned. Triangle marks are placed in such locations which can help observe the probable trend reversal points. But, there are possibilities of trend overriding these levels. An example of such thing, we can see here:
In order to overcome this problem, we can employ few techniques.
1. After the signal, wait for trend reversal (moving average plot color to turn silver) before placing your order.
2. Place stop orders on immediate pivot levels or support resistance points instead of opening market order. This way, we can also place an order in the direction of trend. Whichever side the price breaks out, will be the direction to trade.
3. Look for other confirmations such as extremely bullish and bearish candles before placing the orders.
🎯 An example of using stop orders
Let us take this scenario where there is a signal on possible reversal from complete uptrend.
Create a box joining high and low pivots at reasonable distance. You can also chose to add 1 ATR additional distance from pivots.
Use the top of the box as stop-entry for long and bottom as stop-entry for short. The other ends of the box can become stop-losses for each side.
After few bars, we can see that few more signals are plotted but, the price is still within the box. There are some candles which touched the top of the box. But, the candlestick patterns did not represent bullishness on those instances. If you have placed stop orders, these orders would have already filled in. In that case, just wait for position to hit either stop or target.
For bullish side, targets can be placed at certain risk reward levels. In this case, we just use 1:1 for bullish (trend side) and 1:1.5 for bearish side (reversal side)
In this case, price hit the target without any issue:
Wait for next reversal signal to appear before placing another order :)

Multi-ZigZag Multi-Oscillator Trend DetectorThis table is intended to give you snapshot of how price and oscillators are moving along with zigzag pivots.
This is done in the same lines of Zigzag-Trend-Divergence-Detector
But, here are the differences
Table shows multiple oscillator movements at a same time instead of one selected oscillator
Divergence is not calculated and also supertrend based trend. Trend can be calculated based on zigzag movements. However, lets keep this for future enhancements.
This system also uses multiple zigzags instead of just one.
⬜ Process
▶ Derive multiple zigzags - Code is taken from Multi-ZigZag
▶ Along with zigzags - also calculate different oscillators and attach it to zigzag pivot.
▶ Calculate directions of zigzag pivots and corresponding oscillators.
▶ Plot everything in the table on last bar.
⬜ Table components
Table contains following data:
Directional legends are:
⇈ - Higher High (Green)
⇊ - Lower Low (Red)
⭡- Lower High (Orange)
⭣ - Higher Low (Lime)
⬜ Input Parameters
▶ Source : Default is close. If Unchecked - uses high/low data for calculating pivots. Can also use external input such as OBV
▶ Stats : Gives option to select the depth of output (History) and also lets you chose text size and table position.
▶ Oscillators : Oscillator length is derived by multiplying multiplier to zigzag length. For example, for zigzag 5, with 4 as multiplier, all oscillators are calculated with length 20. But, same for zigzag 8 will be 32 and so on.
▶ Available oscillators :
CCI - Commodity Channel Index
CMO - Chande Momentum Oscillator
COG - Center Of Gravity
MFI - Money Flow Index (Shows only if volume is present)
MOM - Momentum oscillator
ROC - Rate Of Change
RSI - Relative Strength Index
TSI - Total Strength Index
WPR - William Percent R
BB - Bollinger Percent B
KC - Keltner Channel Percent K
DC - Donchian Channel Percent D
ADC - Adoptive Donchian Channel Percent D ( Adoptive-Donchian-Channel )
⬜ Challenges
There are 12 oscillators and each zigzag has different length. Which means, there are 48 combinations of the ocillators.
First challenge was generating these values without creating lots of static initialization. Also, note, if the functions are not called on each bar, then they will not yield correct result. This is achieved through initializer function which runs on every bar and stores the oscillator values in an array which emulates multi dimensional array oscillator X zigzag length.
Next challenge was getting these values within function when we need it. While doing so I realized that values stored in array also have historical series and calling array.get will actully get you the entire series and not just the value. This is an important takeaway for me and this can be used for further complex implementations.
Thanks to @LonesomeTheBlue and @LucF for some timely suggestions and interesting technical discussions :)

Zigzag Trend/Divergence DetectorPullbacks are always hardest part of the trade and when it happen, we struggle to make decision on whether to continue the trade and wait for recovery or cut losses. Similarly, when an instrument is trending well, it is often difficult decision to make if we want to take some profit off the table. This indicator is aimed to make these decisions easier by providing a combined opinion of sentiment based on trend and possible divergence.
⬜ Process
▶ Use any indicator to find trend bias. Here we are using simple supertrend
▶ Use any oscillator. I have added few inbuilt oscillators as option. Default used is RSI.
▶ Find divergence by using zigzag to detect pivot high/low of price and observing indicator movement difference between subsequent pivots in the same direction.
▶ Combine divregence type, divergence bias and trend bias to derive overall sentiment.
Complete details of all the possible combinations are present here along with table legend
⬜Chart Legend
C - Continuation
D - Divergence
H - Hidden Divergence
I - Indeterminate
⬜ Settings
▶ Zigzag parameters : These let you chose zigzag properties. If you check "Use confirmed pivots", then unconfirmed pivot will be ignored in the table and in the chart
▶ Oscillator parameters : Lets you select different oscillators and settings. Available oscillators involve
CCI - Commodity Channel Index
CMO - Chande Momentum Oscillator
COG - Center Of Gravity
DMI - Directional Movement Index (Only ADX is used here)
MACD - Moving average convergence divergence (Can chose either histogram or MACD line)
MFI - Money Flow Index
MOM - Momentum oscillator
ROC - Rate Of Change
RSI - Relative Strength Index
TSI - Total Strength Index
WPR - William Percent R
BB - Bollinger Percent B
KC - Keltner Channel Percent K
DC - Donchian Channel Percent D
ADC - Adoptive Donchian Channel Percent D ( Adoptive-Donchian-Channel )
▶ Trend bias : Supertrend is used for trend bias. Coloring option color candles in the direction of supertrend. More option for trend bias can be added in future.
▶ Stats : Enables you to display history in tabular format.
Overview of settings present here:
⬜ Notes
Trend detection is done only with respect to previous pivot in the same direction. Hence, if chart has too many zigzags in short period, try increasing the zigzag length or chart timeframe. Similarly, if there is a steep trend, use lower timeframe charts to dig further.
Oscillators does not always make pivots at same bar as price. Due to this some the divergence calculation may not be correct. Hence visual inspection is always recommended.
⬜ Possible future enhancements
More options for trend bias
Enhance divergence calculation. Possible options include using oscillator based zigzag as primary or using close prices based zigzag instead of high/low.
Multi level zigzag option - Can be messy to include more than one zigzag. Option can be added to chose either Level1 or Level2 zigzags.
Alerts - Alerts can only be added for confirmed pivots - otherwise it will generate too many unwanted alerts. Will think about it :)
If I get time, I will try to make a video.

Breakout Trend Trading Strategy - V2This is an alternate version of Breakout Trend Trading Strategy - V1
Only difference is, this strategy places stop orders based on calculated targets whereas V1 waits for price to close target levels and then places market orders. Hence, you will receive the target prices before trade executes in strategy.
Parameters are same as that of Breakout Trend Trading Strategy - V1
There is one additional parameter on Trade Type - which permits user to allow only breakout, pullback or reverse trading or combination of all.
Backtesting parameters remain same :
Capital and position sizing : Capital and position sizing parameters are set to test investing 2000 wholly on certain stock without compounding.
Initial Capital : 2000
Order Size : 100% of equity
Pyramiding : 1
Test cases remain same :
Positive : AAPL , AMZN , TSLA , RUN, VRT , ASX:APT
Negative Test Cases: WPL , WHC , NHC , WOW, COL, NAB (All ASX stocks)
Special test case: WDI
Negative test cases still show losses in back-testing. I have attempted including many conditions to eliminate or reduce the loss. But, further efforts has resulted in reduction in profits in positive cases as well. Still experimenting. Will update whenever I find improvements. Comments and suggestions welcome :)

Trend Confirmation Dow TheoryTrend Confirmation as per Dow Theory
Summary of Logic:
✅ Bullish Trend:
Setup Bar: High > Previous High AND Low ≥ Previous Low
Confirmation Bar: High > Highest High of last 3 candles, Low ≥ Setup Bar Low
Trend Continues Until: Latest candle breaks 2nd last candle’s low → then trend becomes Bearish
🔻 Bearish Trend:
Setup Bar: Low < Previous Low AND High ≤ Previous High
Confirmation Bar: Low < Lowest Low of last 3 candles, High ≤ Setup Bar High
Trend Continues Until: Latest candle breaks 2nd last candle’s high → then trend becomes Bullish
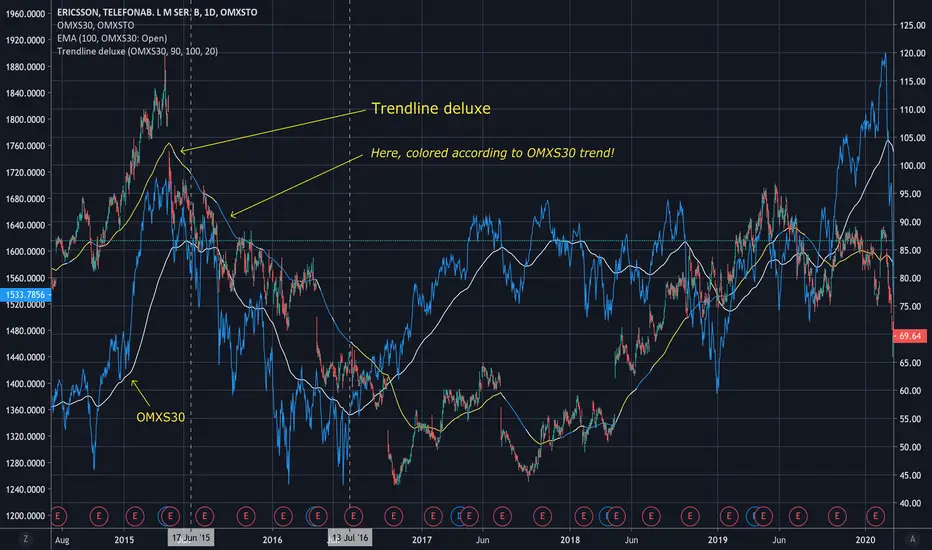
Trendline deluxeTrendline deluxe
As someone said:
"The best trend indicator is when you print the chart, put it on the wall
and take a few steps back. If you now can identify the trend you're done!"
This is an attempt of doing the same thing...
I find it handy to switch the color of the trendline depending on the where
the Trend is going. Especially when zooming in on the chart, the color tells
you what the overall Trend is.
Trendline deluxe comes with an extra twist in that it can be colored according
to your Stock index of choice, but still be plotted according to the Stock at hand.
Trend Conviction (28 Pairs)Trend Conviction is a directional confidence oscillator designed to highlight when price movement is behaving like a “clean” trend versus a choppy or contested move. It evaluates recent progression in the dominant direction and reduces the reading when price shows meaningful counter-direction pressure, helping you distinguish reliable directional conditions from unstable ones. Use it to compare trend quality over time, spot transitions from trend to range, and confirm whether momentum is supported or being resisted.
This version plots Trend Conviction across the full set of 28 major FX pairs in a single panel, with each pair shown as its own coloured line with right-edge labels for quick identification.

Trend Quality Score (Options-Friendly)Trend Quality Score for options entry that signals with background coloring for good movement or chop, to avoid theta burn. Toggle for conservative, balanced or aggressive with triggers.

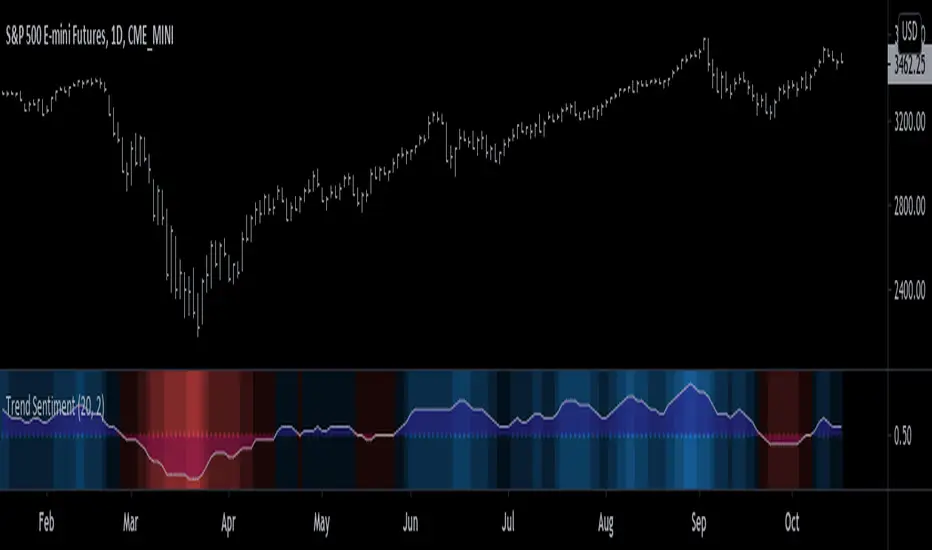
Trend Sentiment [racer8]Trend Sentiment is a trend indicator with enhanced graphics, that is, it has many different shades of blue and red.
The brighter the blue, the more bullish.
The brighter the red, the more bearish.
It is a simple indicator with a basic formula:
a = close > prev.close? ---> If yes, a = 1, otherwise a = 0.
b = sma of a over n periods -----1st parameter, n...."Length"
c = sma of b over j periods ----- 2nd parmeter, j..."Smoothing"
plot (c)
Is c > 0.5? ---> If yes, background color = blue, otherwise red.
plot background color.
plot 0.5 as dotted midline.
The Trend Sentiment value represents the percentage of bullish force in the market.
Signals are generated when it crosses the 50% mark.
Values above 0.50 are bullish and values below 0.50 are bearish.
Enjoy and hit the like button :)
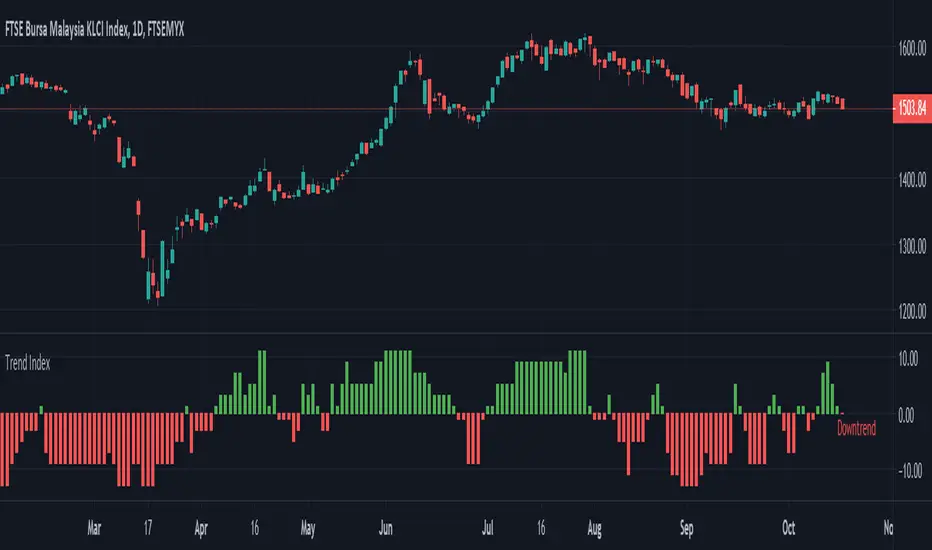
Trend Index Trend Index show trend of the instrument based on multiple indicators
- Green --> Uptrend
- Red --> Downtrend
- Gray --> No trend
Indicators used:-
Relative Strength Index (RSI)
Commodity Channel Index (CCI)
William Percent Range (WPR)
Directional Movement Index (DMI)
Elder Force Index (EFI)
Momentum
Demarker
Parabolic SAR
Trend Break Targets [MarkitTick]Trend Break Targets
Trend Break Targets is a technical analysis tool designed to assist traders in identifying trendline breakouts and projecting potential price targets based on market geometry. Unlike fully automated indicators that guess trendlines, this tool provides you with precise control by allowing you to manually Pivot Point the trendline to specific points in time, while automating the complex math of target projection and structure mapping.
Theoretical Basis & Concepts
This indicator is grounded in classic technical analysis principles found in foundational trading literature. It automates the following methodology:
Drawing a trend line between two key points to represent dynamic support or resistance.
Identifying a breakout when the price closes above or below this line, potentially signaling a change in trend.
Calculating a price target by measuring the vertical distance between the breakout line and the last high/low (pivot), then projecting that same distance in the direction of the breakout.
This concept is based on methods and "Measured Move" theories explained in classic books such as "Technical Analysis of Stock Trends" by Edwards & Magee, "Technical Analysis of the Financial Markets" by John Murphy, and in Thomas Bulkowski's Price Pattern Studies.
How It Works
Pivot Pointed Trendline Construction The script draws a trendline between two user-defined points in time (Start Date and End Date). It calculates the slope between these points and extends the line infinitely to the right, allowing you to define the exact structure (e.g., a resistance trendline on a wedge).
Breakout Detection The script monitors the "Price Source" (High, Low, or Close) relative to the extended trendline.
A Bullish Breakout (BC) occurs when the Close crosses above a bearish trendline.
A Bearish Breakout (BC) occurs when the Close crosses below a bullish trendline.
Dynamic Target Projection (The Math) Upon a confirmed breakout, the script automatically calculates three distinct targets by identifying the most significant "Swing Point" (Pivot) prior to the breakout.
Distance (D): The vertical distance between the Trendline and the Pivot Price at the specific bar where the pivot occurred.
Target 1 (T1): The Breakout Price +/- (Distance × 1.0). This represents a classic 1:1 measured move.
Target 2 (T2): The Breakout Price +/- (Distance × 1.618). Based on the Golden Ratio extension.
Target 3 (T3): The Breakout Price +/- (Distance × 2.618).
Market Structure (CHOCH) The script includes an optional Change of Character (CHOCH) module. This runs independently of the trendline logic, identifying local Swing Highs and Swing Lows based on the "Swing Detection Length." It plots dashed lines and labels to visualize immediate shifts in market structure.
How to Use This Tool
This is an interactive tool that requires user input to define the setup.
Identify a Setup: Locate a clear trend, wedge, or flag pattern on your chart.
Set Pivot Points: Go to the Indicator Settings. Input the exact Start Date and End Date corresponding to the two main touches of your trendline.
Monitor for Breakout: The script will extend the line. Wait for a "BC" label to appear.
Trade Management: Once "BC" prints, the T1, T2, and T3 lines will instantly render. These can be used as potential take-profit zones or areas to tighten stop-losses.
Settings & Configuration
Indicator Settings
Start/End Date: The timestamp Pivot Points for your trendline.
Price Source: Determines what price (High or Low) Pivot Points the line and triggers the breakout.
Pivot Left/Right: Adjusts the sensitivity for finding the "Pivot Before Break" used for target calculations.
Extend Target Line: How far forward the target lines are drawn.
Visual Style
Colors: Fully customizable colors for the Trendline, Breakout Labels, and each Target level (T1, T2, T3).
Gold Bullish Reversal
This analysis dissects a confirmed bullish reversal on Gold using a custom Trend Break system. The setup identifies a transition from a bearish corrective phase to bullish momentum, validated by a structural break and a geometric target projection.
Trend Identification (The Pivot Points) The descending white trendline serves as the primary dynamic resistance, defining the bearish correction.
Pivot Points: The line is drawn connecting two significant swing highs, marked by Label 1 and Label 2.
Logic: These points represent the "lower highs" characteristic of the previous downtrend. As long as price remained below this trajectory, the bearish bias was intact.
The Trigger: Breakout & Confirmation The transition occurs at the candle marked BC (Breakout Candle).
Breakout Criteria: The indicator logic dictates that a signal is only valid when the bar closes above the trendline. This filters out intraday wicks and ensures genuine buyer commitment.
CHOCH Confluence: Immediately following the breakout, a CHOCH (Change of Character) label appears. This signals a shift in market structure, indicating that the internal lower-high/lower-low sequence has been violated, adding probability to the reversal.
Target Projection: The Measured Move The vertical green lines (T1, T2) represent profit objectives derived from the depth of the prior move. The logic calculates the distance between the breakout line and the lowest pivot prior to the break.
T1 (Standard Target): This is a 1:1 projection of the pre-breakout volatility. We see price action initially stalling near this level, confirming it as a zone of interest.
T2 (Golden Ratio Extension): The second target is calculated as the initial distance multiplied by 1.618 (Fibonacci Golden Ratio). The chart shows the price rallying aggressively through T1 to tap the T2 zone, often considered an exhaustion or major take-profit level in harmonic extensions.
Conclusion Gold has successfully invalidated the 4-hour bearish trendline. The confluence of a confirmed close above resistance (BC) and a structural shift (CHOCH) provided a high-probability long setup. The price has now fulfilled the T2 (1.618) extension, suggesting traders should watch for consolidation or a reaction at this key Fibonacci resistance level.
Bearish Trendline Breakdown
The image displays a Bearish Trendline Breakdown on the Gold (XAUUSD) 4-hour chart. The indicator is actually functioning in "Low" mode here (connecting swing lows to form support), which triggers the bearish logic found in the code. Here is the step-by-step breakdown:
The Setup: Pivot Points & Trendline
Visual: The Blue Labels "1" and "2" connected by a white diagonal line.
Code Logic: These are the user-defined start and end points.
Pivot Point 1 (startDate): The starting pivot of the trendline.
Pivot Point 2 (endDate): The ending pivot.
Trendline: The code draws a line between these two points and extends it to the right (extend.right). In this specific image, the line acts as a Support Trendline.
The Trigger: Break Candle (BC)
Visual: The Red Label "BC" appearing just below the white trendline.
Code Logic: This is the execution signal. The code detects a "Down Break" (dnBreak) because the Price Source was likely set to "Low" and the candle's Close was lower than the Trendline Price at that specific bar (close < currLinePrice). This confirms the support level has been breached.
The Projection: Targets (T1 & T2)
Visual: The Green Labels "T1" and "T2" with dotted horizontal lines projected downward.
Code Logic: These are profit targets based on a "Measured Move."
Pivot Calculation: The script looks back for a recent "Pivot High" (the peak before the crash) to calculate the volatility/distance (dist) between that peak and the trendline.
T1 (Conservative): The price is projected downward by 1x that distance (currLinePrice - dist).
T2 (Extended): The price is projected downward by 1.618x that distance (Golden Ratio extension).
Market Context: CHOCH
Visual: The small Red/Orange "CHOCH" labels appearing above the price action.
Code Logic: This is a secondary confirmation system running independently of the trendline. It detects a Change of Character (structural shift). The red labels indicate a "Bearish CHOCH," meaning the price broke below a significant prior swing low (last_swing_low). This supports the bearish bias of the trendline break.
Disclaimer This tool is for educational and technical analysis purposes only. Breakouts can fail (fake-outs), and past geometric patterns do not guarantee future price action. Always manage risk and use this tool in conjunction with other forms of analysis.

Trend BG v2Trend BG v2 colors the chart background based on Directional Movement (DM) and DI strength. It provides an easy visual way to identify trending and non-trending conditions on any timeframe.
How It Works
The script calculates:
Upward Directional Movement (DM+)
Downward Directional Movement (DM–)
True Range smoothed with RMA (14-period)
Positive DI and Negative DI values from classic ADX logic
The trend state is determined by comparing +DI vs –DI:
+DI > –DI → Uptrend
–DI > +DI → Downtrend
Otherwise → Neutral / Sideways
The script then applies a background color based on the detected trend.
Color transparency and theme can be adjusted using the input options.
Why This Script Is Useful
Instead of plotting DI lines or ADX curves, this version presents the trend directly on the background, making it ideal for:
Quick trend recognition
Visual filtering of choppy vs trending markets
Enhancing manual or automated setups
Intraday scalping, positional trend following, and multi-timeframe analysis
The background display is subtle, customizable, and does not interfere with other indicators on the chart.
Key Features
Trend-colored chart background (Up / Down / Neutral)
Adjustable color palette and transparency
Built using classic Directional Movement logic
Works on all markets and all timeframes
Lightweight and efficient (no repainting)
How to Use It
Apply the indicator on your chart and use the background colors to:
Align trades with the market trend
Avoid trading during neutral or low-momentum periods
Confirm trend direction before entries
Improve clarity when using your existing indicators
This indicator does not generate buy/sell signals by itself; instead, it helps visualize the underlying trend environment so traders can make more informed decisions.

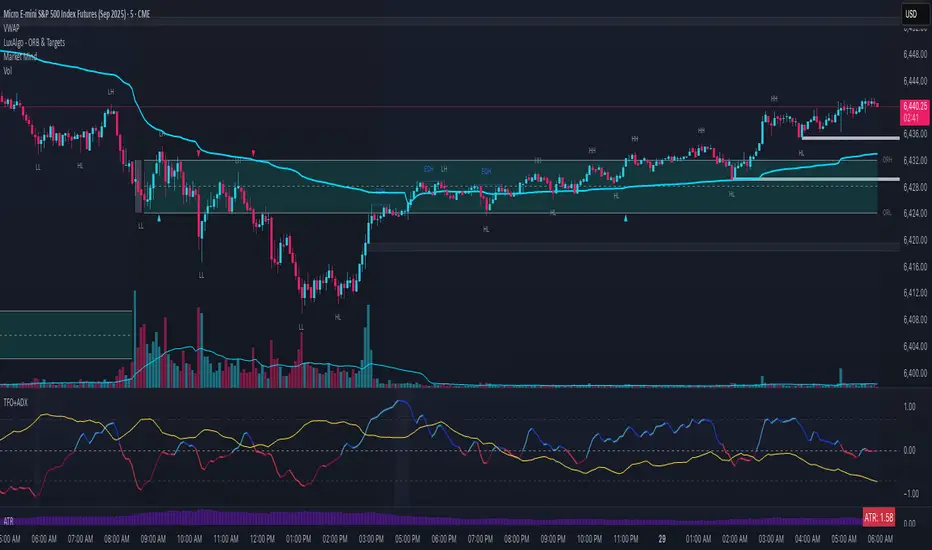
Trend Flow Oscillator (CMF + MFI) + ADX## Trend Flow Oscillator (TFO + ADX) Indicator Description
The Trend Flow Oscillator (TFO+ADX) combines two volume-based indicators, Money Flow Index (MFI) and Chaikin Money Flow (CMF), along with the Average Directional Index (ADX) into one comprehensive oscillator. This indicator provides traders with insights into momentum, volume flow, and trend strength, clearly indicating bullish or bearish market conditions.
### How the Indicator Works:
1. **Money Flow Index (MFI)**:
* Measures buying and selling pressure based on price and volume.
* Scaled from -1 to +1 (where positive values indicate buying pressure, negative values indicate selling pressure).
2. **Chaikin Money Flow (CMF)**:
* Evaluates money flow volume over a set period, reflecting institutional buying or selling.
* Also scaled from -1 to +1 (positive values suggest bullish accumulation, negative values bearish distribution).
3. **Average Directional Index (ADX)**:
* Measures trend strength, indicating whether a market is trending or ranging.
* Scaled from -1 to +1, with values above 0 suggesting strong trends, and values near or below 0 indicating weak trends or sideways markets.
* Specifically, an ADX value of 0 means neutral trend strength; positive values indicate a strong trend.
### Indicator Levels and Interpretation:
* **Zero Line (0)**: Indicates neutral conditions. When the oscillator crosses above zero, it signals increasing bullish momentum; crossing below zero indicates bearish momentum.
* **Extreme Zones (+/- 0.75)**:
* Oscillator values above +0.75 are considered overbought or highly bullish.
* Oscillator values below -0.75 are considered oversold or highly bearish.
* The indicator features subtle background shading to visually highlight these extreme momentum areas for quick identification.
* Shading when values above or below the +/-1.0 level.
* **Color Coding**:
* Bright blue indicates strengthening bullish momentum.
* Dark blue signals weakening bullish momentum.
* Bright red indicates strengthening bearish momentum.
* Dark maroon signals weakening bearish momentum.
Trend Volatility Index (TVI)Trend Volatility Index (TVI)
A robust nonparametric oscillator for structural trend volatility detection
⸻
What is this?
TVI is a volatility oscillator designed to measure the strength and emergence of price trends using nonparametric statistics.
It calculates a U-statistic based on the Gini mean difference across multiple simple moving averages.
This allows for objective, robust, and unbiased quantification of trend volatility in tick-scale values.
⸻
What can it do?
• Quantify trend strength as a continuous value aligned with tick price scale
• Detect trend breakouts and volatility expansions
• Identify range-bound market states
• Detect early signs of new trends with minimal lag
⸻
What can’t it do?
• Predict future price levels
• Predict trend direction before confirmation
⸻
How it works
TVI computes a nonparametric dispersion metric (Gini mean difference) from multiple SMAs of different lengths.
As this metric shares the same dimension as price ticks, it can be directly interpreted on the chart as a volatility gauge.
The output is plotted using candlestick-style charts to enhance visibility of change rate and trend behavior.
⸻
Disclaimer
TVI does not predict price. It is a structural indicator designed to support discretionary judgment.
Trading carries inherent risk, and this tool does not guarantee profitability. Use at your own discretion.
⸻
Innovation
This indicator introduces a novel approach to trend volatility by applying U-statistics over time series
to produce a nonparametric, unbiased, and robust estimate of structural volatility.
日本語要約
Trend Volatility Index (TVI) は、ノンパラメトリックなU統計量(Gini平均差)を使ってトレンドの強度を客観的に測定することを目的に開発されたボラティリティ・オシレーターです。
ティック単位で連続的に変化し、トレンドのブレイク・レンジ・初動の予兆を定量的に検出します。
未来の価格や方向は予測せず、現在の構造的ばらつきだけをロバストに評価します。

Trend Heuristics (+Signals)Trend Heuristics - Enhanced Rolling VWAP with Smart Signals
This indicator is an enhanced version of the Rolling VWAP (RVWAP) concept, originally based on PineCoders' ConditionalAverages library. It combines volume-weighted average price analysis with advanced signal detection for both sweeps and breakouts.
Core Features
1. Rolling VWAP System
- Implements a dynamic rolling VWAP that adapts to different timeframes
- Includes standard deviation bands for volatility measurement
- Offers flexible time period settings (fixed or auto-adjusting)
- Provides customizable visual elements including bands and fills
2. Dual Signal System
Sweep Signals
Detects high-probability reversal points with these conditions:
- Bullish Sweep:
- Opens above upper band
- Tests below upper band (low)
- Closes above upper band
- Shows stronger lower wick
- Closes above previous high
- Has favorable close position (upper 50% of candle)
- Bearish Sweep:
- Opens below lower band
- Tests above lower band (high)
- Closes below lower band
- Shows stronger upper wick
- Closes below previous low
- Has favorable close position (lower 50% of candle)
Breakout Signals
Identifies potential trend changes with these conditions:
- Bullish Breakout:
- Opens below VWAP
- Closes above upper band
- Indicates strong momentum shift upward
- Bearish Breakout:
- Opens above VWAP
- Closes below lower band
- Indicates strong momentum shift downward
Technical Details
Base Components
- Built upon PineCoders' ConditionalAverages library
- Incorporates custom alert system via CustomAlertLib
- Uses standard deviation for band calculations
Customization Options
- Adjustable standard deviation multiplier
- Flexible time period settings
- Independent controls for sweep and breakout signals
- Customizable visual elements (colors, sizes, positions)
- Custom alert message formatting
Use Cases
1. Trend Following:
- Use VWAP as dynamic support/resistance
- Monitor breakout signals for trend changes
2. Mean Reversion:
- Use sweep signals for counter-trend opportunities
- Standard deviation bands for range identification
3. Volume Analysis:
- VWAP provides volume-weighted price levels
- Helps identify significant price levels
Notes
- Best performed on liquid instruments with consistent volume
- Most effective on timeframes from 1hours to 4 hours and 1D, anything greater isn't very good
- Recommended to use in conjunction with other technical analysis tools
- Signals can be filtered based on higher timeframe trends
Credits
- Original Rolling VWAP concept by PineCoders
Trend Maestro - Linear Regression & Volatility BandsTrend Maestro - Linear Regression & Volatility Bands
Description:
The "Trend Maestro - Linear Regression & Volatility Bands" indicator is meticulously designed to provide traders with a clear understanding of market trends through the application of linear regression techniques and enhanced market data visualization. This tool is essential for traders looking to interpret long-term trends and market stability. Here's how the indicator functions and what makes it a unique addition to your trading toolkit:
1. Linear Regression Calculation:
At the heart of this indicator lies the linear regression calculation, which identifies the primary trend direction over a specified period. It does this by computing a line of best fit through the closing prices, helping to smooth out price fluctuations and highlight the prevailing trend direction. Users have the flexibility to adjust both the length of the regression and the offset period, enabling them to tailor the indicator's responsiveness to different market conditions.
2. Visualization Through Volatility Bands:
The volatility bands, plotted at half, one, two, and three standard deviations around the linear regression line, serve primarily as a visualization tool rather than a basis for investment decisions.
These bands:
Measure the dispersion of price from the trend line, providing a graphical representation of volatility.
Help traders visually assess the market's stability and the reliability of the current trend, with broader bands indicating higher volatility and narrower bands suggesting more stability.
3. Customization Features:
The indicator offers customization options including toggle switches for bar color and the display of SD bands, enhancing visual clarity. These settings allow traders to personalize the display according to their visual preferences and analysis requirements.
By incorporating these elements, the "Trend Maestro - Linear Regression & Volatility Bands" indicator offers a framework for understanding market trends through both quantitative calculations and qualitative visual aids. This makes it a valuable tool for those looking to make informed decisions based on longer-term market observations.
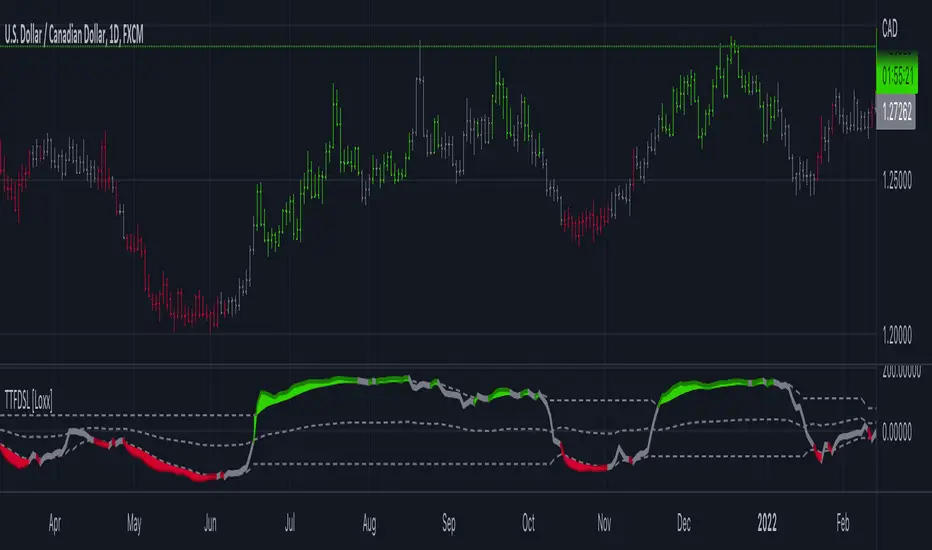
Trend Trigger Factor w/ Discontinued Signal Lines [Loxx]Trend Trigger Factor w/ Discontinued Signal Lines is a Trend Trigger Factor indicator with floating boundary lines to identify trends earlier
What is the Trend Trigger Factor?
Designed by M.H. Pee, the Trend Trigger Factors role is to help traders detect uptrends and downtrends and thus allow them to better position themselves in a with-trend manner. Its creator argues that the markets are mostly random but have a small trend component, which is the most crucial part of trading success. Being able to determine whether the market is in a bull or bear trend and how strong that trend is will allow you to be on the right side of the market for longer, capitalizing as much as possible on its trending behavior.
In his article, M.H. Pee used a 15-period trackback span to explain the calculations. The TTF formula is based on the so-called Buy Power and Sell Power. In his example, Pee labeled today as day 1, yesterday as day 2, the preceding day as day 3 and so on
What's new in this indicator?
Averages filter out prices prior to being used in calculation. That way the lag added is smaller than when the smoothing is used on the calculated result.
Unlike the original which uses levels +100 and -100 as significant levels for signal triggering, this version is using discontinued signal lines for trend filtering. That way it makes it a bit more responsive to market conditions
How do I use this?
The Trend Trigger Factor is similar in interpretation to the Relative Strength Index. It is plotted on a scale with most prominent levels at +100 and -100, crosses of which logically signal possible trade entries. The difference here, however, is that the upper and lower boundary flex with price movements so the upper and lower boundary shift dynamically. Crosses above the top line signify bullish sentiment, crossed below the the bottom line signify bearish sentiment.