Candle Trend ConfirmationCandle Trend Confirmation Indicator
The "Candle Trend Confirmation" indicator This indicator leverages an Exponential Moving Average (EMA) to visually confirm market trends through dynamic coloring of the EMA line, a shading effect, and candle color changes. It aims to help traders quickly identify strong trends and consolidation phases, enhancing decision-making in various market conditions.
Key Features
Customizable EMA Period:
Traders can adjust the EMA period via an input parameter, with a default setting of 20 periods. This flexibility allows the indicator to adapt to different timeframes and trading strategies.
Pip Threshold for Trend Strength:
A user-defined pip threshold (default set to 0.02) determines the distance from the EMA required to classify a trend as "strong." This parameter can be fine-tuned to suit specific instruments, such as forex pairs, cryptocurrencies, or stocks, where pip values may differ.
Trend Detection Logic:
Strong Uptrend: The closing price must be above the EMA by at least the pip threshold (e.g., 2 pips) and show consistent upward movement over the last three bars (current close > previous close > close two bars ago).
Strong Downtrend: The closing price must be below the EMA by at least the pip threshold and exhibit consistent downward movement over the last three bars.
Consolidation: Any price action that doesn’t meet the strong trend criteria is classified as a consolidation phase.
Dynamic Coloring:
EMA Line: Displayed using the line.new function, the EMA changes color based on trend conditions: green for a strong uptrend, red for a strong downtrend, and purple for consolidation. The line is drawn only for the most recent bar to maintain chart clarity.
Candles: Candlestick colors mirror the trend state—green for strong uptrends, red for strong downtrends, and purple for consolidation—using the barcolor function, providing an immediate visual cue.
Shading Effect: Two dashed lines are drawn above and below the EMA (at half the pip threshold distance) to create a subtle shading zone. These lines adopt a semi-transparent version of the EMA’s color, enhancing the visual representation of the trend’s strength.
How It Works
The indicator calculates the EMA based on the closing price and compares the current price to this average. By incorporating a pip-based threshold and a three-bar confirmation, it filters out noise and highlights only significant trend movements. The use of line.new instead of plot ensures compatibility with certain TradingView environments and offers a lightweight way to render the EMA and shading lines on the chart.
Usage
Trend Identification: Green signals a strong bullish trend, ideal for potential long entries; red indicates a strong bearish trend, suitable for short opportunities; purple suggests a range-bound market, where caution or range-trading strategies may apply.
Customization: Adjust the EMA period and pip threshold in the indicator settings to match your trading style or the volatility of your chosen market. For example, forex traders might set the threshold to 0.0002 for 2 pips on EUR/USD, while crypto traders might use 2.0 for BTC/USD.
Visual Clarity: The combination of EMA coloring, shading, and candle highlights provides a comprehensive view of market dynamics at a glance.
Cari dalam skrip untuk "trend"

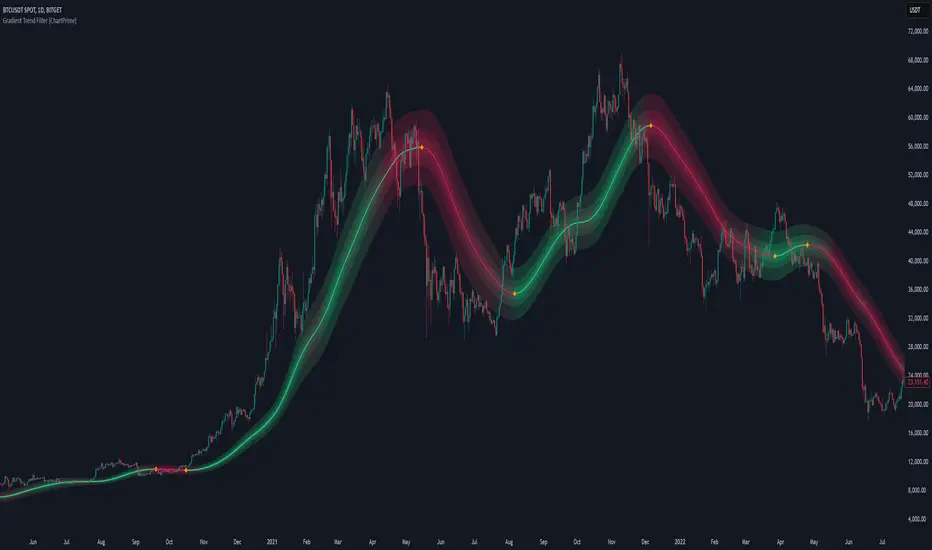
Gradient Trend Filter [ChartPrime]The Gradient Trend Filter is a dynamic trend analysis tool that combines a noise-filtered trend detection system with a color-gradient cloud. It provides traders with a visual representation of trend strength, momentum shifts, and potential reversals.
⯁ KEY FEATURES
Trend Noise Filtering
Uses an advanced smoothing function to filter market noise and produce a more reliable trend representation.
// Noise filter function
noise_filter(src, length) =>
alpha = 2 / (length + 1)
nf_1 = 0.0
nf_2 = 0.0
nf_3 = 0.0
nf_1 := (alpha * src) + ((1 - alpha) * nz(nf_1 ))
nf_2 := (alpha * nf_1) + ((1 - alpha) * nz(nf_2 ))
nf_3 := (alpha * nf_2) + ((1 - alpha) * nz(nf_3 ))
nf_3 // Final output with three-stage smoothing
Color-Based Trend Visualization
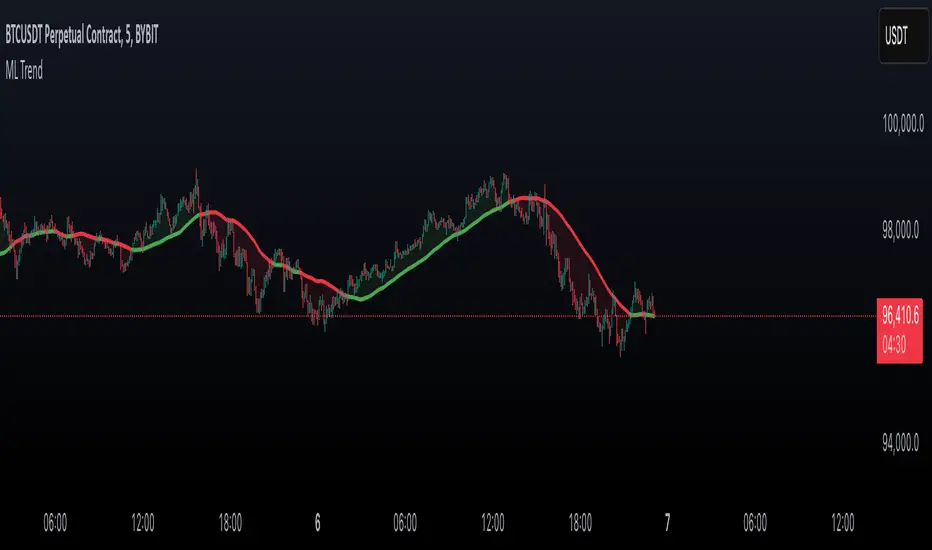
The mid-line changes color based on trend direction—green for uptrends and red for downtrends—making it easy to identify trends at a glance.
Orange diamond markers appear when a trend shift is confirmed, providing actionable signals for traders.
Gradient Color Trend Cloud
A cloud around the base trend line that dynamically changes color, often signaling trend shifts ahead of the main trend line.
When in a downtrend, if the cloud starts turning green, it suggests weakening bearish momentum or an upcoming bullish reversal. Conversely, when in an uptrend, a red cloud indicates potential trend weakening or a bearish reversal.
Multi-Layered Trend Bands
The cloud consists of multiple bands, offering a range of support and resistance zones that traders can use for confluence in decision-making.
⯁ HOW TO USE
Identify Trend Strength & Reversals
Use the mid-line and cloud color changes to assess the strength of a trend and spot early signs of reversals.
Monitor Momentum Shifts
Watch for gradient cloud color shifts before the trend line changes color, as this can indicate early weakening or strengthening of momentum.
Act on Trend Shift Markers
Use the orange diamonds as confirmation of trend shifts and potential trade entry or exit points.
Utilize Cloud Bands as Support/Resistance
The outer bands of the cloud act as dynamic support and resistance, helping traders refine their stop-loss and take-profit placements.
⯁ CONCLUSION
The Gradient Trend Filter is an advanced trend detection tool designed for traders looking to anticipate trend shifts with greater precision. By integrating a noise-filtered trend line with a gradient-based trend cloud, this indicator enhances traders' ability to navigate market trends effectively.
Machine Learning: kNN Trend PredictorThe kNN Trend Predictor is a machine learning-based indicator that uses the k-Nearest Neighbors (kNN) algorithm for price prediction in trading. By analyzing historical price movements and computing Euclidean distances, the script identifies the closest past price patterns and forecasts potential trends. It provides color-coded trend signals, optional trade entry labels, and alerts for long and short signals.
Triple Trend Indicator [BigBeluga]Triple Trend Indicator is a versatile trend-following tool designed to help traders identify trend strength and potential pullback levels using a three-band system. Each band represents a varying degree of price deviation from the mean, providing progressively stronger trend signals.
🔵 Key Features:
Three Adaptive Bands:
The indicator dynamically calculates three bands (1, 2, and 3) based on moving averages (SMA, EMA, WMA) and ATR multipliers.
Bands are positioned below the price in an uptrend and above the price in a downtrend, offering clear trend direction visualization.
Signal System:
Signals are generated when price interacts with the bands:
Signal 1: Triggered when the price touches Band 1, indicating a minor pullback within the trend.
Signal 2: Triggered at Band 2, showing a stronger price deviation and trend confirmation.
Signal 3: Triggered at Band 3, representing the most significant price deviation and strongest trend signal.
The further the price deviates from the mean, the stronger the trend signal, with Signal 3 being the most robust.
Color-Coded Bands:
Bands dynamically change color based on the trend direction:
Green bands signify an uptrend.
Brown bands signify a downtrend.
Dynamic Trend Line Changes:
Dashed lines highlight trend changes, helping traders visualize key turning points in the market.
🔵 Usage:
Use the bands to identify trend direction and strength.
Monitor the signal system to assess the level of price deviation and potential pullback strength.
Combine Signal 1, 2, and 3 to confirm trend momentum:
Signal 1 suggests a weaker pullback and continuation.
Signal 2 indicates a stronger trend confirmation.
Signal 3 highlights the strongest momentum and potential exhaustion points.
Utilize the color-coded bands for an intuitive understanding of current market conditions.
The Triple Trend Indicator is an ideal tool for trend traders looking for structured signals and dynamic support and resistance levels to optimize entries and exits.

Trend with ADX/EMA - Buy & Sell SignalsThis script is designed to help traders make buy and sell decisions based on trend analysis using two key methods: ADX (Average Directional Index) and EMA (Exponential Moving Averages). Here's a breakdown in simple terms:
What Does It Do?
Identifies the Trend's Strength and Direction:
Uses the ADX indicator to determine how strong the trend is.
Compares two lines (DI+ and DI−) to identify whether the trend is moving up or down.
Generates Buy and Sell Signals:
Uses two EMAs (a fast one and a slow one) to check when the price crosses key levels, signaling a possible buy or sell opportunity.
Plots visual indicators (arrows and labels) for easy interpretation.
Color-Codes the Chart:
Highlights the background in green when the trend is bullish (uptrend).
Highlights the background in red when the trend is bearish (downtrend).
Alerts the User:
Creates alerts when specific conditions for buying or selling are met.
Key Components:
1. ADX (Trend Strength & Direction)
What is ADX?
ADX measures how strong the trend is (not the direction). Higher ADX means a stronger trend.
It also calculates two lines:
DI+: Measures upward movement strength.
DI−: Measures downward movement strength.
How It Works in the Script:
If DI+ is greater than DI−, it’s a bullish trend (upward).
If DI− is greater than DI+, it’s a bearish trend (downward).
The background turns green for an uptrend and red for a downtrend.
2. EMA (Buy and Sell Decisions)
What is EMA?
EMA is a moving average that gives more weight to recent prices. It’s used to smooth out price fluctuations.
How It Works in the Script:
The script calculates two EMAs:
Fast EMA (short-term average): Reacts quickly to price changes.
Slow EMA (long-term average): Reacts slower and shows overall trends.
When the Fast EMA crosses above the Slow EMA, it’s a signal to Buy.
When the Fast EMA crosses below the Slow EMA, it’s a signal to Sell.
These signals are marked on the chart as "Buy" and "Sell" labels.
3. Buy and Sell Alerts
The script sets up alerts for the user:
Buy Alert: When a crossover indicates a bullish signal.
Sell Alert: When a crossunder indicates a bearish signal.
Visual Elements on the Chart:
Background Colors:
Green: When the DI+ line indicates an uptrend.
Red: When the DI− line indicates a downtrend.
EMA Lines:
Green Line: Fast EMA.
Red Line: Slow EMA.
Buy/Sell Labels:
"Buy" label: Shown when the Fast EMA crosses above the Slow EMA.
"Sell" label: Shown when the Fast EMA crosses below the Slow EMA.
Why Use This Script?
Trend Analysis: Helps you quickly identify the strength and direction of the market trend.
Buy/Sell Signals: Gives clear signals to enter or exit trades based on trend and EMA crossovers.
Custom Alerts: Ensures you never miss a trading opportunity by notifying you when conditions are met.
Visual Simplicity: Makes it easy to interpret trading signals with color-coded backgrounds and labeled arrows.

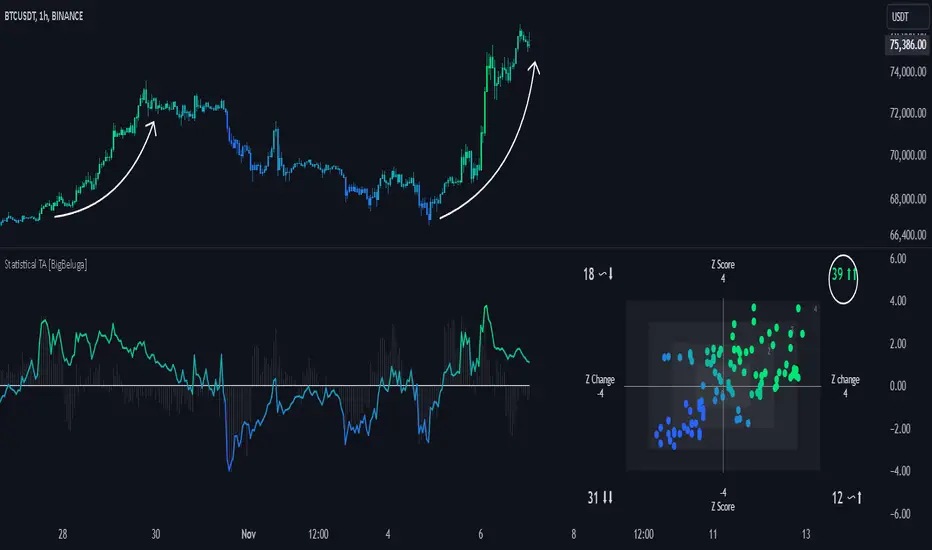
Statistical Trend Analysis (Scatterplot) [BigBeluga]Statistical Trend Analysis (Scatterplot) provides a unique perspective on market dynamics by combining the statistical concept of z-scores with scatterplot visualization to assess price momentum and potential trend shifts.
🧿 What is Z-Score?
Definition: A z-score is a statistical measure that quantifies how far a data point is from the mean, expressed in terms of standard deviations.
In this Indicator:
A high positive z-score indicates the price is significantly above the average.
A low negative z-score indicates the price is significantly below the average.
The indicator also calculates the rate of change of the z-score, helping identify momentum shifts in the market.
🧿 Key Features:
Scatterplot Visualization:
Displays data points of z-score and its change across four quadrants.
Quadrants help interpret market conditions:
Upper Right (Strong Bullish Momentum): Most data points here signal an ongoing uptrend.
Upper Left (Weakening Momentum): Data points here may indicate a potential market shift or ranging market.
Lower Left (Strong Bearish Momentum): Indicates a dominant downtrend.
Lower Right (Trend Shift to Bullish/Ranging): Suggests weakening bearish momentum or an emerging uptrend.
Color-Coded Candles:
Candles are dynamically colored based on the z-score, providing a visual cue about the price's deviation from the mean.
Z-Score Time Series:
A line plot of z-scores over time shows price deviation trends.
A gray histogram displays the rate of change of the z-score, highlighting momentum shifts.
🧿 Usage:
Use the scatterplot and quadrant gauges to understand the current market momentum and potential shifts.
Monitor the z-score line plot to identify overbought/oversold conditions.
Utilize the gray histogram to detect momentum reversals and trend strength.
This tool is ideal for traders who rely on statistical insights to confirm trends, detect potential reversals, and assess market momentum visually and quantitatively.
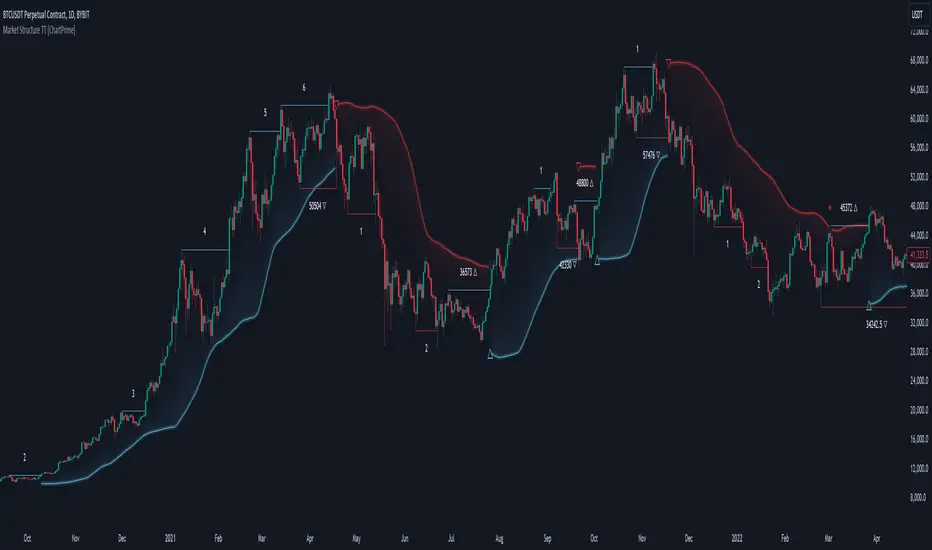
Market Structure Trend Targets [ChartPrime]The Market Structure Trend Targets indicator is designed to identify trend direction and continuation points by marking significant breaks in price levels. This approach helps traders track trend strength and potential reversal points. The indicator uses previous highs and lows as breakout triggers, providing a visual roadmap for trend continuation or mean reversion signals.
⯁ KEY FEATURES AND HOW TO USE
⯌ Breakout Points with Numbered Markers :
The indicator identifies key breakout points where price breaks above a previous high (for uptrends) or below a previous low (for downtrends). The initial breakout (zero break) is marked with the entry price and a triangle icon, while subsequent breakouts within the trend are numbered sequentially (1, 2, 3…) to indicate trend continuation.
Example of breakout markers for uptrend and downtrend:
⯌ Percentage Change Display Option :
Traders can toggle on a setting to display the percentage change from the initial breakout point to each subsequent break level, offering an easy way to gauge trend momentum over time. This is particularly helpful for identifying how far price has moved in the current trend.
Percentage change example between break points:
⯌ Dynamic Stop Loss Levels :
In uptrends, the stop loss level is placed below the price to protect against downside moves. In downtrends, it is positioned above the price. If the price breaches the stop loss level, the indicator resets, indicating a potential end or reversal of the trend.
Dynamic stop loss level illustration in uptrend and downtrend:
⯌ Mean Reversion Signals :
The indicator identifies potential mean reversion points with diamond icons. In an uptrend, if the price falls below the stop loss and then re-enters above it, a diamond is plotted, suggesting a possible mean reversion. Similarly, in a downtrend, if the price moves above the stop loss and then falls back below, it indicates a reversion possibility.
Mean reversion diamond signals on the chart:
⯌ Trend Visualization with Colored Zones :
The chart background is shaded to visually represent trend direction, with color changes corresponding to uptrends and downtrends. This makes it easier to see overall market conditions at a glance.
⯁ USER INPUTS
Length : Defines the number of bars used to identify pivot highs and lows for trend breakouts.
Display Percentage : Option to toggle between showing sequential breakout numbers or the percentage change from the initial breakout.
Colors for Uptrend and Downtrend : Allows customization of color zones for uptrends and downtrends to match individual chart preferences.
⯁ CONCLUSION
The Market Structure Trend Targets indicator offers a strategic way to monitor market trends, track breakouts, and manage risk through dynamic stop loss levels. Its clear visual representation of trend continuity, alongside mean reversion signals, provides traders with actionable insights for both trend-following and counter-trend strategies.
Trend Trader-Remastered StrategyOfficial Strategy for Trend Trader - Remastered
Indicator: Trend Trader-Remastered (TTR)
Overview:
The Trend Trader-Remastered is a refined and highly sophisticated implementation of the Parabolic SAR designed to create strategic buy and sell entry signals, alongside precision take profit and re-entry signals based on marked Bill Williams (BW) fractals. Built with a deep emphasis on clarity and accuracy, this indicator ensures that only relevant and meaningful signals are generated, eliminating any unnecessary entries or exits.
Please check the indicator details and updates via the link above.
Important Disclosure:
My primary objective is to provide realistic strategies and a code base for the TradingView Community. Therefore, the default settings of the strategy version of the indicator have been set to reflect realistic world trading scenarios and best practices.
Key Features:
Strategy execution date&time range.
Take Profit Reduction Rate: The percentage of progressive reduction on active position size for take profit signals.
Example:
TP Reduce: 10%
Entry Position Size: 100
TP1: 100 - 10 = 90
TP2: 90 - 9 = 81
Re-Entry When Rate: The percentage of position size on initial entry of the signal to determine re-entry.
Example:
RE When: 50%
Entry Position Size: 100
Re-Entry Condition: Active Position Size < 50
Re-Entry Fill Rate: The percentage of position size on initial entry of the signal to be completed.
Example:
RE Fill: 75%
Entry Position Size: 100
Active Position Size: 50
Re-Entry Order Size: 25
Final Active Position Size:75
Important: Even RE When condition is met, the active position size required to drop below RE Fill rate to trigger re-entry order.
Key Points:
'Process Orders on Close' is enabled as Take Profit and Re-Entry signals must be executed on candle close.
'Calculate on Every Tick' is enabled as entry signals are required to be executed within candle time.
'Initial Capital' has been set to 10,000 USD.
'Default Quantity Type' has been set to 'Percent of Equity'.
'Default Quantity' has been set to 10% as the best practice of investing 10% of the assets.
'Currency' has been set to USD.
'Commission Type' has been set to 'Commission Percent'
'Commission Value' has been set to 0.05% to reflect the most realistic results with a common taker fee value.

True Range Trend StrengthThis script is designed to analyze trend strength using True Range calculations alongside Donchian Channels and smoothed moving averages. It provides a dynamic way to interpret market momentum, trend reversals, and anticipate potential entry points for trades.
Key Functionalities:
Trend Strength Oscillator:
Calculates trend strength based on the difference between long and short momentum derived from ATR (Average True Range) adjusted stop levels.
Smooths the trend strength using a simple moving average for better readability.
Donchian Channels on Trend Strength Oscillator:
Plots upper and lower Donchian Channels on the smoothed trend strength oscillator.
Traders can use these levels to anticipate breakout points and determine the strength of a trend.
Zero-Cross Shading:
Highlights bullish and bearish zones with shaded backgrounds:
Green for bullish zones where smoothed trend strength is above zero.
Red for bearish zones where smoothed trend strength is below zero.
Moving Averages for Oscillator:
Overlays fast and slow moving averages on the oscillator to provide crossover signals:
Fast MA Cross Above Slow MA: Indicates bullish momentum.
Fast MA Cross Below Slow MA: Indicates bearish momentum.
Alerts:
Alerts are available for MA crossovers, allowing traders to receive timely notifications about potential trend reversals or continuation signals.
Anticipating Entries with Donchian Channels:
The integration of Donchian Channels offers an edge in anticipating excellent trade entries.
Traders can use the oscillator's position relative to the channels to gauge oversold/overbought conditions or potential breakouts.
Use Case:
This script is particularly useful for traders looking to:
Identify the strength and direction of market trends.
Time entries and exits based on dynamic Donchian Channel levels and trend strength analysis.
Incorporate moving averages and visual cues for better decision-making.

Trend of Multiple Oscillator Dashboard ModifiedDescription: The "Trend of Multiple Oscillator Dashboard Modified" is a powerful Pine Script indicator that provides a dashboard view of various oscillator and trend-following indicators across multiple timeframes. This indicator helps traders to assess trend conditions comprehensively by integrating popular technical indicators, including MACD, EMA, Stochastic, Elliott Wave, DID (Curta, Media, Longa), Price Volume Trend (PVT), Kuskus Trend, and Wave Trend Oscillator. Each indicator’s trend signal (bullish, bearish, or neutral) is displayed in a color-coded dashboard, making it easy to spot the consensus or divergence in trends across different timeframes.
Key Features:
Multi-Timeframe Analysis: Displays trend signals across five predefined timeframes (1, 2, 3, 5, and 10 minutes) for each included indicator.
Customizable Inputs: Allows for customization of key parameters for each oscillator and trend-following indicator.
Trend Interpretation: Each indicator is visually represented with green (bullish), red (bearish), and yellow (neutral) trend markers, making trend identification intuitive and quick.
Trade Condition Controls: Input options for the number of positive and negative conditions needed to trigger entries and exits, allowing users to refine the decision-making criteria.
Delay Management: Options for re-entry conditions based on both price movement (in points) and the minimum number of candles since the last exit, giving users flexibility in managing trade entries.
Usage: This indicator is ideal for traders who rely on multiple oscillators and moving averages to gauge trend direction and strength across timeframes. The dashboard allows users to observe trends at a glance and make informed decisions based on the alignment of various trend indicators. It’s particularly useful in consolidating signals for strategies that require multiple conditions to align before entering or exiting trades.
Note: Ensure that you’re familiar with each oscillator’s functionality, as some indicators like Elliott Wave and Wave Trend are simplified for visual coherence in this dashboard.
Disclaimer: This script is intended for educational and informational purposes only. Use it with caution and adapt it to your specific trading plan.
Developer's Remark: "This indicator's comprehensive design allows traders to filter noise and identify the most robust trends effectively. Use it to visualize trends across timeframes, understand oscillator behavior, and enhance decision-making with a more strategic approach."

Trend Trader-RemasteredThe script was originally coded in 2018 with Pine Script version 3, and it was in invite only status. It has been updated and optimised for Pine Script v5 and made completely open source.
Overview
The Trend Trader-Remastered is a refined and highly sophisticated implementation of the Parabolic SAR designed to create strategic buy and sell entry signals, alongside precision take profit and re-entry signals based on marked Bill Williams (BW) fractals. Built with a deep emphasis on clarity and accuracy, this indicator ensures that only relevant and meaningful signals are generated, eliminating any unnecessary entries or exits.
Key Features
1) Parabolic SAR-Based Entry Signals:
This indicator leverages an advanced implementation of the Parabolic SAR to create clear buy and sell position entry signals.
The Parabolic SAR detects potential trend shifts, helping traders make timely entries in trending markets.
These entries are strategically aligned to maximise trend-following opportunities and minimise whipsaw trades, providing an effective approach for trend traders.
2) Take Profit and Re-Entry Signals with BW Fractals:
The indicator goes beyond simple entry and exit signals by integrating BW Fractal-based take profit and re-entry signals.
Relevant Signal Generation: The indicator maintains strict criteria for signal relevance, ensuring that a re-entry signal is only generated if there has been a preceding take profit signal in the respective position. This prevents any misleading or premature re-entry signals.
Progressive Take Profit Signals: The script generates multiple take profit signals sequentially in alignment with prior take profit levels. For instance, in a buy position initiated at a price of 100, the first take profit might occur at 110. Any subsequent take profit signals will then occur at prices greater than 110, ensuring they are "in favour" of the original position's trajectory and previous take profits.
3) Consistent Trend-Following Structure:
This design allows the Trend Trader-Remastered to continue signaling take profit opportunities as the trend advances. The indicator only generates take profit signals in alignment with previous ones, supporting a systematic and profit-maximising strategy.
This structure helps traders maintain positions effectively, securing incremental profits as the trend progresses.
4) Customisability and Usability:
Adjustable Parameters: Users can configure key settings, including sensitivity to the Parabolic SAR and fractal identification. This allows flexibility to fine-tune the indicator according to different market conditions or trading styles.
User-Friendly Alerts: The indicator provides clear visual signals on the chart, along with optional alerts to notify traders of new buy, sell, take profit, or re-entry opportunities in real-time.

Mars Signals - SSL Trend AnalyzerIntroduction
The "Mars Signals - Precision Trend Analyzer with SSL Baseline & Price Action Zones" is a comprehensive technical analysis tool designed for traders seeking to enhance their market analysis and trading strategies. This indicator integrates multiple advanced trading concepts, including dynamic moving averages, trend detection algorithms, momentum indicators, volume analysis, higher timeframe confirmation, candlestick pattern recognition, and precise price action zones. By combining these elements, the indicator aims to provide clear and actionable buy and sell signals, helping traders to make informed decisions in various market conditions.
Core Components and Functionality
1.Dynamic Baseline Calculation
Moving Average Types: The indicator allows users to select from a variety of moving average types for the baseline calculation, including Simple Moving Average (SMA), Exponential Moving Average (EMA), Hull Moving Average (HMA), Weighted Moving Average (WMA), Double EMA (DEMA), Triple EMA (TEMA), Least Squares Moving Average (LSMA), Triangular Moving Average (TMA), Kijun (from Ichimoku Kinko Hyo), and McGinley's Dynamic.
Baseline Length: Users can customize the length of the moving average, providing flexibility to adjust the sensitivity of the baseline to market movements.
Signal Line Generation: The indicator computes a dynamic signal line based on the relationship between the close price and the moving averages of the high and low prices. This signal line adapts to market volatility and trend changes.
2.SSL Baseline Integration
SSL Baseline: In addition to the primary baseline, the indicator incorporates an SSL (Semaphore Signal Level) Baseline, which further refines trend detection by considering the highs and lows over a specified period.
Dual Confirmation: The combination of the primary baseline and the SSL baseline enhances the reliability of the trend signals by requiring agreement between both baselines before generating a signal.
3.Momentum and Trend Filters
Relative Strength Index (RSI): The indicator uses the RSI to assess the momentum of price movements, filtering out signals that occur during overbought or oversold conditions.
Moving Average Convergence Divergence (MACD): The MACD is employed to identify the direction and strength of the trend, adding another layer of confirmation to the signals.
Average Directional Index (ADX): The ADX measures the strength of the trend, ensuring that signals are generated only when the market shows significant directional movement.
4.Volume Analysis
Volume Filter: An optional volume filter compares the current volume to its moving average, allowing traders to focus on signals that occur during periods of higher market activity.
5.Higher Timeframe Confirmation
Multi-Timeframe Analysis: The indicator can incorporate data from a higher timeframe, comparing the current price to the higher timeframe's baseline and signal line. This feature helps traders align their trades with the broader market trend.
6.Candlestick Pattern Recognition
Bullish Patterns: The indicator detects bullish patterns such as Bullish Engulfing, Piercing Line, Hammer, and Doji.
Bearish Patterns: It also identifies bearish patterns like Bearish Engulfing, Dark Cloud Cover, Shooting Star, and Doji.
Pattern Prioritization: The patterns are prioritized to highlight the most significant formations, which can serve as additional confirmation for trade entries and exits.
7.Price Action Zones
Support and Resistance Levels: The indicator automatically identifies pivot highs and lows to establish dynamic support and resistance levels.
Zone Visualization: It draws shaded rectangles on the chart to represent these zones, providing a clear visual aid for potential reversal or breakout areas.
ATR-Based Zone Width: The zones' thickness is dynamically calculated using the Average True Range (ATR), adjusting to the current market volatility.
Background Coloring: The chart background changes color when the price is above the maximum resistance or below the minimum support, alerting traders to significant price movements.
Interpreting the Signals
1.Buy Signals
Conditions:
Price crosses above the signal line.
RSI is below 70 (not overbought).
MACD line is above the signal line (indicating bullish momentum).
ADX is above the user-defined threshold (default is 20), confirming a strong trend.
(Optional) Volume is above its moving average if the volume filter is enabled.
(Optional) Price is above the higher timeframe baseline and signal line if the higher timeframe filter is enabled.
(Optional) A bullish candlestick pattern is detected if the candlestick pattern filter is enabled.
Visual Indicators:
An upward-pointing label with the text "BUY" appears below the price bar.
The baseline and SSL baseline lines turn to colors indicating bullish conditions.
2.Sell Signals
Conditions:
Price crosses below the signal line.
RSI is above 30 (not oversold).
MACD line is below the signal line (indicating bearish momentum).
ADX is above the user-defined threshold, confirming a strong trend.
(Optional) Volume is above its moving average if the volume filter is enabled.
(Optional) Price is below the higher timeframe baseline and signal line if the higher timeframe filter is enabled.
(Optional) A bearish candlestick pattern is detected if the candlestick pattern filter is enabled.
Visual Indicators:
A downward-pointing label with the text "SELL" appears above the price bar.
The baseline and SSL baseline lines turn to colors indicating bearish conditions.
3.Support and Resistance Zones
Interpretation:
Resistance Zones: Represent areas where the price may face selling pressure. A break above these zones can signal a strong bullish move.
Support Zones: Represent areas where the price may find buying interest. A break below these zones can signal a strong bearish move.
Background Color:
The background turns red when the price is above the maximum resistance, indicating potential overextension.
The background turns green when the price is below the minimum support, indicating potential undervaluation.
Effective Usage Strategies
1.Customization
Adjusting Baseline and SSL Settings: Traders should experiment with different moving average types and lengths to match their trading style and the specific characteristics of the asset being analyzed.
Filtering Parameters: Modify RSI, MACD, and ADX settings to fine-tune the sensitivity of the signals.
Volume and Higher Timeframe Filters: Enable these filters to add robustness to the signals, especially in volatile markets or when trading higher timeframes.
2.Combining with Other Analysis
Fundamental Analysis: Use the indicator in conjunction with fundamental insights to validate technical signals.
Risk Management: Always apply proper risk management techniques, such as setting stop-loss and take-profit levels based on the support and resistance zones provided by the indicator.
3.Backtesting
Historical Analysis: Utilize the indicator's settings to backtest trading strategies on historical data, helping to identify the most effective configurations before applying them in live trading.
4.Monitoring Market Conditions
Volatility Awareness: Pay attention to the ATR and ADX readings to understand market volatility and trend strength, adjusting strategies accordingly.
Event Considerations: Be cautious around major economic announcements or events that may impact market behavior beyond technical indications.
Indicator Inputs and Customization Options
Baseline Type and Length: Select from multiple moving average types and specify the period length.
ADX Settings: Adjust the length, smoothing, and threshold for trend strength confirmation.
Volume Filter: Enable or disable the volume confirmation filter.
Higher Timeframe Filter: Choose to incorporate higher timeframe analysis and specify the desired timeframe.
Candlestick Patterns: Enable or disable the detection of candlestick patterns for additional signal confirmation.
SSL Baseline Type and Length: Customize the SSL baseline settings separately from the primary baseline.
Price Action Zones Settings:
Zone Thickness: Adjust the visual thickness of the support and resistance zones.
Lookback Period: Define how far back the indicator looks for pivot points.
ATR Multiplier for Zone Width: Set the multiplier for ATR to determine the dynamic width of the zones.
Maximum Number of Zones: Limit the number of support and resistance zones displayed.
Pivot Bars: Customize the number of bars to the left and right used for identifying pivot highs and lows.
Conclusion
The "Mars Signals - Precision Trend Analyzer with SSL Baseline & Price Action Zones" is a versatile and powerful tool that amalgamates essential technical analysis techniques into a single, user-friendly indicator. By providing clear visual signals and incorporating multiple layers of confirmation, it assists traders in identifying high-probability trading opportunities. Whether you are a day trader, swing trader, or long-term investor, this indicator can be tailored to suit your trading style and enhance your decision-making process.
To maximize the benefits of this indicator:
Understand Each Component: Familiarize yourself with how each part of the indicator contributes to the overall signal generation.
Customize Thoughtfully: Adjust the settings based on the asset class, market conditions, and your risk tolerance.
Practice Diligently: Use demo accounts or paper trading to practice and refine your strategy before deploying it in live markets.
Stay Informed: Continuously educate yourself on technical analysis and market dynamics to make the most informed decisions.
Disclaimer
Trading financial markets involves risk, and past performance is not indicative of future results. This indicator is a tool to aid in analysis and should not be the sole basis for any trading decision. Always conduct your own research and consider consulting with a licensed financial advisor.

ADX with Alerts for Strong Trending ConditionsMad Props to Chat GPT. Basically, this thing lets you set alerts on the ADX being Above 20 AND the Positive or Negative Directional Movement Line being Above the ADX. Useful for being alerted when a strong trend is in place to look for the pullback.
Description
The ADX with Custom Alerts indicator is designed to assist traders in identifying trends and potential trading opportunities based on the Average Directional Index (ADX) and Directional Indicators (DI+ and DI-). This tool provides a clear visual representation of market strength and directional movement, enhancing decision-making in trading.
Features
ADX Calculation:
The ADX measures the strength of a trend, regardless of its direction. The indicator calculates the ADX using a configurable length and a smoothing parameter, allowing traders to customize it based on their trading preferences.
Directional Indicators:
DI+: Represents bullish momentum.
DI-: Represents bearish momentum.
The indicator plots both DI+ and DI- alongside the ADX to give a complete picture of market direction.
Alert Conditions:
The indicator includes custom alert conditions that notify traders when:
Condition 1: The ADX rises above the defined threshold (default set at 20) and DI+ is above the ADX, indicating potential bullish momentum.
Condition 2: The ADX rises above the defined threshold and DI- is above the ADX, indicating potential bearish momentum.
Visual Representation:
The ADX line is plotted in blue, with the DI+ line in green and the DI- line in red.
A dotted horizontal line represents the ADX threshold, providing a clear visual cue for trend strength.
Background Highlighting:
The indicator uses background coloring to enhance visual analysis:
Green shading indicates when DI+ is above the ADX, suggesting bullish conditions.
Red shading indicates when DI- is above the ADX, suggesting bearish conditions.
Customizable Parameters:
Traders can adjust the length of the ADX calculation, the smoothing factor, and the threshold level to suit their trading strategies and timeframes.
Usage
This indicator is particularly useful for traders looking to:
Identify strong trends and potential entry points based on trend strength.
Make informed decisions using alerts that signal important market conditions.
Enhance their trading strategies with clear visual cues and customizable parameters.

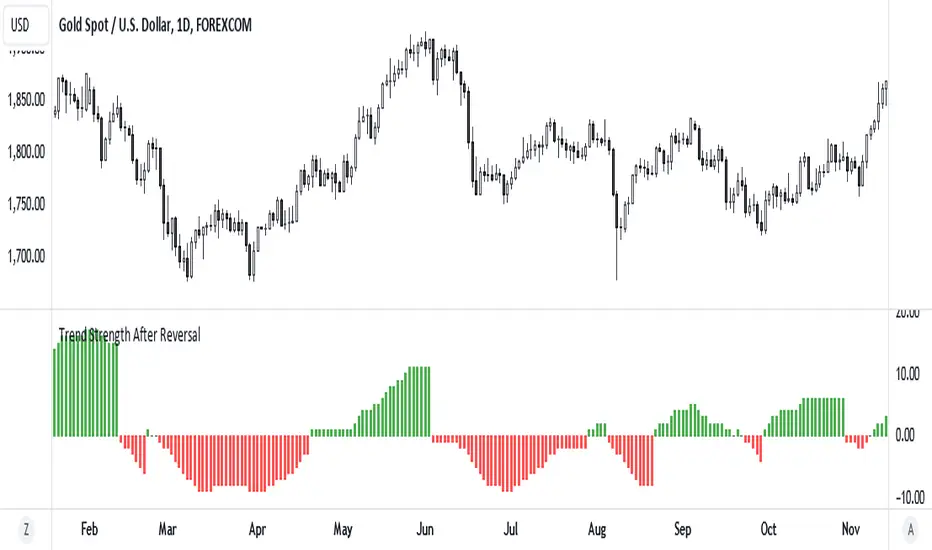
Trend Strength After Reversal
This indicator measures trend strength after the reversal.
It can catch early reversal based on engulfing candlestick pattern or just the regular reversal.
Every reversal have to be confirmed by a close above reversal pattern.
Trend strength is measured by counting subsequent closing confirming the reversal
Multi-Sector Trend AnalysisThis script, titled "Multi-Sector Trend Analysis: Track Sector Momentum and Trends," is designed to assist traders and investors in monitoring multiple sectors of the stock market simultaneously. It leverages technical analysis by incorporating trend detection and momentum indicators like moving averages and the Relative Strength Index (RSI) to offer insights into the price action of various market sectors.
Core Features:
1. Sector-Based Analysis: The script covers 20 major sectors from the NSE (National Stock Exchange) such as Auto, Banking, Energy, FMCG, IT, Pharma, and others. Users can customize which sectors they wish to analyze using the available input fields.
Technical Indicators: The script uses two core technical indicators to detect trends and momentum:
2. Moving Averages: The script calculates both fast and slow exponential moving averages (EMAs). These are critical for identifying short- and long-term price trends and crossovers, helping detect shifts in momentum.
3. Relative Strength Index (RSI): A well-known momentum indicator that shows whether a stock is overbought or oversold. This script uses a 14-period RSI to gauge the strength of each sector.
4. Trend Detection: The script identifies whether the current market trend is "Up" or "Down" based on the relationship between the fast and slow EMAs (i.e., whether the fast EMA is above or below the slow EMA). It highlights this trend visually in a table format, allowing quick and easy trend recognition.
5. Gain/Loss Tracking: This feature calculates the percentage gain or loss since the last EMA crossover (a key point in trend change), giving users a sense of how much the price has moved since the trend shifted.
6. Customizable Table for Display: The script displays the analyzed data in a table format, where users can view each sector's:
Symbol
Trend (Up or Down)
RSI Value
Gain/Loss Since the Last EMA Crossover
This table is customizable in terms of size and color theme (dark or light), providing flexibility in presentation for different charting styles.
How It Works:
Sector Selection: Users can input up to 20 different sector symbols for analysis.
Moving Averages: Users can define the period lengths for both the fast and slow EMAs to suit their trading strategies.
Table Options: Choose between different table sizes and opt for a dark theme to enhance the visual appearance on charts.
How to Use:
Select the symbols (sectors) that you want to track. The script includes pre-configured symbols for major sectors on the NSE, but you can modify these to suit your needs.
Adjust the fast and slow EMA lengths to your preference. A common setting would be 3 for the fast EMA and 4 for the slow EMA, but more conservative traders might opt for higher values.
Customize the table size and theme based on your preference, whether you want a compact table or a larger one for easier readability.
Why Use This Script:
This script is ideal for traders looking to:
Monitor multiple market sectors simultaneously.
Identify key trends across sectors quickly.
Understand momentum and detect potential reversals through RSI and EMA crossovers.
Stay informed on sector performance using a clear visual table that tracks gains or losses.
By using this script, traders can gain better insights into sector-based trading strategies, improve their sector rotation tactics, and stay informed about the broader market environment. It provides a powerful yet easy-to-use tool for both beginner and advanced traders.

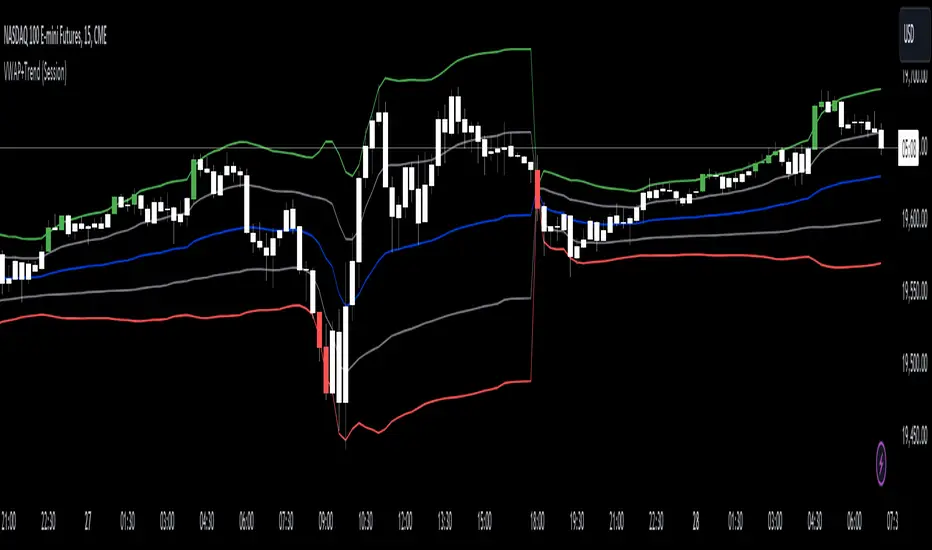
VWAP with Trend Alerts [CrossTrade]The VWAP with Trend Alerts indicator is designed to provide a comprehensive visual and analytical tool for traders using the Volume Weighted Average Price (VWAP) along with additional features like custom bar coloring and trend-based signal alerts.
Key Components and Functionalities:
1. VWAP Calculation: The core of this indicator is the VWAP, which represents the average price of an asset, weighted by volume. It's a popular tool among traders to identify the general direction and strength of a trend, and for assessing entry and exit points.
2. Standard Deviation Bands: Surrounding the VWAP are multiple bands calculated based on standard deviation values. These bands serve as dynamic support and resistance levels. The script allows up to three bands, each with customizable multipliers, giving insights into price volatility and potential breakout or reversal points.
3. Bar Coloring Options:
- Color All Bars: When enabled, all bars on the chart are colored based on whether they close above (green) or below (red) the VWAP.
- Trend Bars Only: This option, when selected, colors only the bars that close beyond the second standard deviation band. It helps in identifying stronger trends and significant market movements.
4. Buy and Sell Signal Conditions: The script includes conditions for buy and sell signals specifically tailored for trend bars. A buy signal is generated when a bar closes above both the VWAP and the upper second standard deviation band, indicating a potential strong uptrend. Conversely, a sell signal is triggered when a bar closes below both the VWAP and the lower second standard deviation band, suggesting a strong downtrend.
5. Alert Conditions: To aid in timely decision-making, the script features alert conditions corresponding to the buy and sell signals.
Usage and Application:
- For Trend Identification: The VWAP and its bands can help identify the prevailing market trend. Bars closing consistently above the VWAP suggest an uptrend, while those closing below indicate a downtrend.
- Volatility Assessment: The standard deviation bands provide a visual representation of market volatility. Narrower bands suggest low volatility, while wider bands indicate high volatility.
- Signal Alerts for Trading: The buy and sell signals, especially those filtered by the trend bars condition, can be valuable for traders looking for strong movement confirmations.
Flexibility and Customization:
This indicator is highly customizable and builds off of the core logic found in standard VWAP indicators. By allowing traders to adjust the standard deviation multipliers and choose their preferred bar coloring strategy. It caters to various trading styles, whether focusing on the broader market trend or pinpointing significant trend-based movements.
TASC 2024.09 Precision Trend Analysis█ OVERVIEW
This script introduces an approach for detecting and confirming trends in price series based on digital signal processing principles, as presented by John Ehlers in the "Precision Trend Analysis" article from the September 2024 edition of TASC's Traders' Tips .
█ CONCEPTS
Traditional trend-following indicators, such as moving averages , are lowpass filters that pass low-frequency components in a series and remove high-frequency components. Because lowpass filters preserve lengthy cycles in the data while attenuating shorter cycles, such filters have unavoidable lag that impacts the timeliness of trading signals.
In his article, John Ehlers presents an alternative approach that combines two highpass filters with different lengths to remove undesired high-frequency content via cancellation . Highpass filters have nearly zero lag. As such, the resulting trend indicator from this approach is very responsive to changes in the price series, with peaks and valleys that closely align with those of the price data. The indicator signifies an uptrend when its value is positive (i.e., above the balance point) and a downtrend when it is negative.
Subsequently, John Ehlers demonstrates that one can use the trend indicator's rate of change (ROC) to determine the onset of new trend movements. The ROC is zero at peaks and valleys in the trend indicator. Therefore, when the ROC crosses above zero, it signifies the onset or continuation of an uptrend. Likewise, the ROC crossing below zero indicates the onset or continuation of a downtrend. Note, however, that because the ROC does not preserve lower-frequency information, it can produce whipsaw trading signals in sideways or continuously trending price series.
This script implements both the trend indicator and its ROC along with the following on-chart signals:
• Green and red arrows that indicate the possible onset or continuation of an uptrend and downtrend, respectively
• Bar and plot colors that signify the sign (direction) of the trend indicator
█ CALCULATIONS
The math behind the trend indicator comes from digital filter design principles. The first step applies a digital highpass filter that attenuates long cycles with periods above the user-specified critical period. The default value is 250 bars, representing roughly one year for instruments such as stocks on the daily timeframe. The next step applies a highpass filter with a shorter period (40 bars by default). The difference between these filters determines the trend indicator, which preserves cyclic components between 40 and 250 bars by default while attenuating and eliminating others. The ROC represents the scaled one-bar difference in the trend indicator.

TASC 2024.08 Volume Confirmation For A Trend System█ OVERVIEW
This script demonstrates the use of volume data to validate price movements based on the techniques Buff Pelz Dormeier discusses in his "Volume Confirmation For A Trend System" article from the August 2024 edition of TASC's Traders' Tips . It presents a trend-following system implementation that utilizes a combination of three indicators: the Average Directional Index (ADX), the Trend Thrust Indicator (TTI), and the Volume Price Confirmation Indicator (VPCI).
█ CONCEPTS
In his article, Buff Pelz Dormeier recounts his search for an optimal trend-following strategy enhanced with volume data, starting with a simple system combining the ADX , MACD , and OBV indicators. Even in these early tests, the author observed that the volume confirmation from OBV notably improved trading performance. Subsequently, the author replaced OBV with his VPCI, which considers the proportional weights of volume and price, to enhance the validation of trend momentum. Lastly, the author explored the inclusion of his TTI, a modified MACD that features volume-based enhancements, as a strategy component for improved trend-following performance.
According to the author's research, the ADX+TTI+VPCI system outperformed similar strategies he tested in the article, yielding significantly higher returns and enhanced perceived reliability. Because the system's design revolves around catching pronounced trends, it performs best with a portfolio of individual stocks. The author applies the system in the article by allocating 5% of the equity to long positions in S&P 500 components that meet the ADX+TTI+VPCI entry criteria (see the Calculations section below for details). He uses the proceeds from closing positions to enter new positions in other stocks meeting the screening criteria, holding any excess proceeds in cash.
█ CALCULATIONS
The TTI is similar to the MACD. Its calculation entails the following steps:
Calculate fast (short-term) and slow (long-term) volume-weighted moving averages (VWMAs).
Compute the volume multiple (VM) as the square of the ratio of the fast VWMA to the slow VWMA.
Adjust these averages by multiplying the fast VWMA by the VM and dividing the slow VWMA by the VM.
Calculate the difference between the adjusted VWMAs to determine the TTI value, and take the average of that series to determine the signal line value.
The VPCI utilizes differences and ratios between VWMAs and corresponding simple moving averages (SMAs) to provide an alternative volume-price confirmation tool. Its calculation is as follows:
Subtract the slow SMA from the VWMA of the same length to calculate the volume-price confirmation/contradiction (VPC) value.
Divide the fast VWMA by the corresponding fast SMA to determine the volume-price ratio (VPR).
Divide the short-term VWMA by the long-term VWMA to calculate the VM.
Compute the VPCI as the product of the VPC, VPR, and VM values.
The long entry criteria of the ADX+TTI+VPCI system are as follows:
The ADX is above 30.
The TTI crosses above its signal line.
The VPCI is above 0, confirming the trend.
Signals to close positions occur when the VPCI is below 0, indicating a contradiction .
NOTE: Unlike in the article, this script applies the ADX+TTI+VPCI system to one stock at a time , not a portfolio of S&P 500 constituents.
█ DISCLAIMER
This strategy script educates users on the trading system outlined by the TASC article. By default, it uses 10% of equity as the order size and a slippage amount of 5 ticks. Traders should adjust these settings and the commission amount when using this script.

Multi-Timeframe Trend TableThe "Multi-Timeframe Trend Table" indicator is a tool that consolidates a variety of critical trading metrics into a single, easy-to-read table format. This indicator is especially useful for traders who need to analyze multiple timeframes and indicators simultaneously to make informed trading decisions. By displaying a broad spectrum of data including trend information, rangebound status, volatility levels, VWAP (Volume Weighted Average Price), and specific candlestick patterns, the indicator provides a comprehensive overview of market conditions across different timeframes.
Functionality and Components
At its core, the indicator provides real-time insights into market trends by showing whether each timeframe is experiencing an upward, downward, or neutral trend based on simple moving averages. This is complemented by the "Rangebound" status, which indicates whether the price is trading within a defined range, giving insights into market consolidation periods. This can be critical for identifying breakouts or breakdowns from established ranges.
Volatility Measurement
Another key feature of the indicator is the "Volatility" column, which rates the market's volatility on a scale from 1 to 10. This feature uses the Average True Range (ATR) to assess how drastically prices are changing within a given timeframe, providing a numerical value that helps traders understand the intensity of price movements. High volatility levels (scores above 6) are highlighted, which can be crucial for strategies that prefer high volatility.
VWAP and Candlestick Patterns
The indicator also displays the VWAP, which is essential for traders who focus on volume as it shows the average price a security has traded at throughout the day, based on both volume and price. It is especially useful for traders looking to confirm trend directions or catch potential reversals. Additionally, the "Candle" column enhances the indicator's utility by identifying specific candlestick patterns like Doji, Hammer, Inverted Hammer, Bullish Engulfing, and Bearish Engulfing, which are pivotal for pinpointing momentum changes and potential entry or exit points.
Usage Strategy
Traders can utilize this indicator by setting up specific rules based on the information provided. For instance, a possible strategy could involve entering a trade when a Bullish Engulfing pattern appears in a low-volatility environment as indicated by a volatility score under 6, suggesting a potential uptrend start with limited downside risk. Similarly, a trader might consider exiting a position or taking a short position when a Bearish Engulfing pattern is identified during high volatility periods, signaling possible sharp price declines.
Adaptability and Customization
An added advantage is the indicator’s adaptability; traders can customize which columns to display based on their trading preferences and strategies. Whether focusing on trends, volatility, or candlestick patterns, users can configure the table to match their specific needs. This makes it a versatile tool suited for various trading styles and objectives, from day trading to swing trading.
Overall Utility
Overall, the "Multi-Timeframe Trend Table" indicator is an invaluable asset for traders who manage multiple instruments across different timeframes, offering a bird's-eye view of the markets in one concise table. It aids in quick decision-making by providing all necessary data points at a glance, reducing the need to switch between multiple charts and potentially missing critical market movements. By integrating trend analysis with volatility and candlestick patterns, it equips traders with a powerful synthesis of technical analysis tools to enhance their trading strategies and improve market timing.

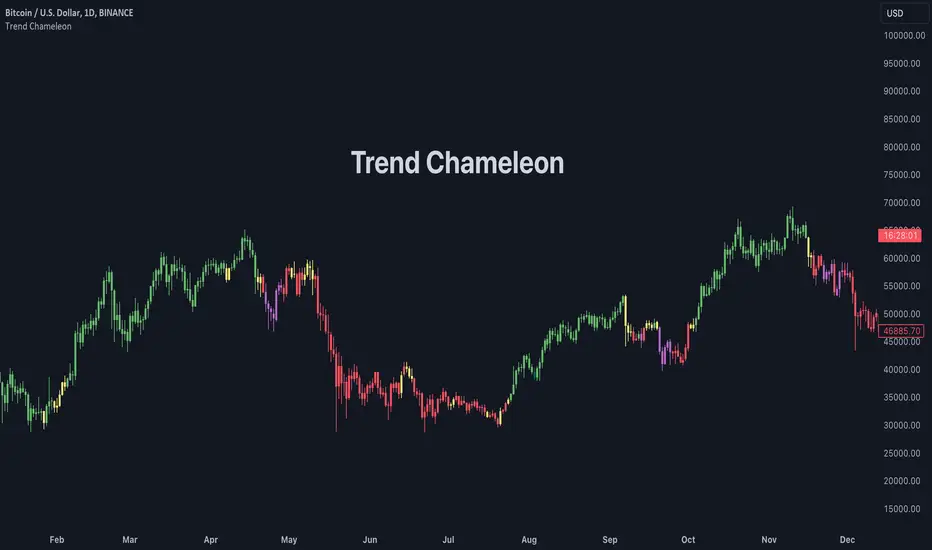
Trend ChameleonThe Trend Chameleon, originally developed by Alex Cole for the Bloomberg Terminal, is a powerful tool designed to simplify trend identification and illuminate potential trading opportunities. It leverages a clear visual display to decode market movements, making it useful for traders of all experience levels.
🟠 Overview
Here's an illustration of how the indicator performs for ES (S&P 500 E-mini Future) on the daily chart:
Trend Chameleon employs a color-coded candle scheme, with each color corresponding to a specific level of trend strength. Purple candles represent the strongest bearish trends, while teal candles signal the most potent bullish momentum. Between these extremes lie red, yellow, and green candles, providing a spectrum of trend direction. This intuitive color coding allows you to quickly grasp the prevailing market sentiment and identify potential entry and exit points for your trades.
🟠 Algorithm
Under the hood, Trend Chameleon evaluates four conditions to provide a directional strength score:
1. Whether the MACD value is positive.
2. Whether the SMA 50 of open prices is above the SMA 50 of the close prices.
3. Whether the ROC indicator value is positive.
4. Whether the current close price is above the SMA 50.
The total number of fulfilled conditions (0 to 4) determines the trend strength, with 0 indicating the most bearish and 4 signifying the strongest bullish trend. This score is then visually represented by coloring the bars on the chart.
🟠 Note
If you don't see the bars being properly colored after adding this indicator, please ensure Trend Chameleon is positioned on top of all other indicators in your chart. This can be easily achieved by hovering over the indicator's name, clicking the three dots, selecting "Visual Order," and then choosing "Bring to front."
Trend Catcher Strategywhat is Trend Catcher Strategy?
it is a strategy that opens long or short positions in the direction of the trend.
what it does?
TCS detects trend formations using its own unique method. Then, it opens a position in the direction of the trend and closes a part of the opened transaction (half according to default values) when the price reaches a certain level, and moves the remaining position to the point where it thinks the trend is over. You can easily understand how it works by looking at the images:
how it does it?
It obtains a value called a "limit" by dividing the difference between the highest value and the lowest value in a certain range (that is, the vector sum) to the sum of the lengths of the candles in a certain range (the total distance traveled). then multiplies this by 100 to get a percentage value. The closer this value is to 100, the stronger the trend.

Trend Tide Oscillator [UAlgo]🔶 Description:
The "Trend Tide Oscillator " is a technical analysis tool designed to identify potential trend reversals and overbought/oversold conditions in the market. It calculates an oscillator based on the Commodity Channel Index (CCI) and then applies smoothing techniques to provide a clearer view of market momentum.
🔶 Key Features:
Oscillator Calculation : The indicator calculates an oscillator based on the Commodity Channel Index (CCI), which is a momentum-based oscillator used to identify overbought and oversold conditions.
Smoothing : Smoothing techniques are applied to the oscillator to reduce noise and provide a clearer view of market momentum. This helps traders in identifying trends more effectively.
Support and Resistance Zones : The indicator plots support and resistance zones based on the highest and lowest values of the oscillator over a specified lookback (default 50) period. These zones can help traders identify potential areas of price reversal. The indicator considers volatility when plotting the support and resistance zones. This aims to create more adaptable levels that account for fluctuating market conditions.
Visualization : The indicator visually represents overbought and oversold conditions with shapes (⚠️), aiding traders in quickly identifying potential entry or exit points.
Customization : Users can adjust parameters such as oscillator length, smoothing, and overbought/oversold levels, support and resistance lookbacks according to their trading preferences.
🔶 Disclaimer :
This indicator is provided for informational and educational purposes only and should not be considered as financial advice. Trading in the financial markets involves risk, and users should conduct their own research and analysis before making any investment decisions.

RMI Trend Sync - Strategy [presentTrading]█ Introduction and How It Is Different
The "RMI Trend Sync - Strategy " combines the strength of the Relative Momentum Index (RMI) with the dynamic nature of the Supertrend indicator. This strategy diverges from traditional methodologies by incorporating a dual analytical framework, leveraging both momentum and trend indicators to offer a more holistic market perspective. The integration of the RMI provides an enhanced understanding of market momentum, while the Super Trend indicator offers clear insights into the end of market trends, making this strategy particularly effective in diverse market conditions.
BTC 4h long/short performance
█ Strategy: How It Works - Detailed Explanation
- Understanding the Relative Momentum Index (RMI)
The Relative Momentum Index (RMI) is an adaptation of the traditional Relative Strength Index (RSI), designed to measure the momentum of price movements over a specified period. While RSI focuses on the speed and change of price movements, RMI incorporates the direction and magnitude of those movements, offering a more nuanced view of market momentum.
- Principle of RMI
Calculation Method: RMI is calculated by first determining the average gain and average loss over a given period (Length). It differs from RSI in that it uses the price change (close-to-close) rather than absolute gains or losses. The average gain is divided by the average loss, and this ratio is then normalized to fit within a 0-100 scale.
- Momentum Analysis in the Strategy
Thresholds for Decision Making: The strategy uses predetermined thresholds (pmom for positive momentum and nmom for negative momentum) to trigger trading decisions. When RMI crosses above the positive threshold and other conditions align (e.g., a bullish trend), it signals a potential long entry. Similarly, crossing below the negative threshold in a bearish trend may trigger a short entry.
- Super Trend and Trend Analysis
The Super Trend indicator is calculated based on a higher time frame, providing a broader view of the market trend. This indicator uses the Average True Range (ATR) to adapt to market volatility, making it an effective tool for identifying trend reversals.
The strategy employs a Volume Weighted Moving Average (VWMA) alongside the Super Trend, enhancing its capability to identify significant trend shifts.
ETH 4hr long/short performance
█ Trade Direction
The strategy offers flexibility in selecting the trading direction: long, short, or both. This versatility allows traders to adapt to their market outlook and risk tolerance, whether looking to capitalize on bullish trends, bearish trends, or a combination of both.
█ Usage
To effectively use the "RMI Trend Sync" strategy, traders should first set their preferred trading direction and adjust the RMI and Super Trend parameters according to their risk appetite and trading goals.
The strategy is designed to adapt to various market conditions, making it suitable for different asset classes and time frames.
█ Default Settings
RMI Settings: Length: 21, Positive Momentum Threshold: 70, Negative Momentum Threshold: 30
Super Trend Settings: Length: 10, Higher Time Frame: 480 minutes, Super Trend Factor: 3.5, MA Source: WMA
Visual Settings: Display Range MA: True, Bullish Color: #00bcd4, Bearish Color: #ff5252
Additional Settings: Band Length: 30, RWMA Length: 20
