Trendy Bar Trend ColorTrendy Bar Trend Color
Inspired by trend candlestick charts on other trading platforms. Changes bar colors to stay in trend much like Heikin Ashi candles without the ATR price distortion. This is done by comparing the HL2 and/or Open-Close values of current candlestick to the prior candlestick.
Cari dalam skrip untuk "trend"


Trend with ADX, multiple EMAs - Buy & Sell✔ Trend Direction
Via DI+ > DI–
✔ Trend Strength
Via ADX
✔ Fast Entry Signals
5/8 EMA crossovers
✔ Larger Trend Confirmation
13/48 EMA crossovers
✔ Macro Trend
EMA 200
✔ Intraday Bias
VWAP
✔ Visual Trend (background)
✔ Alerts for signals + trend shifts

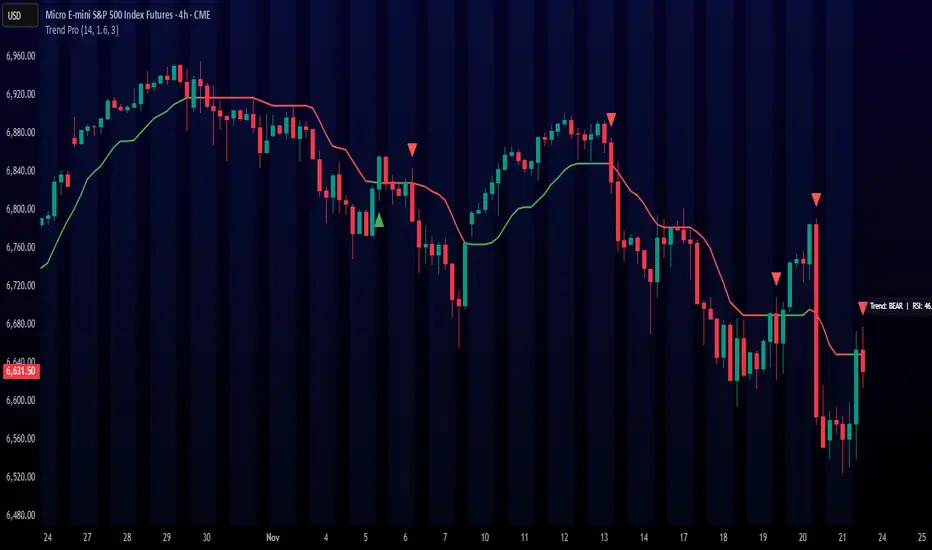
Trend ProTrend Pro is a volatility-adaptive trend and momentum system designed for scalping, day trading, and short-term swing trading.
It uses an ATR-based dynamic trend line (Alpha-Trend style) to identify momentum shifts and confirm directional strength.
Unlike traditional moving averages, Trend Pro adapts to volatility and reacts faster during expansions while filtering noise during chop.
🔍 How Trend Pro Works
Trend Pro builds a dynamic volatility channel using ATR and tracks whether price stays above or below this adaptive line.
When price crosses and closes on the opposite side, it suggests a shift in market control.
When price closes above the line → the trend turns BULLISH (green)
When price closes below the line → the trend turns BEARISH (red)
This gives a clear, visual trend state without repainting.
Tips for Best Performance:
✔ Avoid signals directly inside major ranges or sideways chop
✔ Strongest entries come after small pullbacks into the line
✔ Combine signals with:
Market structure
Key swing highs/lows
Liquidity sweeps
Session timing (NYSE open, power hour)
✔ Trend Pro works best when used with the trend, not counter-trend
Enjoy!
Trend 1EMA Trend tracker.
This script plots two EMAs: a short-term EMA (line) and a long-term EMA (dots). The line color turns green when the short EMA is above the long EMA, and red when it’s below. Users can select a custom timeframe for the EMA calculation using the input settings. A shaded area is drawn between the two EMAs to visually represent the trend zone.
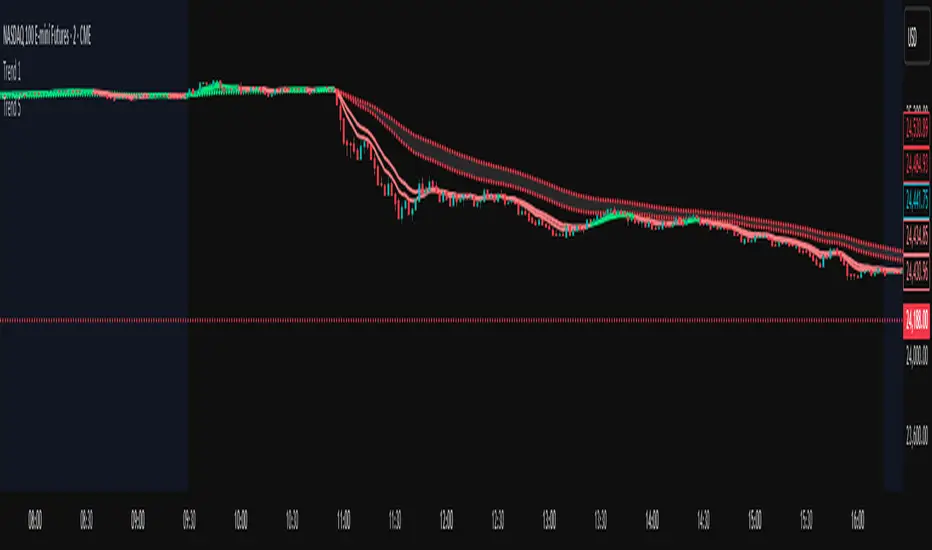
Trend 5EMA trend tracker.
This script plots two EMAs: a short-term EMA (line) and a long-term EMA (dots). The line color turns green when the short EMA is above the long EMA, and red when it’s below. Users can select a custom timeframe for the EMA calculation using the input settings. A shaded area is drawn between the two EMAs to visually represent the trend zone.

Trend Compass (Manual)## Trend Compass (Manual) - A Discretionary Trader's Dashboard
### Summary
Trend Compass is a simple yet powerful dashboard designed for discretionary traders who want a constant, visual reminder of their market analysis directly on their chart. Instead of relying on automated indicators, this tool gives you **full manual control** to define the market state across different timeframes or conditions.
It helps you stay aligned with your higher-level analysis (e.g., HTF bias, current market structure) and avoid making impulsive decisions that go against your plan.
### Key Features
- **Fully Manual Control:** You decide the trend. No lagging indicators, no confusing signals. Just your own analysis, displayed clearly.
- **Multiple Market States:** Define each row as an `Uptrend`, `Downtrend`, `Pullback`, or `Neutral` market.
- **Customizable Rows:** Display up to 8 rows. You can label each one however you like (e.g., "D1", "H4", "Market Structure", "Liquidity Bias").
- **Flexible Panel:** Change all colors, text sizes, and place the panel in any of the 9 positions on your chart.
- **Clean & Minimalist:** Designed to provide essential information at a glance without cluttering your chart.
### How to Use
1. **Add to Chart:** Add the indicator to your chart.
2. **Open Settings:** Go into the indicator settings.
3. **Configure Rows:**
- In the "Rows (Manual Control)" section, set the "Number of rows" you want to display.
- For each row, give it a custom **Label** (e.g., "m15").
- Select its current state from the dropdown menu (`Uptrend`, `Downtrend`, etc.).
- To remove a row, simply set its state to `Hidden`.
4. **Customize Style:**
- In the "Panel & Visual Style" section, adjust colors, text sizes, and the panel's position to match your chart's theme.
This tool is perfect for price action traders, ICT/SMC traders, or anyone who values a clean chart and a disciplined approach to their analysis.

Trend Following S/R Fibonacci StrategyTrend Following S/R Fibonacci Strategy
Trend Following S/R Fibonacci Strategy

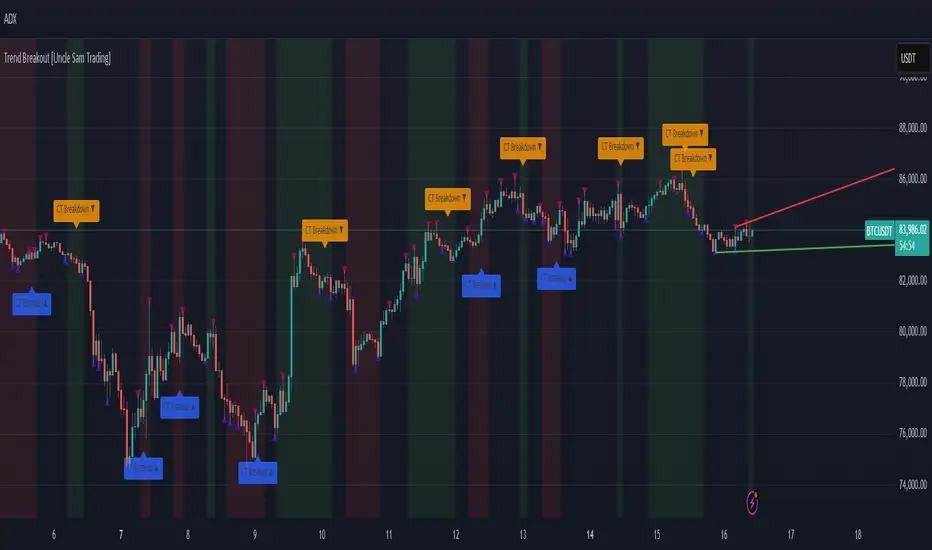
Trend Breakout [Uncle Sam Trading]Trend Breakout Indicator
Overview
The Trend Breakout Indicator is a powerful, non-repainting tool designed to help traders identify high-probability breakout and trend reversal setups on any market and timeframe. By leveraging pivot points, this indicator draws dynamic support and resistance channels, highlights counter-trend breakouts, and provides visual cues for market direction. It’s ideal for traders looking to simplify their analysis while targeting key price levels for entries and exits.
Key Features
Pivot-Based Channels: Draws a red upper channel (resistance) and a green lower channel (support) by connecting recent pivot highs and lows.
Counter-Trend Breakout Signals:
Blue “CT Breakup” signal (▲) when the price breaks above the upper channel during a downtrend, indicating a potential reversal or pullback.
Orange “CT Breakdown” signal (▼) when the price breaks below the lower channel during an uptrend, signaling a potential downmove.
Trend Visualization: Background color shifts to green for uptrends and red for downtrends, making it easy to gauge market direction.
Customizable Settings: Adjust pivot detection sensitivity with “Pivot Left Bars” (default: 5) and “Pivot Right Bars” (default: 1), and control channel extension with “Channel Extension Bars” (default: 50).
Optional Trend Signals: Enable “Show Trend Change Signals” to display trend shifts with green (uptrend) or red (downtrend) arrows.
Alert Conditions: Set alerts for counter-trend breakouts and trend changes directly on TradingView.
Example Performance (BTCUSDT, 1-Hour Chart)
On the BTCUSDT 1-hour chart:
A “CT Breakdown” signal appeared on April 6 at 8:00 AM at $82,700, followed by a drop to $74,400 within hours—a 10% move.
A “CT Breakup” signal occurred on April 9 at 1:00 AM at $76,600, leading to a rally to $86,600 in a few hours—a 9% gain.
These examples highlight the indicator’s ability to spot significant price movements, though results depend on market conditions, your trading style, and risk management.
Settings
Pivot Left Bars (default: 5): Number of bars to the left for pivot detection.
Pivot Right Bars (default: 1): Number of bars to the right for pivot confirmation (ensures non-repainting signals).
Channel Extension Bars (default: 50): How far the channels extend to the right.
Show Pivot Points (default: true): Displays small triangles at pivot highs (maroon) and lows (navy).
Show Counter-Trend Breakout Signals (default: true): Shows CT Breakup and CT Breakdown signals.
Show Trend Change Signals (default: false): Displays trend shift arrows when enabled.
How to Use
Add the indicator to your chart via TradingView’s indicator library.
Adjust the settings to match your trading style and timeframe.
Watch for “CT Breakup” and “CT Breakdown” signals to identify potential trade setups.
Use the background color (green/red) to confirm the current trend.
Set alerts for breakouts or trend changes to stay updated on key signals.
Always combine with proper risk management and your own analysis—past performance is not a guarantee of future results.
Notes
The indicator is non-repainting, meaning signals are confirmed and won’t disappear after they form.
Works on any market (crypto, forex, stocks) and timeframe, such as the BTCUSDT 1-hour chart shown.
Performance varies based on market volatility and your trading strategy.
This is a free tool created to support the TradingView community—feedback is welcome in the comments!
Disclaimer
Trading involves risk, and this indicator is not a guaranteed predictor of future price movements. Always conduct your own analysis and manage risk appropriately. The examples provided (e.g., BTCUSDT signals) are for educational purposes only and reflect past performance, which may not repeat.
Trend MVery simple script where all you need is to put the time frame you are, just put min number
for example 5 min = 5 at Min
1 hour =60
4 hour =240 etc
green are bullish trend
red is bearish
the trend is based on weekly combination of High and Low with no security MTF ,at this way I attempt to put the possible weekly support and resistance to a much lower TF
so it just idea . let me know what you think:)

Trend StepTrend Follow Indicator
HTF "Auto" setting is:
< 4Hour : "240"
>= 4Hour and Intraday : "D"
D: Weekly
W: Monthly
M: Yearly
Trend Score by KIVANÇ fr3762Trend Score compares close prices between last close with previous closes by a certain period of time.
It's like momentum but gives a score +1 when close price is equal to or above (defaultly) 10 bars ago and gives a score of -1 when below.
calculation continues from default length to the 2 times of length.
Defaultly (for 10 bars length)
If Trend Score converges to 10; that means there's a strong uptrend
conversely if Trend Score converges to -10; that means a strong downtrend market is on.

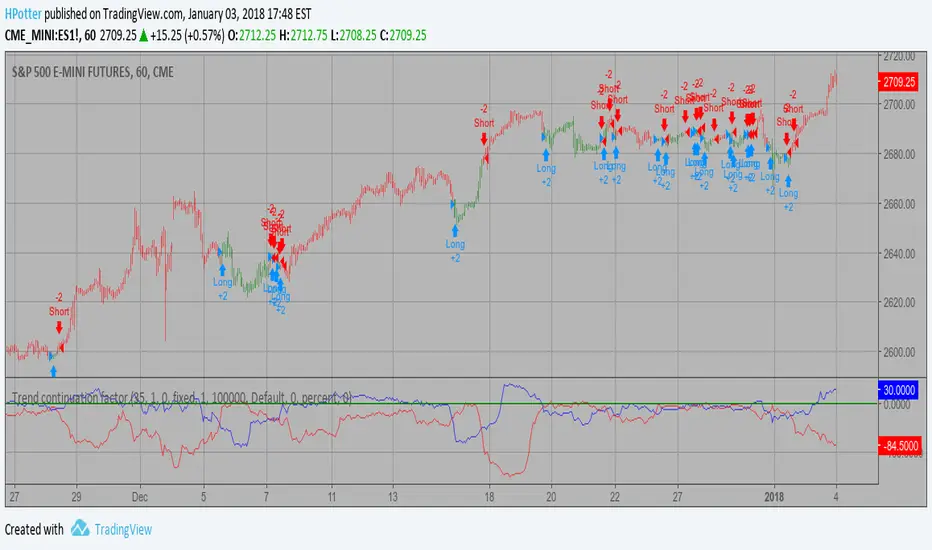
Trend continuation factor Backtest Trend continuation factor, by M.H. Pee
The related article is copyrighted material from Stocks & Commodities.
You can change long to short in the Input Settings
WARNING:
- For purpose educate only
- This script to change bars colors.
Trend continuation factor Strategy Trend continuation factor, by M.H. Pee
The related article is copyrighted material from Stocks & Commodities.
WARNING:
- This script to change bars colors.

Trend continuation factor, by M.H. PeeTrend continuation factor, by M.H. Pee
The related article is copyrighted material from Stocks & Commodities.

Trend Quality IndicatorDescription
This indicator is my interpretation in Pinescript of the "Trend-Quality Indicator" by David Sepiashvili.
The Trend Quality indicator (Q-indicator) is an attempt to estimate trend in relation to noise. It answers the long-standing question of whether a trend change qualifies as significant and promising, or insignificant and better ignored. In terms of noise, trend estimation not only determines whether the trend is reliable, but also allows you to measure its strength gradually. Thus, regardless of their prices, trends of various securities can easily be compared to each other or against any index.
The Trend Quality indicator (or Q-indicator) is a trend detection and estimation tool that is based on a two-step filtering technique. It measures cumulative price changes over term-oriented semi-cycles and relates them to “noise.” The approach reveals congestion and trending periods of the price movement and focuses on the most important trends, evaluating their strength in the process. The indicator is presented in a centered oscillator and banded oscillator format.
Calculation and Logic
To estimate the price dynamics, the cumulative price change (CPC) indicator is used, which measures the amount that the price has changed from a fixed starting point within a given semi-cycle. The CPC indicator is calculated as a cumulative sum of differences between the current and previous prices over the period from the fixed starting point t0. The trend within the given semi cycle can be found by calculating the moving average of the cumulative price change:
Trend = MA (CPC, m, t => t0)
Segmenting the price time series and constructing trends within the extracted semi-cycles offers the smallest average gap between actual and averaged data points. This results in a better fit of the real price dynamics.
Estimating Trend Performance
A basic criterion for estimating trend performance is the amount the trend changes over up or down semi-cycles. If there is little or no visible progress in the trend, it may be considered as nonefficient. Further, significant changes in trend may be considered as promising trading opportunities, but the term “significant” is relative and subject to interpretation.
The Q-indicator is calculated by dividing trend by noise with an appropriate correction factor.
The denominator of the Q-indicator — noise — can be defined as the average deviation of the cumulative price change from the trend. To determine linear noise, first we calculate
the absolute value of the difference between CPC and trend, and then smooth it over the n-point period:
Noise1 = MA(I CPC Trend I,n)
High positive values suggest strong uptrend, low negative values signify strong downtrend, and values fluctuating around the zero level indicate that trend and noise are in equilibrium, i.e., non-trending conditions might be present.
The root mean square noise, similar to the conventional standard deviation, can be derived by summing the squares of the difference between CPC and trend over each of the preceding n-point periods, dividing the sum by n, and calculating the square root of the result.
The Q-indicator is intended to measure trend activity. Some benchmarks can be used to determine the strength of a trend. In the range of Q-indicator values from -1 to +1, the trend is buried beneath noise. It is preferable to stay out of this zone. The greater the Q, the less the risk of trading exceeds this level (absolute value of Q>2), it can be qualified as promising.
Readings in the range from +2 to +5, or from -2 to -5, can indicate moderate trending, and readings above Q=+5 or below Q=-5 indicate strong trending. Strong upward trending often leads to the security’s overvaluing, and strong downward trending often results in the security’s undervaluing. Readings exceeding strong trending benchmarks can indicate overbought or oversold conditions and signal that price action should be monitored closely.
Input Parameters’ Description
Fast Length - the number of bars used in calculation of fast SMA of Trending Periods.
Slow Length - the number of bars used in calculation of slow SMA of Trending Periods.
Trend Length - the number of bars upon which the trend is defined.
Noise Type - defines mechanism of defining noise: linear or root mean square.
Noise Length - the number of bars upon which noise is determined.
Correction Factor - multiplier used in noise calculation.
Threshold Value - In the range of Q-indicator values from -1 to +1, the trend is buried beneath noise. It is preferable to stay out of this zone. The greater the threshold Value of Q-Indicator, the less the risk of trading exceeds this level, it can be qualified as promising. Readings in the range from +2 to +5, or from -2 to -5, can indicate moderate trending, and readings above Q=+5 or below Q=-5 indicate strong trending.
Plots
• Green = buying pressure
• Red = selling pressure
• Yellow = sideways
• ZeroLine = the zero level
In the provided script, multi-timeframe analysis is achieved using the request.security function, which retrieves data from a different timeframe than the one on which the script is running.
Explanation of Multi-Timeframe Logic in Multi-Timeframe selection
• This option retrieves the Trend Quality (TQ) from a higher timeframe if the current chart is intraday.
• The higher timeframe is specified in minutes by the user and converted to a Pine Script timeframe string.
• If the current chart is not intraday or no higher timeframe is specified, the TQ is taken from the current timeframe
Summary:
• Trend Quality Indicator measures established TREND,
• can be used on different timeframes,
• works well on different timeframes,
• the threshold of 2 to 5 should be appropriate for most instruments. It can be modified in chart settings to adapt to your strategy.
The Trend Quality Indicator doesn't predict the future. It is intended to help traders assess the strength of the current trend, giving them a better understanding of the market conditions to make more informed trading choices.
Further Reading
1. "Trend-Quality Indicator" by David Sepiashvili. Technical Analysis of Stocks & Commodities, April 2004.

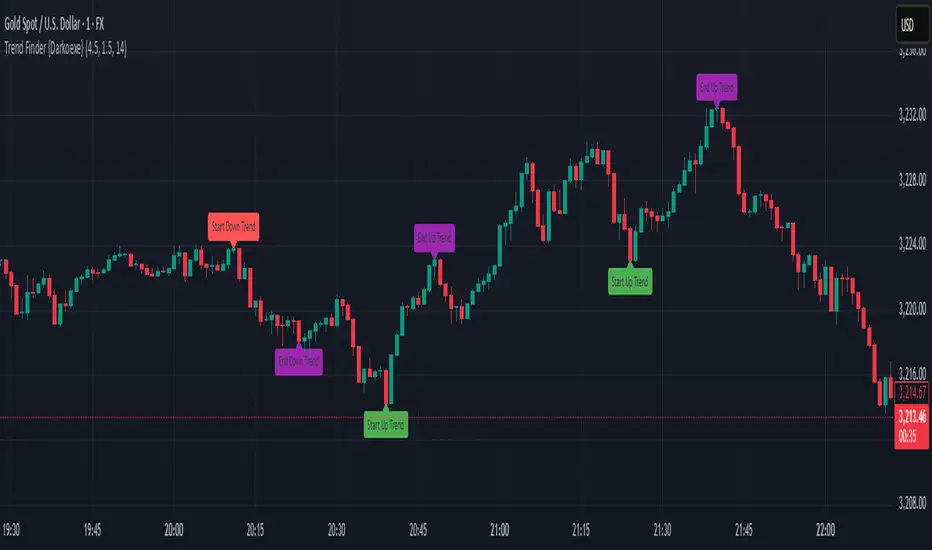
Trend Finder {Darkoexe}This indicator displays the end and start of trends using an ATR factor.
The ATR with trend factor is used to determine the minimum length for a trend to be considered a trend.
The ATR against trend factor is used to determine the minimum length price needs to move against a trend for it to break the trend.
The ATR factors are multiplied with the ATR to determine these lengths.
The labels indicate the starts and ends of trends;
The green label indicates the start of an up trend.
The red label indicates the start of a down trend.
The black/gray label indicates the start of a trend and the end of another trend at the same location.
The purple/pink label indicates the end of a trend.
All the label colors can be changed.
IMPORTANT NOTE: This is a repainting indicator, it should only be used to back test and analyze previous trends. Do not use this indicator for live trading.
Trend and Trendline DetectorTrend and Trendline Detector
Overview
The Trend and Trendline Detector indicator provides both major and minor trend analysis using Simple Moving Averages (SMA) and automatically plots dynamic support and resistance trendlines based on pivot highs and lows.
Key Features
Major Trend Detection: Uses a configurable SMA to determine primary market direction.
Minor Trend Visualization: Optional minor SMA with color-coded line segments to mark smaller trend fluctuations.
Dynamic Pivot Trendlines: Automatically detects pivot highs/lows and draws major (solid) and minor (dashed) trendlines, with user-controlled extension modes.
Customizable Inputs: User can adjust SMA lengths, pivot look back/look forward periods, line extend mode, and toggle features on/off.

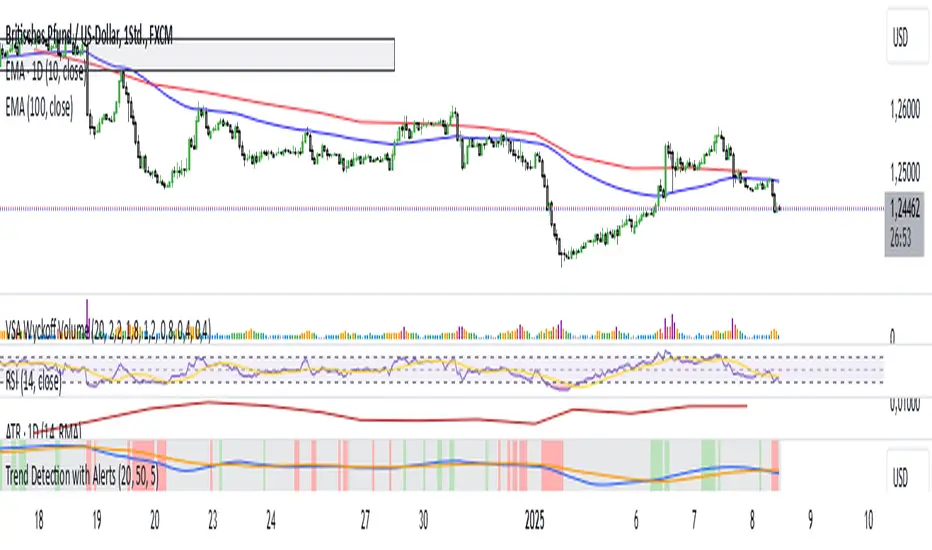
Trend Detection with AlertsPurpose of the Script
The script identifies trends on a chart (uptrend, downtrend, or sideways trend) and provides both visual cues and alerts when a trend changes. It uses two methods for trend detection:
Moving Averages (MA): It compares a short-term moving average (fast) with a long-term moving average (slow).
An uptrend occurs when the short-term MA is above the long-term MA.
A downtrend occurs when the short-term MA is below the long-term MA.
Price Action:
Higher highs (HH) indicate bullish momentum.
Lower lows (LL) indicate bearish momentum.
When these methods align, the script determines the trend and notifies the user of any trend changes.
Key Features
Moving Average Calculation:
A short-term moving average and a long-term moving average are calculated to determine the overall trend direction.
Trend Determination:
An uptrend is detected when the short-term MA is above the long-term MA and higher highs are present.
A downtrend is detected when the short-term MA is below the long-term MA and lower lows are present.
Otherwise, the trend is classified as sideways.
Alerts for Trend Changes:
Alerts are triggered when the trend changes from one state to another (e.g., sideways to uptrend).
Custom messages indicate the type of trend detected.
Background Colors:
The script changes the chart’s background color based on the current trend:
Green for uptrends.
Red for downtrends.
Gray for sideways trends.
Visualization of Moving Averages:
The moving averages are plotted on the chart for visual reference.
How It Works
Inputs for Flexibility:
The user can configure the lengths of the short-term and long-term moving averages.
A lookback period is used to determine higher highs or lower lows for additional confirmation.
Trend Logic:
The script checks the relationship between the moving averages to identify general trends.
It also evaluates price action to confirm trend strength (e.g., whether a higher high or lower low occurred).
Alert System:
When the detected trend changes (e.g., from sideways to uptrend), an alert is triggered. This ensures the user is notified of important market movements.
Dynamic Background Coloring:
The background color of the chart changes to reflect the current trend, making it easy to interpret the trend visually.
Use Cases
Trend Identification: Helps traders quickly identify market trends for decision-making.
Alerts for Trend Changes: Notifies traders when a new trend begins, ensuring they don’t miss key opportunities.
Visual Assistance: Makes it easier to interpret trends through color-coded backgrounds and moving average overlays.
Customization Options
Adjust Moving Average Lengths: Users can modify the short-term and long-term moving averages to suit their trading strategies.
Change Lookback Period: The sensitivity of higher highs and lower lows can be adjusted.
Personalized Alerts: Alerts can be customized for different trading scenarios.
Summary
This script provides an intuitive way to detect and visualize market trends while offering real-time alerts for trend changes. It’s an excellent tool for traders who want to stay informed about market conditions and make data-driven decisions.
Trend Candles Full ColorThe coloring over the candle sticks isn't showing up on the picture for some reason but when you click on the indicator the color coding will appear on the chart.
Trend Candles Full Color Indicator Explanation The "Trend Candles Full Color" indicator, designed for TradingView, visually enhances candlestick charts by coloring candles based on their position relative to a simple moving average (SMA). Here's how it works and how it can benefit traders: How It Works Input : Adjust the SMA period (default is 20) to define the trend length.
Logic : The indicator compares the closing price of each candle to the SMA: Green Candle : Close is above the SMA (indicating an uptrend).
Red Candle : Close is below the SMA (indicating a downtrend).
Gray Candle : Close equals the SMA (neutral/no clear trend).
Output : Candles (body, wick, and border) are colored green, red, or gray based on the trend, overlaid directly on your price chart.
Benefits and Use Cases Trend-Following Strategies Benefit: Clearly identifies bullish (green) or bearish (red) trends, helping traders ride momentum.
Example: A swing trader using a 20-period SMA can enter long positions when candles turn green (price above SMA) and exit or short when candles turn red, confirming trend reversals.
Reversal Trading Benefit: Gray candles signal indecision near the SMA, often a precursor to reversals.
Example: A day trader might watch for gray candles after a prolonged uptrend (green candles) to anticipate a potential bearish reversal, combining with other indicators like RSI for confirmation.
Scalping Benefit: Quick visual cues for short-term trend changes on lower timeframes.
Example: A scalper on a 5-minute chart can use green candles to confirm quick bullish moves and red candles to avoid counter-trend trades, enhancing decision speed.
Position Sizing or Risk Management Benefit: Color changes highlight trend strength, aiding in adjusting trade size or stops.
Example: A trader might increase position size during strong green candle sequences (sustained uptrend) and tighten stops when gray candles appear, signaling potential trend weakness.
Tips for Use Adjust the MA Length to suit your trading style (e.g., shorter for scalping, longer for swing trading).
Combine with other indicators (e.g., support/resistance, MACD) for better accuracy.
Test on different timeframes to match your strategy.
Recommended MA Length for 1-Minute Charts Short-Term/Scalping (1-5 minute trades):10-period SMA : Very sensitive, ideal for capturing quick price movements in fast markets. May produce more noise (false signals).
20-period SMA : A balanced choice for 1-minute charts, smoothing minor fluctuations while reacting to short-term trends. A great starting point for scalpers.
Intraday Trend Trading (10-30 minute holds):50-period SMA : Captures broader intraday trends, reducing noise but lagging slightly. Suitable for larger moves within a session.
This indicator simplifies trend identification, making it a versatile tool for traders of all styles, from beginners to advanced users!
Recommended MA Length for Swing Trading / Higher Timeframes Swing Trading (holding trades for days to weeks):50-period SMA : A popular choice for swing traders on higher timeframes (e.g., 1-hour or 4-hour charts). It smooths out short-term fluctuations while identifying medium-term trends. Ideal for capturing multi-day swings.
100-period SMA : Slightly longer, this MA is great for confirming stronger, more sustained trends. It’s useful on 4-hour or daily charts for swing traders aiming to ride larger price moves.
Longer-Term Trend Trading (holding for weeks to months):200-period SMA : A classic choice for higher timeframes like daily or weekly charts. It highlights major market trends and is widely used by swing and position traders to filter out noise and focus on long-term direction.
150-period SMA : A middle ground between the 100 and 200 SMA, suitable for daily charts when you want a balance between responsiveness and trend reliability.

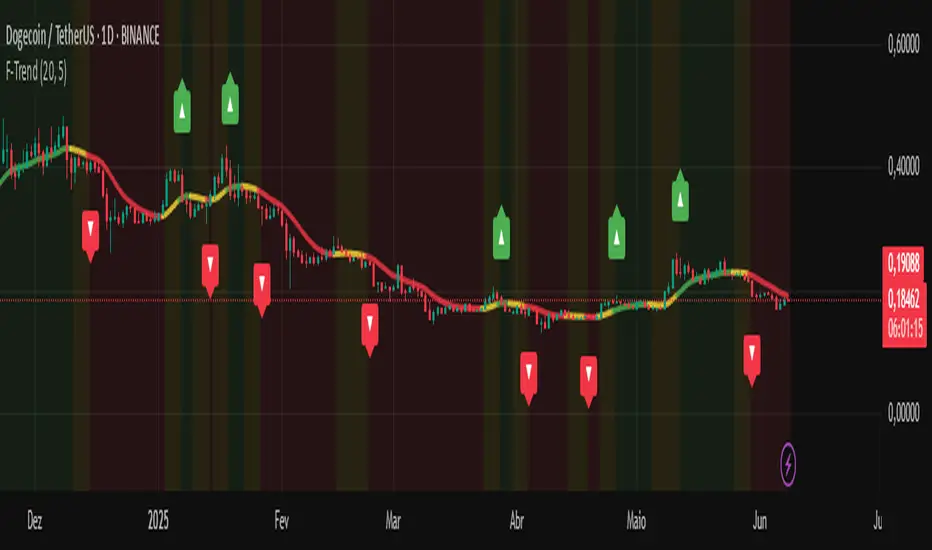
Trend-Filter [John Ehlers]Indicator Description — Trend-Filter
This indicator uses the SuperSmoother filter, created by John Ehlers, to smooth price data and identify trends with greater accuracy and less noise. It counts the number of consecutive bars in uptrend or downtrend to measure the strength of the movement and changes the line and background colors for easy visualization.
How to use this indicator:
SuperSmoother filter: smooths the price to reveal a clearer trend direction by filtering out fast oscillations and market noise.
Bar counting: monitors sequences of bars maintaining an up or down trend to identify consistent moves.
Dynamic colors:
Green line indicates a strong uptrend.
Red line indicates a strong downtrend.
Yellow line shows a neutral or undefined trend.
Optional colored background visually reinforces trend strength with transparency so it does not interfere with price reading.
Visual signals: arrows appear on the chart to mark the start of a strong trend, helping entry or exit decisions.
Adjustable parameters:
SuperSmoother Length: controls the filter smoothing (higher = smoother, less noise).
Trend Threshold: minimum number of consecutive bars to consider a strong trend.
Smooth colors: enable or disable line color smoothing.
Show signals: toggle trend start arrows on/off.
Show dynamic background: toggle the colored background indicating trend strength.
Recommendations:
Use alongside other technical analysis tools and risk management.
Can be applied on any timeframe, but interpretation is more reliable on charts with reasonable data volume.
Ideal for traders seeking to identify consistent trends and avoid market noise.
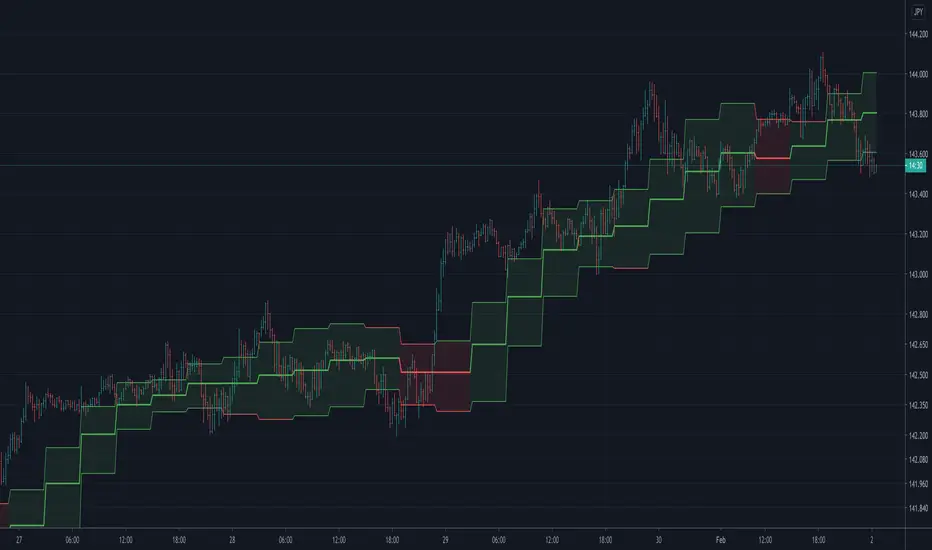
Supertrend - Ladder ATRThis is a supertrend with slight twisted concept which can be very benefecial in strong trending markets to reduce stop loss distance and exit slightly quicker.
⬜ Concept
▶ When the instrument is trending up, regular ATR shows high values if there are big green candles. This affect the stoploss distance in regular supertrend which leads to wide stops or delayed lagging. When you are in long trade, what matters for stoploss is how much a negative candle can move within bar. Hence, using ATR derived only based on red candles is more beneficial for trailing stops on long signals. Same applies to short trades where using ATR derived from only green candles is more efficient than overall ATR.
▶ ATR will be minimal when the volatility is less and ATR will increase with volatility. That means, once you are in trade, the trailing of stoploss also will vary based on ATR (or volatility). With regular ATR and supertrend, chances of stop loss distance widening is high with increased volatility even though stoploss levels will not move down. This again poses the risk of higher drawdown during trade closure and also keeps in the trade during ranging market. To avoid this, the second trick we are using here is only to reduce the atr stoploss difference when in trade. That is, when in long trade and negative candles ATR is increasing, we will not consider that. We will consider the new ATR only if it is lesser than previous bar ATR.
Effect of these changes on the trending market is quite visual. Lets take example of USDTRY
Settings are quite simple and does not vary much from regular supertrend settings.

Trendlines - JD This script draws trendlines from the pivot points in the price chart.
The input for the function that draws the trendlines is any calculation or function (eg. pivot points),
that most of the time and occasionally produces a 'non n/a' value.
The trendline function then connects the non n/a values and axtends the connections of those points in a trendline.
There is an option to draw the lines from the wicks or from the 'real bodies' of the candles.
The trendlines can either extend infinitely or only run for an adjustable amount of bars.
JD.
