TrendyIndicator without parameters. The indicator value is the sum of two counters. The first counter adds the ratio (Close/Open) to its previous value if Close > Open. The second counter subtracts from its previous value (Open/Close) if Close < Open. Counters start with zeros. For a larger variance, the ratio is taken exponentially. In general, this is the difference between the number of rising and falling candlesticks.
Cari dalam skrip untuk "trend"

LH-LL/HL-HH Confirmation Trend LineBased on Dow Theory, a series of successive higher highs (HH) and higher lows (HL) is the sign of an uptrend (bull trend) and a series of successive lower highs (LH) and lower lows (LL) is the sign of a downtrend (bear trend).
So this script indicates the trends using the concept and draws corresponding trend lines.
It took some effort to make it possible for users to see as many trend lines as they wish. Eventually the user could set the number alongside some other options in the indicator settings.
Use the script and send me your thoughts!

[SK] Fibonacci Auto Trend ScouterThe FATS - Fibonacci Auto Trend Scouter automatically draws active trends from 2 different timeframes along with Fibonacci Support and Resistance levels. It also has a Sights feature for each timeframe which points from it's middle towards the current price. The tool is also highly customizable for you to take this indicator over 9000. If you like the tool and it adds value to you - share the love on the like button and visit my profile to check out my other indicators and subscribe, so you're notified of my next scripts and ideas!
Automatic Trend Lines
The indicator takes in 2 timeframes to detect High and Low values from which to draw the trend lines of each timeframe.
As the values change with price movement, the lines are updated. They are color coded for uptrend and downtrend based on the direction of each individual line. Trend lines can be set up to color with only the default value on the configurations panel.
- Toggle on/off Color Coded
- Change Default, Uptrend, Downtrend color
- Change Line Width
- Change Line Style
- Toggle on/off Line Extensions
- Change Extended Line Width
- Change Extended Line Style
- Toggle On/Off labels for 7 data points of each timeframe
Automatic Trend Sights
This is a neat feature that may help you get a better feel for the direction the current movement is heading towards in correlation with the short or medium length timeframe trends. The sight draws a line from the middle vertical point of the trend coordinates towards the current price. They are toggled off by default but can be enabled in the configurations panel.
- Toggle on/off sight on each timeframe
- Change Width
- Change Line Style
Automatic Fibonacci Levels
The tool has a very useful feature to automatically detect the highest and lowest value from the short timeframe to calculate Fibonacci support and resistant levels. To keep the chart area clean, the lines are drawn short by default towards the right side of the price but provide inputs to increase the size of the level lines towards the left and right direction. A triangle label appears to the side of each line which holds the Fibonacci level and price data inside the tooltip, hover over them to activate.
- Toggle on/off color coded
- Change Default, Resistance, Support colors
- Change line size towards the left and right side
- Change line width
- Change Resistance line style
- Change Support line style
- Toggle on/off High and Low source line
- Toggle on/off High and Low source labels

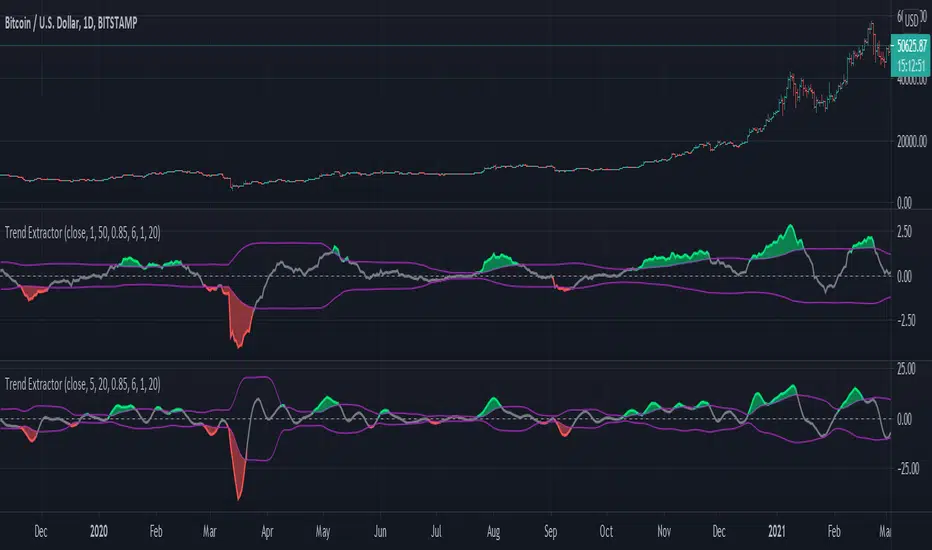
Trend Extractor First off, I'm a huge John Ehlers admirer. Been learning a lot from him. This indicator was inspired by his Super Bandpass Filter.
The goal of this indicator, which I'm calling "Trend Extractor" for lack of a better name, is to identify trends and filter out choppy market movements, similar to the Super Bandpass Filter,... but arguably more customisable. Personally, I've had better results with this Trend Extractor.
A brief overview of how it works:
The price changes are averaged over the lookback period using the Arnaud Legoux Moving Average (ALMA), which has been chosen for its superb versatility.
For instance, with Offset 1 and Sigma 0, it behaves like a SMA, and with Offset 1.1 and Sigma 2, it behaves like a WMA. So, feel free to tweak and experiment.
The purple lines are the positive and negative root mean square (RMS) of the main line, and act as signal lines.
The higher the Smoothing, the smoother the main line, at the cost of greater lag. Default is 1, that is, none. I'd suggest going not higher than 5.
Signals are straightforward to interpret. Trending up when green, trending down when red, and ranging when gray.
Your feedback is very well appreciated. Thank you. :)
EMA TrendThe purpose of this script is to identify price trends based on EMAs. The relative position of price to specific EMAs and the position of certain EMAs towards each other are used to determine the trend direction. The script is intended for investors as a tool to define a basis for further evaluation. I do not use the script as a signal generator and would not recommend doing so without the help of additional indicators.
How to work with the script
The major (or long term) trend direction is determined by the 144 EMA much in the same way as the 200 MA is used in other systems. If the price is above the 144 EMA we are in a long term uptrend, below we are in a long term downtrend. This is to be taken with a grain of salt though. The 144 EMA is considerably shorter than the 200 SMA and is more prone to the price fluctuating around it during periods without a strong long term trend. I recommend using this as a confirmation for the short term trend.
The short term trend is derived from the position and slope of the price, the 21 EMA and the 55 EMA. If the price is above the 21 EMA, the 21 above the 55 EMA, both EMAs are sloping upwards and the distance between the two is increasing, we are talking about an uptrend (and vice versa for a downtrend). This is visualized by the color of the fill between the 144 EMA and close price. Green for uptrend, red for downtrend and no color for an undetermined trend.
The EMAs used are: 21 , 34 , 55 , 89 , 144 , 233 . Most of the EMAs are at 50 transparency to appear less dominant. For orientation, the 144 EMA is bright green to indicate its general importance for the trend determination, and the 55 EMAs is not transparent mainly to be able to identify positioning when the EMAs are close together.
Base time frame EMA
The 144 EMA is plotted twice where one is fixed to the daily time frame (can be configured) to be able to have the 144 on different timeframes during analysis. I find this very useful to keep the focus on my main time frame while analyzing trend on lower or higher time frames. This can also be turned off.
Configurability
This script is less configurable than I generally like with my other scripts. The reason is that the title attribute of the plots is not dynamic, and I use the data window often to get exact values from the script to determine buy targets for pullbacks and other things. Hence, I prefer not to have random names (or no names) in there to save mental capacity. If this ever becomes available, I'll gladly add this to this script. Till then, I encourage you to take the script and adjust it to your own needs. It should be simple enough even if you are just starting out in pine.

Didi's TrendChanges the background according to the DMI trend.
Based on the way the infamous Brazilian trader with over 40 years experience, Master Didi Aguiar reads the Directional Movement Index — one indicators in his setup.
It's read this way:
Only trade on the direction of the trend. Start the trade when accelerating:
Blue = Long trend
Bright Blue = Long trend, accelerating
Purple = Short trend
Bright Purple = Short trend, accelerating
Change from bright to dark color = ADX's bounce, the first signal to exit the trade.
Nor coloured background = no trend.
Use other indicators to confirm your trades.
Not recommended for color blind people :)
-----------------------------------------
Indicador que muda a cor do fundo de acordo com a tendencia.
É baseado na maneira que Didi Aguiar lê o DMI e o ADX .
Lê-se assim:
Fundo azul = Tendencia de compra
Fundo roxo = Tendencia de venda
Cor mais saturada (vibrante) = Tendencia acelerante
Passou de cor mais clara para mais escura = Kick do ADX
Sem coloração de fundo = Sem tendencia
Não é indicado para pessoas que sofrem de daltonismo.

Trend Reversal Indicator (EMA of slopes)Good morning Traders
Inspirated by lukescream EMA-slope strategy, today I want to share with you this simple indicator whose possible use-case would be for detecting in advance possible trend reversals, specially on higher timeframes.
Once that you've chosen the desired source (RSI, EMA or Stochastic k or d), the indicator will calculate its "slope" approximating its first order derivative by the division between the last variation of the series and its last value.
You can see the slope as a white line by enabling the relative checkmark (it's disabled by default since it simply messes up the the graph)
Then, the slope itself becomes the source for two exponential moving averages: the fast one (in blue) has a period of 20 while the slow one (in red, it becomes similiar to a horizontal line actually) has a period of 500
Why the slope? Since all the sources mentioned before are directly or indirectly calculated on the price action, a more aggressiveness in the price movement would be translated into a more (positive/negative) steepness of those indicator (of course this effect would be far more evident if the indicators are calculated on low periods, but really low periods could compromise the consistency of the signals).
In this way, the slope would mirror the decisiveness of price movements and a comparison between two averages calculated from it (the first one based on more recent values, the second one that conisders also older values) could tell you in advance what direction the market is possibly about to take
The usage is simple: once that the fast moving average crosses upward the slow one, this could be a sign of potential trend reversal from bearish to bullish. On the contrary, if the fast EMA crosses downward the slow one, this could be a sign of potential trend reversal from bullish to bearish.
What I suggest you is to integrate this indicator with Exponential Moving Averages plotted on the price candles, in order to have a general bias for opening long or short positions, and with an oscillator as well such as the Stochastisc RSI in order to detect the overbought/oversold zones for opening/closing positions at the right moment.
Happy Trading!

Relative Returns StrategyLooks like an ultimate strategy for buy and hold investors.
This is designed based on the indicator :
Converting that into strategy with little optimization yield this. One change here is, instead of using the return percentage directly, we are using moving averages on both of them.
Buy condition : Moving Average on stock return crosses over that of index return.
Sell condition : Moving Average on stock return crosses under that of index return.

Pyramiding Entries On Early Trends (by Coinrule)Pyramiding the entries in a trading strategy may be risky but at the same time very profitable with a proper risk management approach. This strategy seeks to spot early signs of uptrends and increase the position's size while the right conditions persist.
Each trade comes with its stop-loss and take-profit to enforce a proportional risk/reward profile.
The strategy uses a mix of Moving Average based setups to define the buy-signal.
The Moving Average (200) is above the Moving Average (100), which prevents from buying when the uptrend is already in its late stages
The Moving Average (9) is above the Moving Average (100), indicating that the coin is not in a downtrend.
The price crossing above the Moving Average (9) confirms the potential upside used to fire the buy order.
Each entry comes with a stop-loss and a take-profit in a ratio of 1-to-1. After over 400 backtests, we opted for a 3% TP and 3% SL, which provides the best results.
The strategy is optimized on a 1-hour time frame.
The Advantages of this strategy are:
It offers the possibility of adjusting the size of the position proportionally to the confidence in the possibilities that an uptrend will eventually form.
Low drawdowns. On average, the percentage of trades in profit is above 60%, and the stop-loss equal to the take-profit reduces the overall risk.
This strategy returned good returns both with trading pairs with Fiat/stable coins and with BTC. Considering the mixed trends that cryptocurrencies experienced during 2020 vs BTC, this strengthens the strategy's reliability.
The strategy assumes each order to trade 20% of the available capital and pyramids the entries up to 7 times.
A trading fee of 0.1% is taken into account. The fee is aligned to the base fee applied on Binance, which is the largest cryptocurrency exchange.

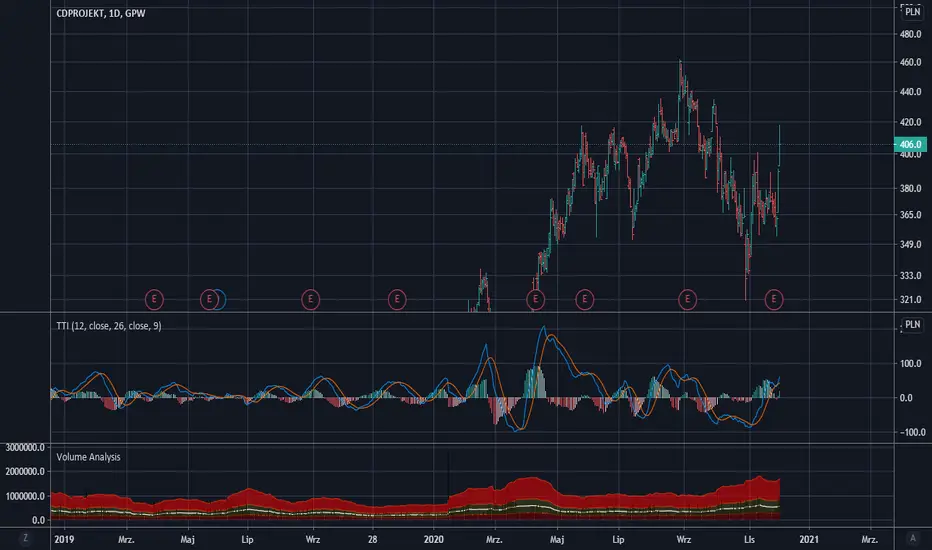
Trend Thrust Indicator - RafkaThis indicator defines the impact of volume on the volume-weighted moving average, emphasizing trends with greater volume.
What determines a security’s value? Price is the agreement to exchange despite the possible disagreement in value. Price is the conviction, emotion, and volition of investors. It is not a constant but is influenced by information, opinions, and emotions over time. Volume represents this degree of conviction and is the embodiment of information and opinions flowing through investor channels. It is the asymmetry between the volume being forced through supply (offers) and demand (bids) that facilitates price change. Quantifying the extent of asymmetry between price trends and the corresponding volume flows is a primary objective of volume analysis. Volume analysis research reveals that volume often leads price but may also be used to confirm the present price trend.
Trend thrust indicator
The trend thrust indicator (TTI), an enhanced version of the volume-weighted moving average convergence/divergence (VW-Macd) indicator, was introduced in Buff Pelz Dormeier's book 'Investing With Volume Analysis'. The TTI uses a volume multiplier in unique ways to exaggerate the impact of volume on volume-weighted moving averages. Like the VW-Macd, the TTI uses volume-weighted moving averages as opposed to exponential moving averages. Volume-weighted averages weigh closing prices proportionally to the volume traded during each time period, so the TTI gives greater emphasis to those price trends with greater volume and less emphasis to time periods with lighter volume. In the February 2001 issue of Stocks & Commodities, I showed that volume-weighted moving averages (Buff averages, or Vwmas) improve responsiveness while increasing reliability of simple moving averages.
Like the Macd and VW-Macd, the TTI calculates a spread by subtracting the short (fast) average from the long (slow) average. This spread combined with a volume multiplier creates the Buff spread
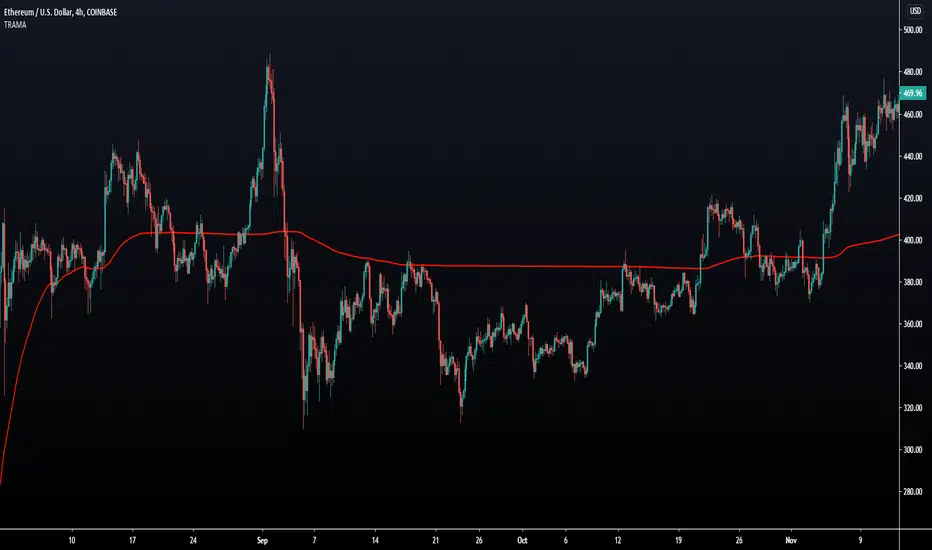
Trend Regularity Adaptive Moving Average [LuxAlgo]The following moving average adapt to the average number of highest high/lowest low made over a specific period, thus adapting to trend strength. Interesting results can be obtained when using the moving average in a MA crossover system or as a trailing support/resistance.
Settings
Length : Period of the indicator, with higher values returning smoother results.
Src : Source input of the indicator.
Usage
The trend regularity adaptive moving average (TRAMA) can be used like most moving averages, with the advantage of being smoother during ranging markets.
Notice how the moving closer to the price the longer a trend last, such effect can be practical to have early entry points when using the moving average in a MA crossover system, such effect is due to the increasing number of average highest high/lowest low made during longer trends. Note that in the case of a significant uptrend followed by a downtrend, the moving average might penalize the start of the downtrend (and vice versa).
The moving average can also act as an interesting trailing support/resistance.
Details
The moving average is calculated using exponential averaging, using as smoothing factor the squared simple moving average of the number of highest high/lowest low previously made, highest high/lowest low are calculated using rolling maximums/minimums.
Using higher values of length will return fewer highest high/lowest low which explains why the moving average is smoother for higher length values. Squaring allows the moving average to penalize lower values, thus appearing more stationary during ranging markets, it also allows to have some consistency regarding the length setting.
🧙 this moving average would not be possible without the existence of corn syrup 🦎
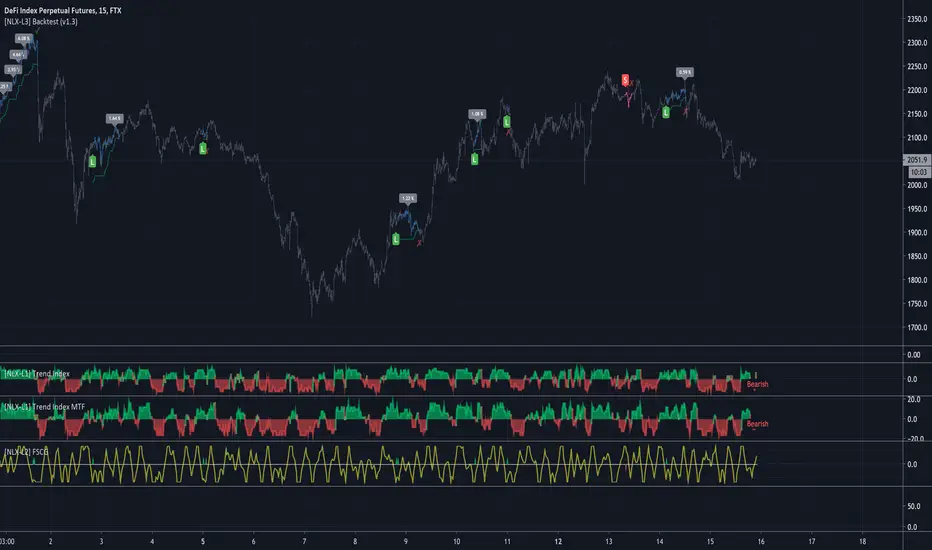
[NLX-L1] Trend Index- NLX Modular Trading Framework -
This module is build upon the Trend Index by Mango2Juice (thanks for your permission to use the source!)
It includes all the common indicators and creates a positive or negative score, which can be used with my Modular Trading Framework and linked to an entry/exit indicator.
SuperTrend
VWAP Bands
Relative Strength Index ( RSI )
Commodity Channel Index ( CCI )
William Percent Range (WPR)
Directional Movement Index (DMI)
Elder Force Index ( EFI )
Momentum
Demarker
Parabolic SAR
... and more
- Getting Started -
1. Add this Trend Index to your Chart
2. Add one of my Indicator Modules to your Chart, such as the QQE++ Indicator
3. In the QQE Indicator Settings combine it with the Trend Index (and choose L1 Type)
4. Optional: Add the Noise Filter , and in the Noise Filter Settings you select the QQE Indicator as combination (and choose L2 for Type)
5. Add the Backtest Module to your Chart
6. Select the Noise Filter in the Backtest Settings
Indicator modules can be combined in many different ways in my framework - have fun!
- Alerts for Automated Trading -
The alerts module is coming soon and you will be able to create alerts to automated your trades.
See my signature below for more information.
Noro's Trendlines IndicatorTo create the script I used the LonesomeTheBlue code. Thank him for his code.
The indicator shows trend lines. Up to three support lines (red) and up to three resistance lines (lime). There can be up to 6 lines at a time. However, most often there will be from 0 to 1 line. Trend lines may be extended to the right. For this purpose there is a checkbox in the setting. This is the way you may adjust line thickness.
For example, how to use
The indicator shows you the support line (red) and the resistance line (lime). If the line is crossed, the price may move a lot towards the breakout.
In a few days.

High - Low Trend TunnelHigh - Low Trend Tunnel Experiment.
Using latest pinescript Array support!
Plotting Highest highs and Lowest lows for specific length (can be defined in settings).
The blue line is whom determinate the direction.
Blue line is the average of the highest highs and lowest lows smoothed by EMA.
Green - Up Trending.
Red - Down Trending.
Yellow - Squeeze, a reversal might be coming.
Any suggestions/comments are welcome as this is an experiment.

Trend LineBasic Trend Line base on fractals (v0.1)
Can not draw a line on the future X axis, So just a line segment but not a ray.
I don't have a better idea to upgrade...

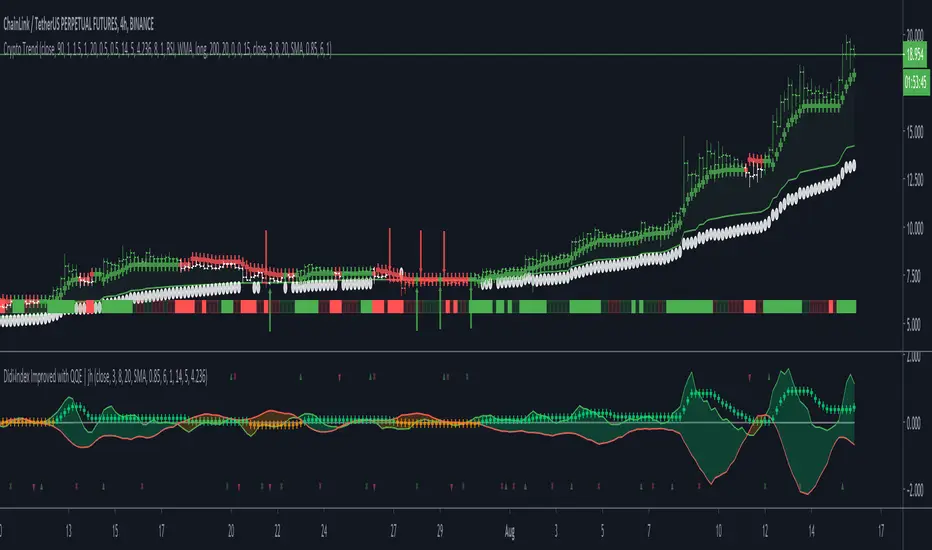
Crypto TrendThis indicator is based off of the Trend Follower system put together by jiehonglim:
This is a trend following system that combines 3 indicators which provide different functionalities, also a concept conceived by VP's No Nonsense FX / NNFX method. I’m primarily modifying this system for Crypto trading (mostly leveraged Crypto Futures). Suggestions/requests welcome.
New Features:
Added position inputs that will generate position labels
For leverage trading, position inputs will calculate your percentage-based stop loss given your entry, leverage and liquidation price
Added optional horizontal line plots for entry, stop loss, 50% take profit and 100% profit levels.
Added non-plotted Didi calculations for alert condition triggers
Added long and short alerts
These alerts will trigger for any of the 3 following conditions:
Baseline cross with volume confirmation
Didi two line cross with volume confirmation
Didi continuation with volume confirmation
1. Baseline
The main baseline filter is an indicator called Modular Filter created by Alex Grover
- www.tradingview.com
- Alex Grover - Modular Filter
-------
That's the moving average like baseline following price, filtering long and short trends and providing entry signals when the price crosses the baseline.
Entry signal indicated with arrows.
2. Volume / Volatility , I will called it Trend Strength
The next indicator is commonly known as ASH, Absolute Strength Histogram.
This indicator was shared by VP as a two line cross trend confirmation indicator, however I discovered an interesting property when I modified the calculation of the histogram.
- Alex Grover Absolute Strength
-------
My modification and other info here
- Absolute Strength Histogram v2
-------
I simplified the display of the trend strength by plotting squares at the bottom of the chart.
- Lighted Squares shows strength
- Dimmed Squares shows weakness
3. Second Confirmation / Exits / Trailing Stop
Finally the last indicator is my usage of QQE (Qualitative Quantitative Estimation), demonstrated in my QQE Trailing Line Indicator
- QQE Trailing Line for Trailing Stop
-------
Three usages of this amazing indicator, serving as :
- Second trend confirmation
- Exit signal when price crosses the trailing line
- Trailing stop when you scaled out the second trade
This indicator is plotted with crosses.
4. Position Calculator
For non-leveraged trades, set leverage to 1 and liquidation to 0
Fill out the rest of the position field to get labels that will tell you:
Your stop loss given your acceptable percentage of loss for your risk. So, for example if your actual investment is $200 and you’re trading on 20X leverage, you’d like to know what price would have to drop to for you to lose 15% of your $200 risk. This is what the position calculator is doing for you.
Your 50% take profit point
Your 100% take profit point
Check the “Show Position Lines” to plot horizontal lines for entry, stop loss, 50% TP and 100%TP
Alerts
You just get a Long Alert or Short Alert option. This was for two reasons, the first and most important was to reduce the number of alerts needed for this system to get maximum coverage. The second was just to keep things simple. Get an alert for your desired direction for any interesting signal and then check the chart manually to determine if a viable entry has presented itself. The three alert conditions are:
Main trend indicator, baseline cross with volume confirmation
Didi two line cross entry with volume confirmation
Didi continuation signal with volume confirmation
Additional plots and information
Bar Color
- Green for longs, Red for shorts, White when the baseline direction conflicts with the QQE trailing line direction
- When it's white, it's usually ranging and not trending, ASH will also keep you off ranging periods.
-------
ATR Filter
- White circles along the baseline, they will show up if the price has moved more than one ATR from the baseline
- The default allowance is 1 ATR.
-------
The previous and current ATR value
- Label on the right side of the chart showing the previous and current value of ATR
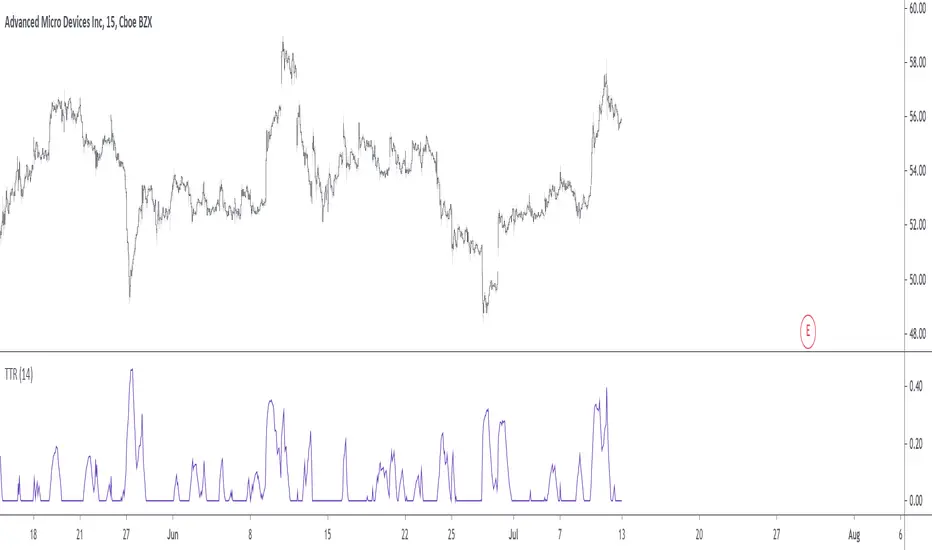
Trending True RangeDisplay a smoothed true range during trending markets, thus filtering any measurement occurring during ranging markets. Whether the market is trending or ranging is determined by the position of the efficiency ratio relative to its Wilder moving average.
Settings
Resolution : resolution of the indicator
Length : period of the efficiency ratio and the Wilder moving averages used in the script
Usage
If you are not interested in volatility during ranging markets, this indicator might result useful to you. An interesting aspect is that it both measures volatility, but also determine whether the market is trending or ranging, with a zero value indicating a ranging market.
Indicator against Atr, with both length = 14, our indicator might be easier to interpret.
Note
Thx to my twitter followers for their suggestions regarding this indicator. I apologize if it's a bit short, the original code was longer and included more options, but forcing a script to be lengthy is a really bad idea, so I stayed with something less flashy but certainly more practical, "classic Grover" some might say.
Thx for reading!
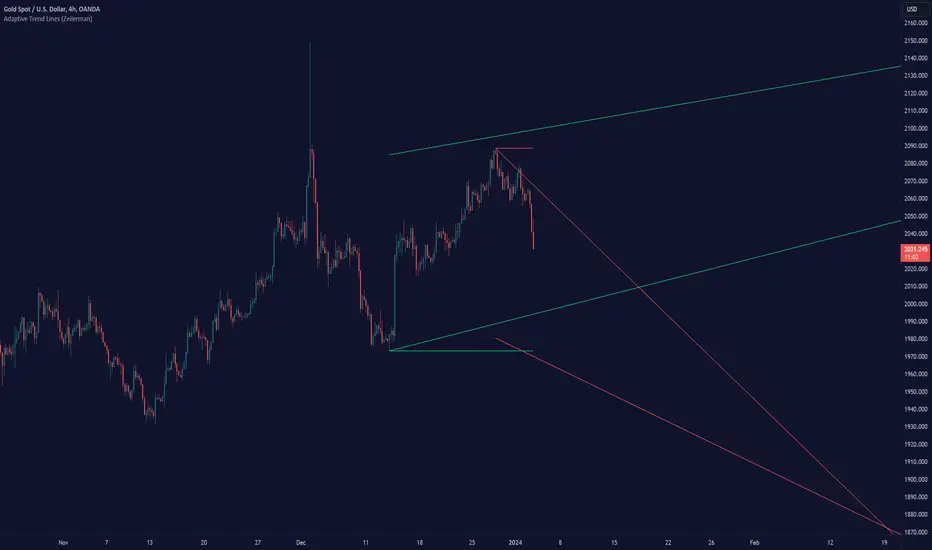
Adaptive Trend Lines (Expo)Adaptive Trend Lines (Expo) identifies the current trend direction within the selected lookback period. The idea behind the indicator is that the trend lines should self adjust to the constantly changing market. The indicator adjusts itself to the market by using tr (true range) and stdev (standard deviation) as dynamic variables.
The indicator displays positive- and negative trend channels.
HOW TO USE
1. Use the indicator to identify the trend direction.
I hope you find this indicator useful , and please comment or contact me if you like the script or have any questions/suggestions for future improvements. Thanks!
I will continually work on this indicator , so please share your experience and feedback as it will enable me to make even better improvements. Thanks to everyone that has already contacted me regarding my scripts. Your feedback is valuable for future developments!
-----------------
Disclaimer
Copyright by Zeiierman.
The information contained in my scripts/indicators/ideas does not constitute financial advice or a solicitation to buy or sell any securities of any type. I will not accept liability for any loss or damage, including without limitation any loss of profit, which may arise directly or indirectly from the use of or reliance on such information.
All investments involve risk, and the past performance of a security, industry, sector, market, financial product, trading strategy, or individual’s trading does not guarantee future results or returns. Investors are fully responsible for any investment decisions they make. Such decisions should be based solely on an evaluation of their financial circumstances, investment objectives, risk tolerance, and liquidity needs.
My scripts/indicators/ideas are only for educational purposes!
Trend following 3 EMA & Bullish Engulfing indicator for ForexHello world,
I now took the time and puzzled through my own indicator.
The idea:
Main "strategy" uses 3 EMAs (8, 13 and 21) to attain trend-relevant information.
Then we look for bullish & bearing engulfing candles which indicate and pullback into trend direction and a gain in momentum.
Trading purpose:
One could now enter with next open. SL at low/high of engulfing candle. TP at e.g. 1.25 of that candles size.
Security:
There are two security functions build in.
We check for higher timeframe confirmation.
This is done by checking if current trend is in accordance with the EMA of the next higher timframe.
Standard-deviation is 3 on default. Can be changed in the inputs.
Alerts:
Until now there is just one alertcondition programmed.
It alerts for every engulfing candle (bullish and bearish).
More will follow in further versions.
Inputs:
I build in multiple inputs.
- switch on/off the security EMA's
- define security trend backcheck
- define the higher timeframe (15min/1h, 1h/240, 4h/D, D/W)
Happy to take feedback or contr.
All the best,
c4ss10p314

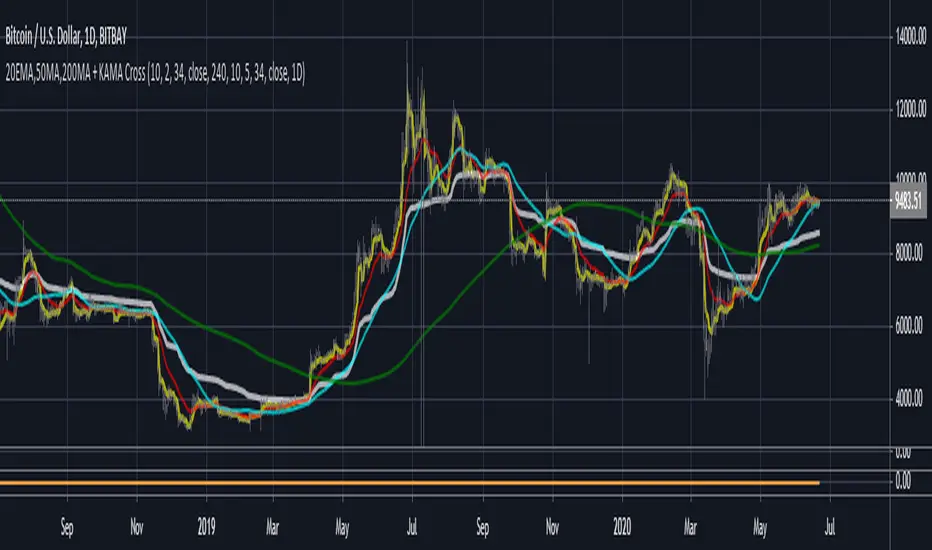
3MA'S + KAMA Trend (20EMA,50MA,200MA + KAMA Trend)This indicator, combines the traditional FOREX moving averages (20EMA, 50ma, 200ma) into a single indicator with
an adaptive moving average (AMA) taken from a user defined timeframe to show trend direction (by default, it plots
the daily 10/2/34 KAMA overlayed on any timeframe chart.
An AMA moves slowly when markets are sideways but swiftly during periods of volatility as a result it reacts much fast than
traditional options for moving average trends.
If the price is above the KAMA, trend is up. Below the KAMA, trend is down.
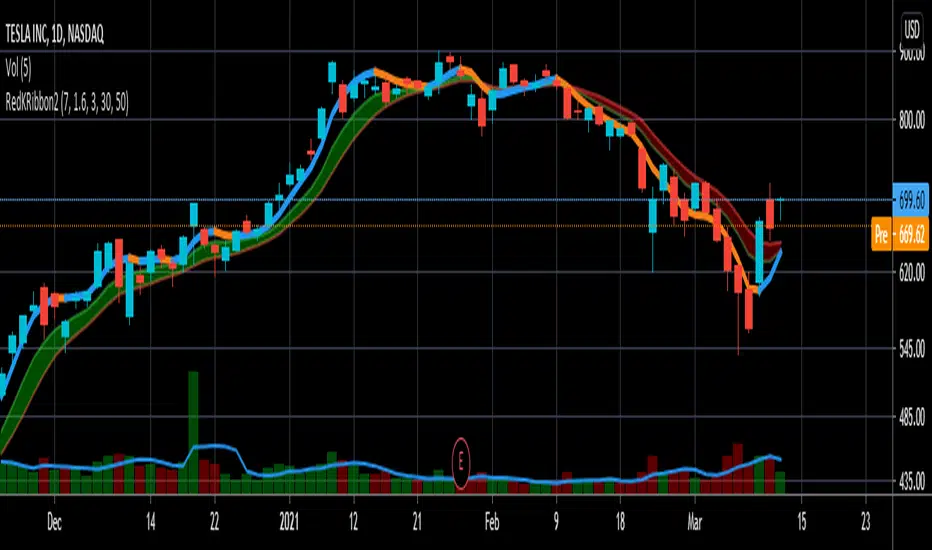
RedK Ribbon v2: Tracking Trend Made EasyThis is an update for the previously published RedK_Ribbon v1 -- and it adds some (hopefully) useful improvements:
1 - the Zero-Lag line is color-coded, to provide an early visual alert that momentum is fading, and the trend direction may change soon
2 - better colors for the ribbon :) - for the visually-oriented folks like me :)
3 - i added two optional EMAs that can be utilized as filters for the longer sentiment - to help a trader take positions only in the direction of the prevailing trends. note that these 2 EMA lines will be hidden by default until selected in the settings - to avoid clutter . Set to 30 and 50 by default but these lengths can be changed as needed
4 - code is open and commented
If you need to learn how we create the zero-lag moving average, pls refer to the "TA Basics" series - and if you need to learn more about how the Ribbon works, pls read the Ribbon v1 post
hope this is useful in your trading - and good luck!
Simple EMA trend indicatorSimple EMA trend indicator , pretty straightforward green equates to bullish and usually a retest/wick is often seen , same for the flipside viceversa

StDev Based Trendlines - JDAs a second alternatively based trendline script this is the Standard Deviation vesrion.
This script draws trendlines from the pivot points in the price chart.
The angle of the trendlines is determined by (a percentage of) the Standard Deviation.
The angle follows the change in price, compared to the StDev at the moment where the pivot point is detected
The StDev percentage determines if the trendline follows the rate of change of the StDev or a fraction ( value < 100) or a multiple ( value > 100) of that
JD.
#NotTradingAdvice #DYOR
Disclaimer.
I AM NOT A FINANCIAL ADVISOR.
THESE IDEAS ARE NOT ADVICE AND ARE FOR EDUCATION PURPOSES ONLY.
ALWAYS DO YOUR OWN RESEARCH!
