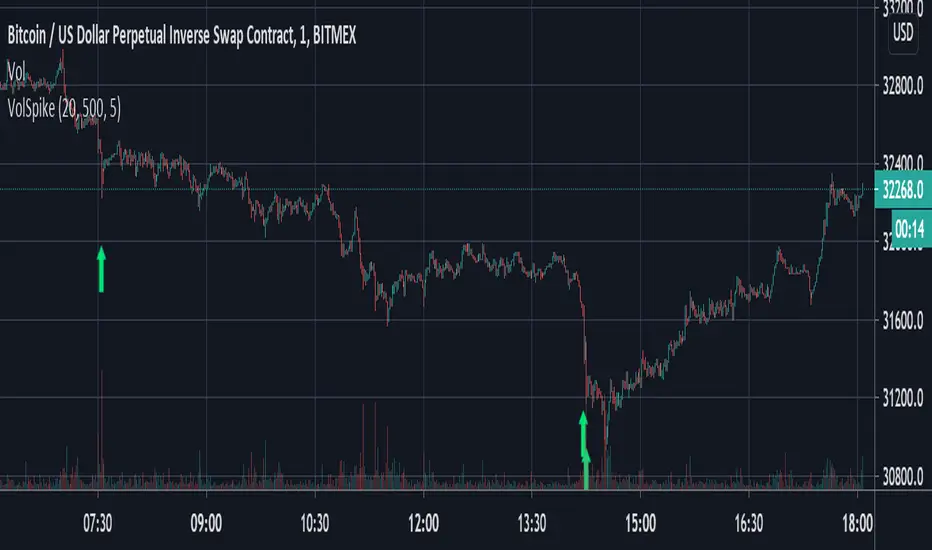
Volume Spike Strategy This is a Pine Script implementation of “Capitalize AI: Volume Spike Strategy" by Bitcoin Trading Challenge (copied with permission).
Original Capital AI formula :
If BTC/USD 1 minute volume > BTC/USD average volume in 20-1m bar by at least 500% and if BTC/USD is below the MA (5,1m,close) of BTC/USD then buy 10,000 USD WORTH of BTC/USD
Tested on XBTUSD 1 minute.
Original strategy is buy-only. Option for sells was added (enable in settings).
First published script -- comments/feedback appreciated
Cari dalam skrip untuk "volume"
Volume MA Convergence and DivergenceGreetings, I imagine there is already some similar scripts as this one but I couldn't find one so I decided to add something.
We are looking at convergence and divergence signals of moving-average values of 3 different volume time frames. The time frames can of course be tweaked to ones liking, I set up Vol-MA8, 20 and 50. A strong enough divergence in at least 2 of the MAs may perhaps signal an exhausting trend or the beginning of a new one. Convergence of all three to a single point, or close enough to, may signal impending volatility potentially. The latter would best be complimented with another volatility predicative indicator or correlating impending price change data. There are more signals to be studied within this single indicator such as a converging occurrence above OR below the mean, etc, etc.
@OptiSean on Twitter
Enjoy, Cheers
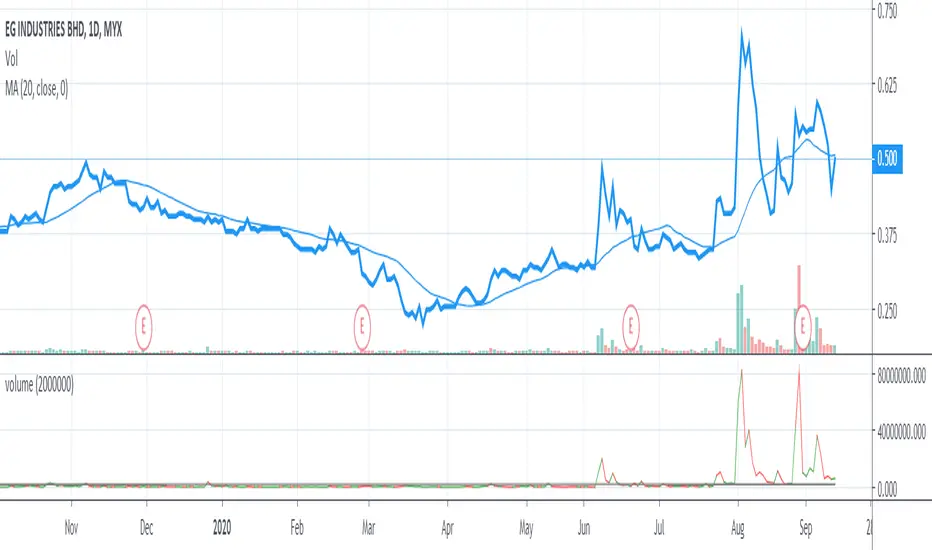
Volume Bars and Regions of InterestThe bars are colored according to the volume traded. The volume weights were distributed logically for a better analysis.
<0.666 low volume
0.666 to 1.333 median volume
1,333 to 2,666 high volume
> 2,666 'institutional' volume
The moving average bands are the average of the highs and lows. They show a region of interest and not just a 'line'.

Volume Brakeout v1Volume Brakout indicator is used to help determine trend direction strictly based on Negative and Positive volume data.
How to Read:
- Moving Average crossovers are used to help determine a possible trend change or retracement.
- The area cloud on the bottom is calculated by the difference of the moving averages. This could be used to help determine the trending volume strength.
- Bright colored volume bars are large volume spikes calculated by the x factor in the options.
Other changes:
- Volume Depth is going open source with numerous of its indicators. This is only one of many!
- Volume is now displayed without being altered for calculations.

volume with PriceThis script is for calculation for volume x price. Also include with target ( default =2M).

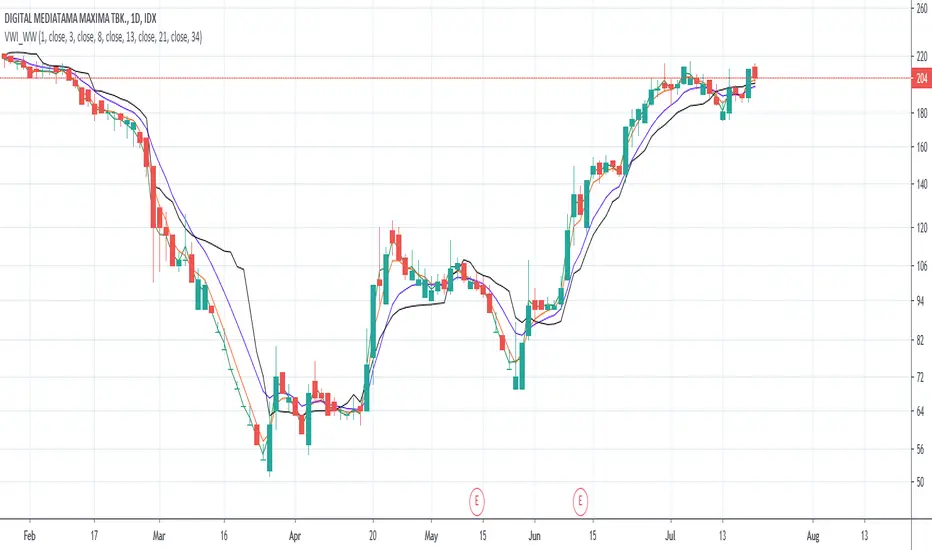
Volume-Weighted Indicators VWMA/VWAP/EMA_by WWAs traders and investors now urge to console volume factors into their price action analysis. This script is an attempt to combine volume-weighted moving average (VWMA), volume-weighted average price (VWAP), along with the exponential moving average (EMA). I have found that this indicator works quite well with the stock market.
How to use the indicator:
Buy when the VWAP and EMA lines crossing up VWMA.
Sell when the VWAP and EMA crossing down each other OR both VWAP and EMA crossing down VWAP
Any modificatio is welcomed, but please let me know.
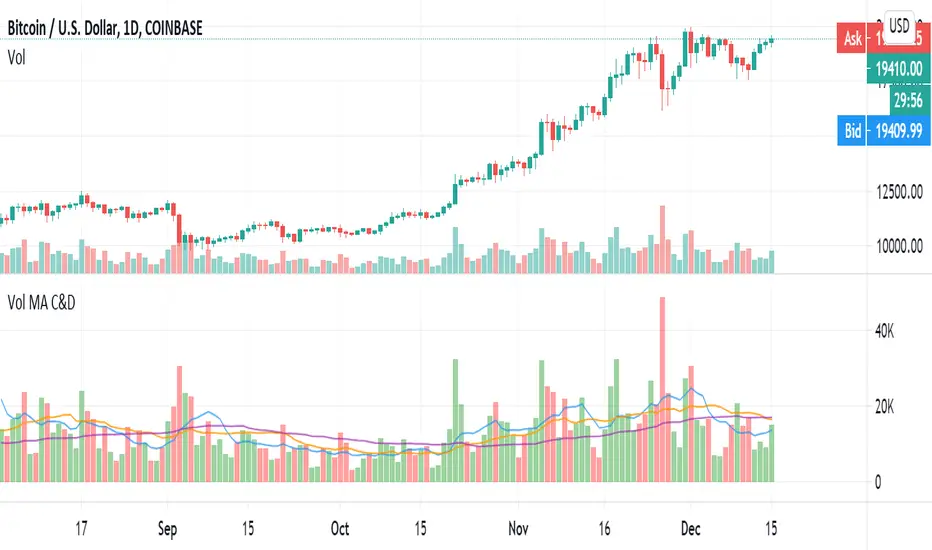
Volume, Simple Relative Volume HighlightThis script plots volume bars and highlight bars that have an unusual activity, compare to the average (Standard: Simple Moving Average, 50 periods).
The script is useful for checking daily volume levels on equities. Where there is high volume, there is likely volatility, wich is good for day trading and swing trading entries.

Volume Moving Average - evoThis script shows regular volume bars with two separate moving averages using only bullish and only bearish candles. The moving average uses the last known value of its calculation.
Using the Heikin Ashi function will smooth the colors and moving averages (good for trends):
The crossovers are a good way to see what the dominant direction of a trend is, if you test them on your time frame and instrument they might be good to trade on their own, I have not tested this and the default settings are not tuned for that.
As always, let me know if you like it or found a good way to use it :)

Volume xSMA ModSimple Volume indicator. showing rounded ratio of Current volume and simple moving average as xSMA (read as times SMA).
Quick metric to understand the impact of volume in trends, etc.
Example:
if Vol = 50 and SMA = 5
xSMA = 50/5 = 10
Indicated as the Third Number in Volume label.

volume low standard deviation stystemOn the basis of moving average, add moving average and standard deviation line of volume to filter the entry and exit time.
Filter entries and/or exits based on low volume
options = 1, no not enter on low volume
options = 2, exit on low volume
options = 3, both 1 and 2
For others, please refer to the code and notes。

volume high standard deviation stystemOn the basis of moving average, add moving average and standard deviation line of volume to filter the entry and exit time.
Do not enter trades on high volume and price in trend direction.
Exit on high volume and price in profitable direction.
Option 0 = No entry or exit filter
Option 1 = Entry filter only
Option 2 = Exit filter only
Option 3 = Both entry and exit filters

Volume LogA comfortable Volume Indicator with the following features:
Darker colors indicate positive changes
Light colors indicate negative changes
There are separate colors for changes above a configurable threshold
The threshold can look at percentages changes in either volume (directly) or the volume at log scale.
The graph itself is always displayed in regular format so the numbers indicate real value.
All the colors, log scale as well as the threshold are configurable through the visual interface.

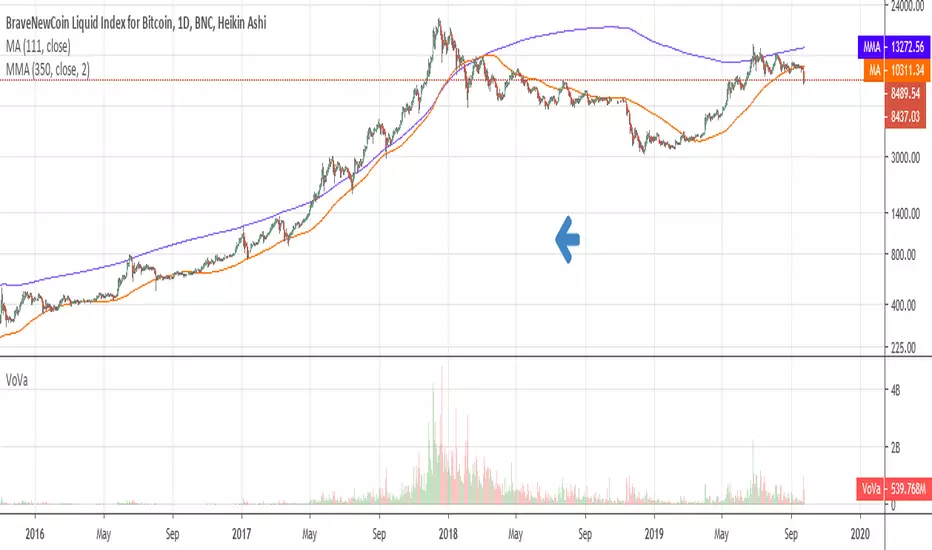
Volume Price ROC Tracker and Shadow CandlesWhen price goes up on negative volume, then market is telling there is doubts in investors mind.
The SPX upside recent month was a on. Lower volume so, the rally in my view will not last. Read my articles on current market.
This very simple scripts shows if price drop or gain was on a upside volume or down side. It is a visual track on the candle reflecting the volume ROC overlapped as a price movement on the actual candle. So don't mistake it with a moving average. Red means volume was down even if price has gone up. Basically if a price goes up on a increase ROC volume then you can trust it. Otherwise it is likely that it won't last.
If you can improve on this idea, it would be great. I think there is not enough volume related scripts that diggs a bit deeper to describe the market behaviour in the future. After all all technical analysis are supposed to tell us about future price not just how it was in the past.

Volume ComparisonThis script shows the volume of the current chart relative to the volume of another selected ticker.
For meaningful information you should compare coins with the same base pair (for example BTCUSD against LTCUSD).
Volume bars will be plotted green if the other security's volume is higher, red otherwise.
You may use this script go generate alerts and automate your trading with a bot such as WolfBot.org

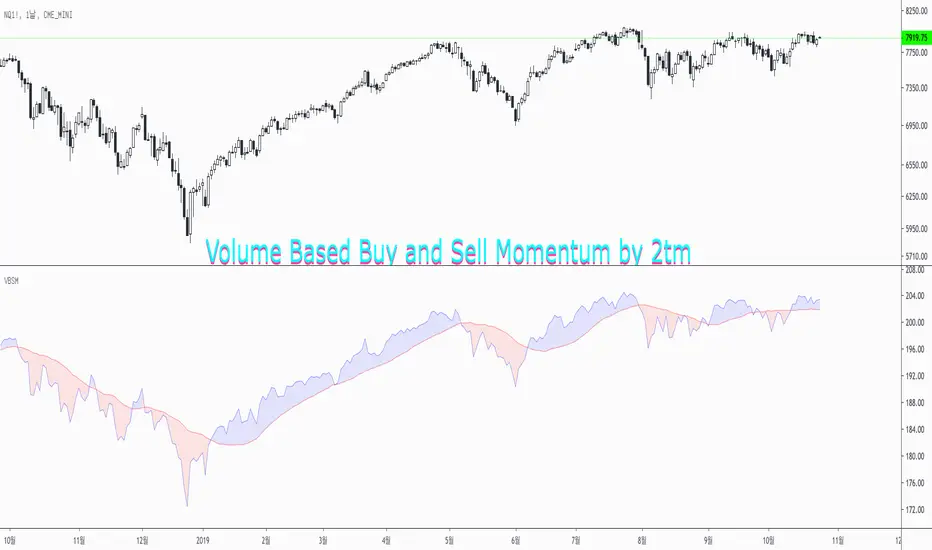
Volume Based Buy and Sell Momentum by 2tmThis is Volume based Buy and Sell Momentum script.
Basically I'd just adjusted PVI and NVI
But It's easy to understand current Volume trends and Momentums
Thank you and Wish your successful investment.
Volume ⨃ αMomentum 🦝🦾First attempt playing around with mixing volume and momentum... I find it to be nonsense, but putting it up for the moment.

Volume with directionOscillator plots cumulative volume with direction defined by price (positive price change = positive volume and vice versa) divided by volume sma.
It is good for divergence indication and can be used for trend change prediction.
It is faster then stoch with the same length.

Volume SpikeDetect current bar's volume is at least Ratio times than average volume of previous "Look back" bars.

Volume ValueInstead of the Volume this plots the closure price times volume, hence the Value.
Useful in study of long term phenomenons.
Volume @PuppyTherapyWell, you know what its Volume but I don't color it based on price but it just stays grey the moment it reaches a critical threshold level it is orange and spikes are very much red.
You can also set alerts on those spikes to make sure you are not missing the action.

Volume Flow v3DepthHouse Volume Flow indicator is used to help determine trend direction strictly based on Negative and Positive volume data.
How to Read:
- Moving Average crossovers are used to help determine a possible trend change or retracement.
- The area cloud on the bottom is calculated by the difference of the moving averages. This could be used to help determine the trending volume strength.
- Bright colored volume bars are large volume spikes calculated by the x factor in the options.
Other changes:
- DepthHouse is going open source with numerous of its indicators. This is only one of many!
- Volume is now displayed without being altered for calculations.

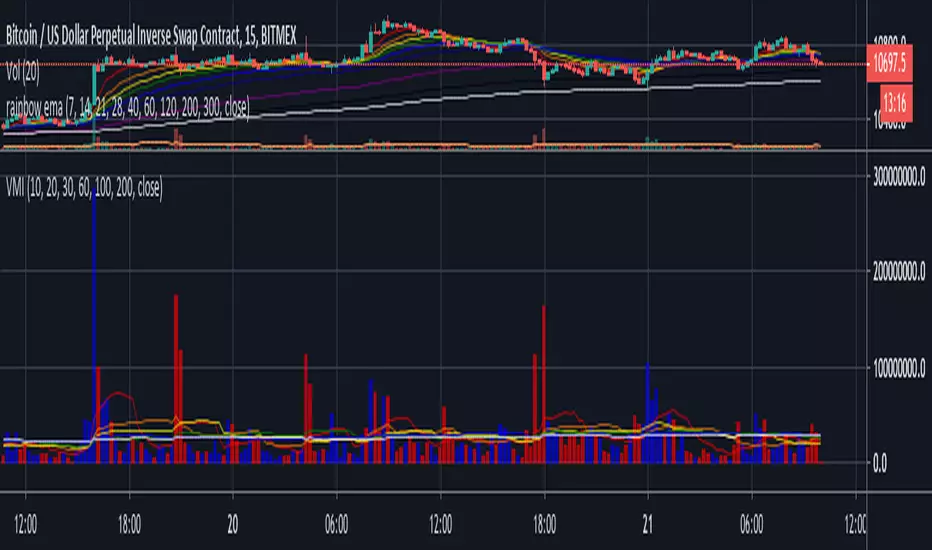
Volume moving indicatorHi guys,
This is a multiple Volume MA script. Editing is free for use.
You can use several ma lines by adding one indicator only, and I put 10,20,30,60,100,200 as a threshold which I frequently use.
It is made as an open source at any time possible, so that you are free for playing with it. Even you can add more if you are keen to do so.
Cheers,
JB