Cari dalam skrip untuk "volume"

Separate Volume IndicatorFor those that want the volume indicator in a separate view, this is for you. Now you can apply drawing tools, scale, hide, whatever you wish to the volume graph.
This is very similar to "Unmerge down" when applying the volume graph, but the idea being you can add more customization to the pine script rather than applying separate indicators.

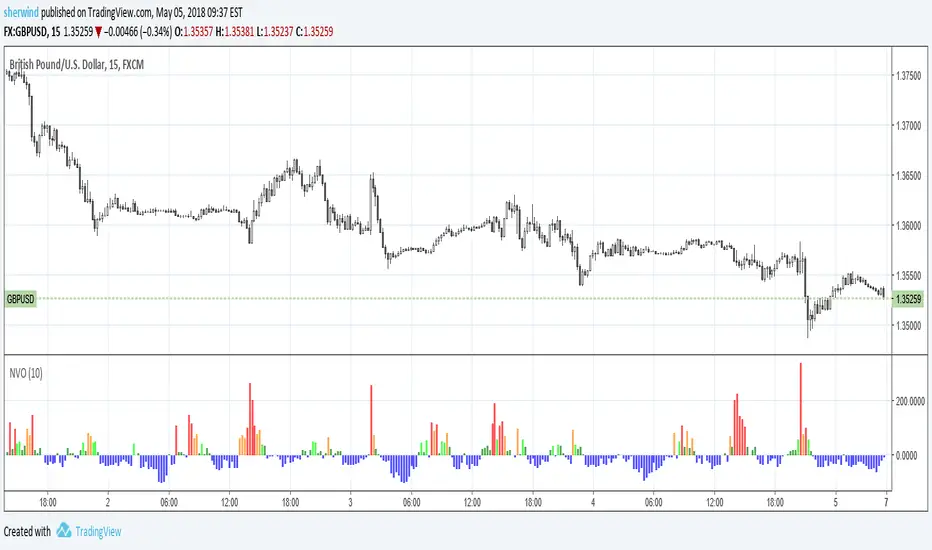
Normalized Volume OscillatorThis volume indicator works best on comparatively small timeframes (15 minutes, for example).
Based on:
- Normalized Volume Oscillator - indicator for MetaTrader 4
- Using Tick Volume in Forex: A Clear NVO Based Example
See also:
- Are price updates a good proxy for actual traded volume in FX?


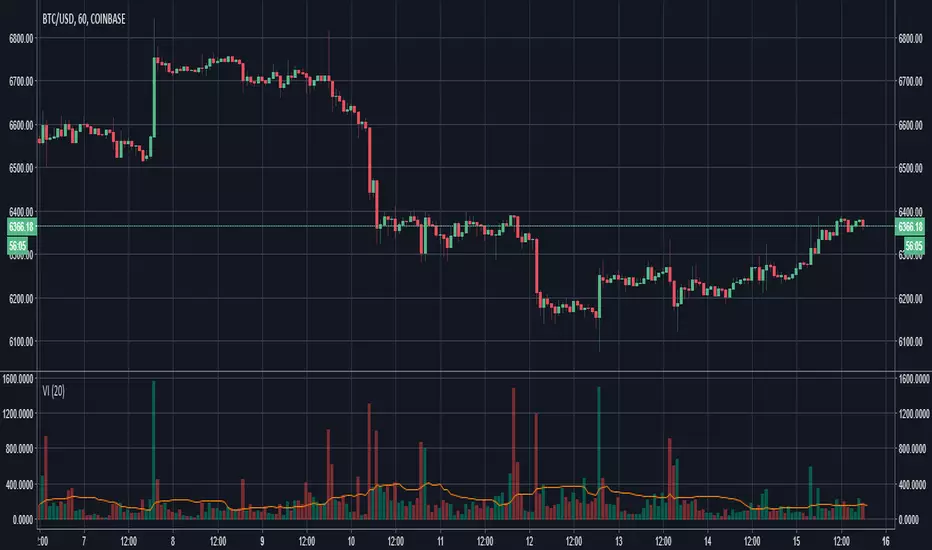
Aggregated BTC Exchange VolumeAggregated raw volume from 7 exchanges:
Bitfinex
Binance
Bitstamp
Kraken
Coinbase
bitFlyer
Bithumb

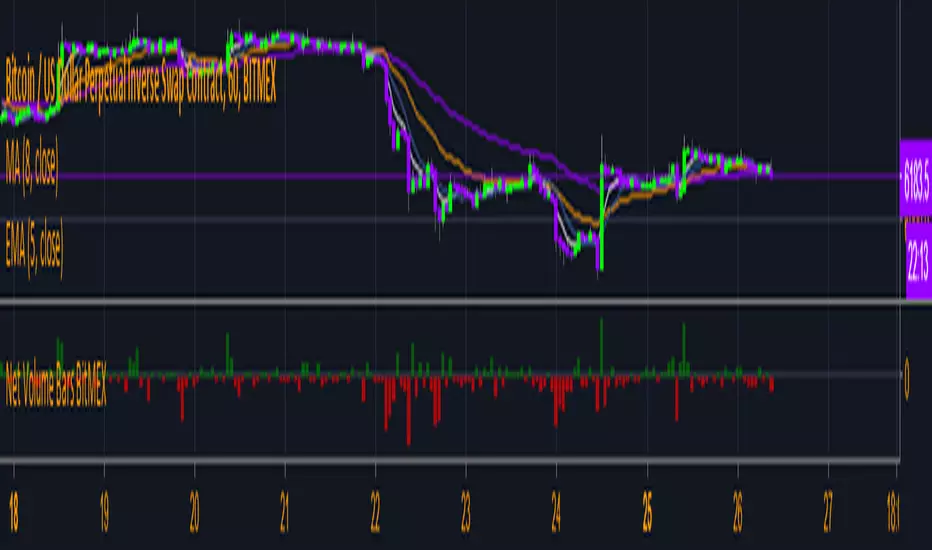
Aggregate BTC Volume for VSAIt adds volume from most popular BTC/USD exchanges to reduce the noise in data.

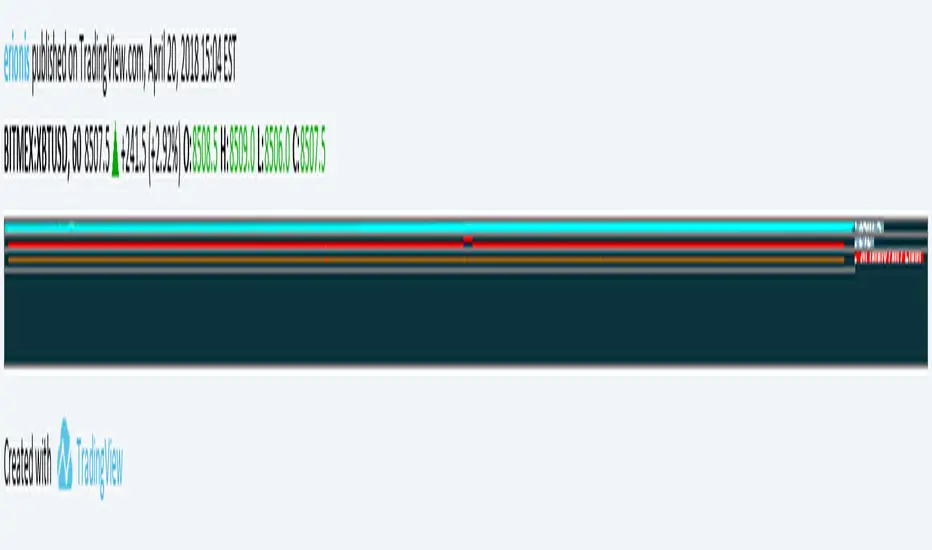
BTC Volume IndexBTC volume index for all BFX, GDAX, Stamp, Kraken, and Bitflyer. Also includes an overlay of the volume of the underlying asset (assumed to be BTC at whichever exchange you're viewing.
Happii Trades


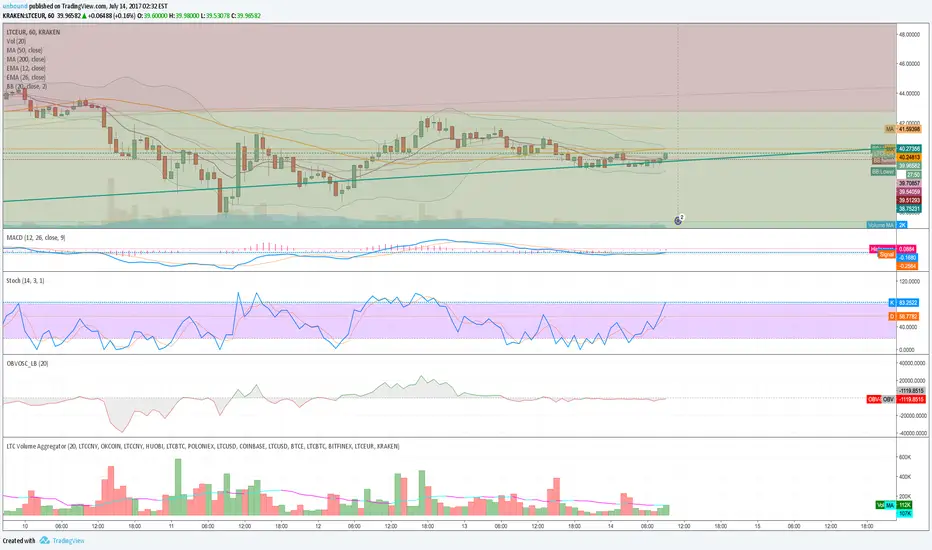
LTC Volume AggregatorThis script aggregates LTC volume from 7 major (with highest trading volume) LTC tickers available on tradingview.
Normalized Volume by MQNupe3This script adds a volume indicator that's normalized by SMA (10) by default. This will help you easily see whether the volume is actually high or not. It also highlights through volume is exceeding the average by making them column a brighter color.
This script was derived from Tradingview user: Vosechu . The original script came from the following: Normalized Volume by Vosechu. I just tweaked ths script so the volume bars do not float and I flipped the colors. He did all the hard work.

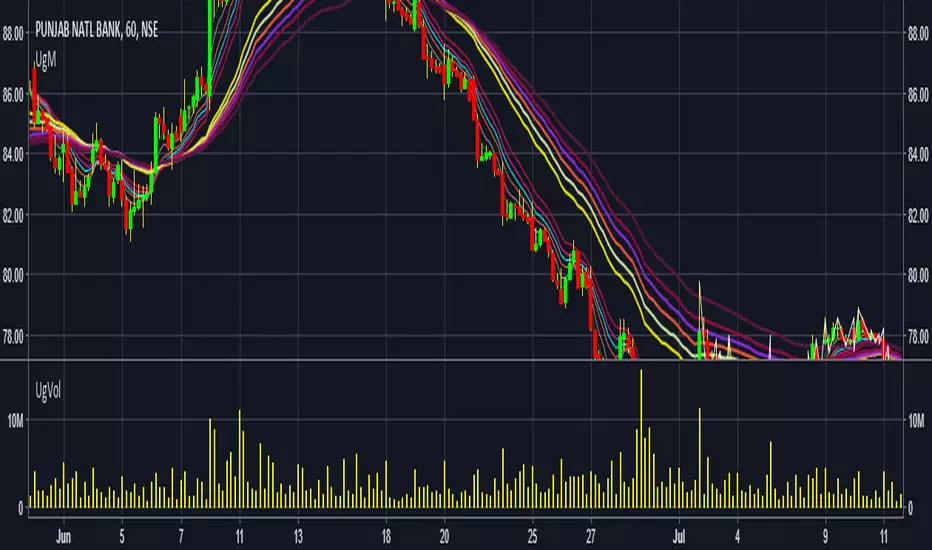
NIFTY IT volumeKEY TAKEAWAYS
-Uses NIFTY IT Index Stocks Volume .
-NIFTY IT Volume Indicator is created by adding all 10 NIFTY IT Stocks Volume together.
-NIFTY IT Volume will be an important indicator in NIFTY IT Index technical analysis because it is used to measure the relative significance of a market move.
-The higher the volume during a NIFTY IT index price move, the more significant the move and the lower the volume during a NIFTY IT index price move, the less significant the move.
-Moving Average is also added.

Average Volume at Time (AVAT)Calculation of average volume at current time for a number of previous sessions, known as Average Volume at Time (AVAT).
Inputs:
* period to use for accumulation. "D" is the default value, useful to view data for each session.
* number of previous sessions to average
TODO: more intelligent accumulation of number of bars in a session, since there may be sessions with different values
TODO: interpolate volume according to current time, inside of the last bar

Cumulative Volume v3The script, for Pine Script version 3, shows how to accumulate volume values during a defined session/period.
The input is the period to use for accumulation. "D" is the default value, useful to view data for each session.
This is slower than version 4 because there is no "var" and you need to use a loop. Also, you can't use "sum( volume , cnt_new_day)" with a variable length argument instead of "for".

Cumulative VolumeThe script shows how to accumulate volume values during a defined session/period.
The input is the period to use for accumulation. "D" is the default value, useful to view data for each session.

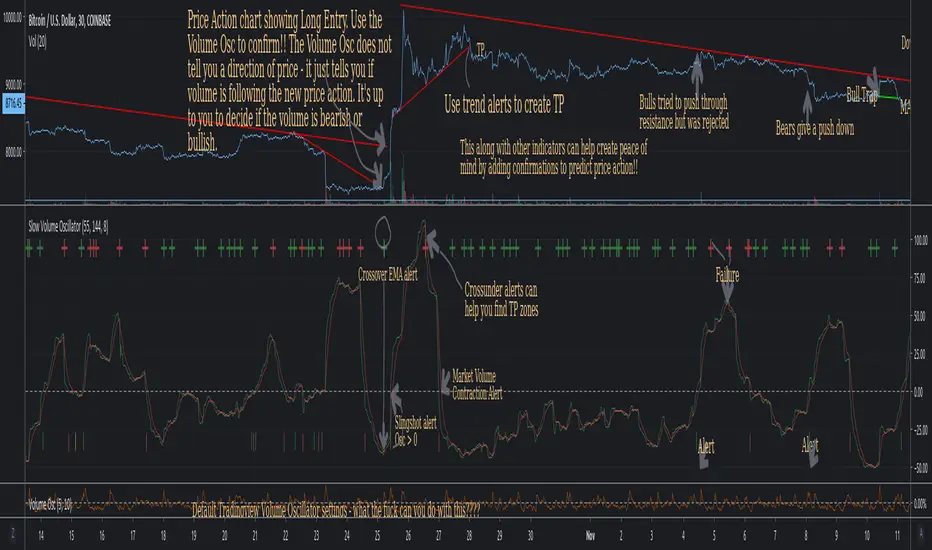
Slow Volume Oscillator Indicator - Just a Better Way To TradeThis script is nothing new. However, I feel that traders do not know the full potential it can provide if they just increase the lookback periods.
Tradingview's default Vol Osc uses a fast setting of 5 and a slow setting of 10. It just paints pointless scribbling. Slow all your indicators down and wake up to a whole new world of Technical Analysis.
To create consistency with variables I typically use Fib numbers for lookback periods. (3,5,8,13,21,34,55,89,144,233,377,610,987)
As noted in chart. An increase in volume can be either bullish or bearish. It's up to you to decide which way price action will move.
If you use with other indicators you can create more confirmations.
More confirmations = peace of mind
My favorite indicators are (Detrended Price Oscillator, Momentum, MACD, Chaikin Money Flow, Ultimate Oscillator, and this Volume Oscillator)
Here is just one example of MACD strategy indicator that can be used with this Vol Oscillator
[ST] BTC Volume Flow v4Update to volume flow script
optional colored candles, volume oscillator, strategy shapes
