Anchored VWAP & Standard DeviationsCalculates VWAP from a fixed point in time as well as standard deviations.
--------------------------------------
If you find it useful please consider a tip/donation :
BTC - 3BMEXEDyWJ58eXUEALYPadbn1wwWKmf6sA
--------------------------------------
Cari dalam skrip untuk "vwap"
All Time VWAP & Standard DeviationsAll time VWAP and standard deviations.
Either enable "scale price chart only" or disable deviations that go negative in the style options.
--------------------------------------
If you find it useful please consider a tip/donation :
BTC - 3BMEXEDyWJ58eXUEALYPadbn1wwWKmf6sA
--------------------------------------


Volume Trends (VWMA & VWAP)Basic indicator for tracking volume trends. Includes blue SMA and pink VWMA (volume-weighted moving average), to help gauge the strength of price movement -- is it supported by volume, or is there divergence. Intraday charts also have VWAP (volume-weighted average price) as dark purple dots.
Here's a couple of good articles explaining how to use them effectively:
www.tradeciety.com
stockcharts.com

Adjustable Starting VWAPIn this script it's possible adjust the start where the VWAP (technically is a VWMA) starts to calculate.
Use this to try to show where is the suport and resistance.
I coded 6 lines.
Use low sources for suport.
Use high sources for resistance.

VWAP Breakout NY Open Only vwap breakout targeting multiday taking only 2 trades per day in the first 2 hours of ny session

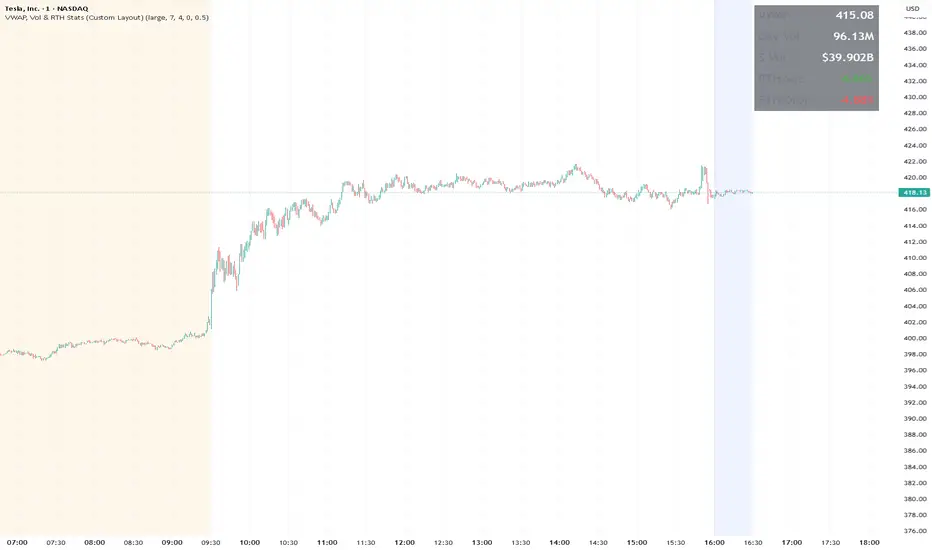
VWAP, Vol & RTH Stats (Custom Layout)VWAP, Volume & RTH Stats Box This indicator displays a data table in the top-right corner of the chart designed for intraday liquidity analysis. It fetches the true "Daily" volume to ensure accuracy regardless of the timeframe used. It specifically isolates Regular Trading Hours (RTH) to calculate the daily range performance (Max Squeeze % and Max Drop %), filtering out pre-market noise to show the true strength of the move. Includes full customization for dimensions, margins, and colors.
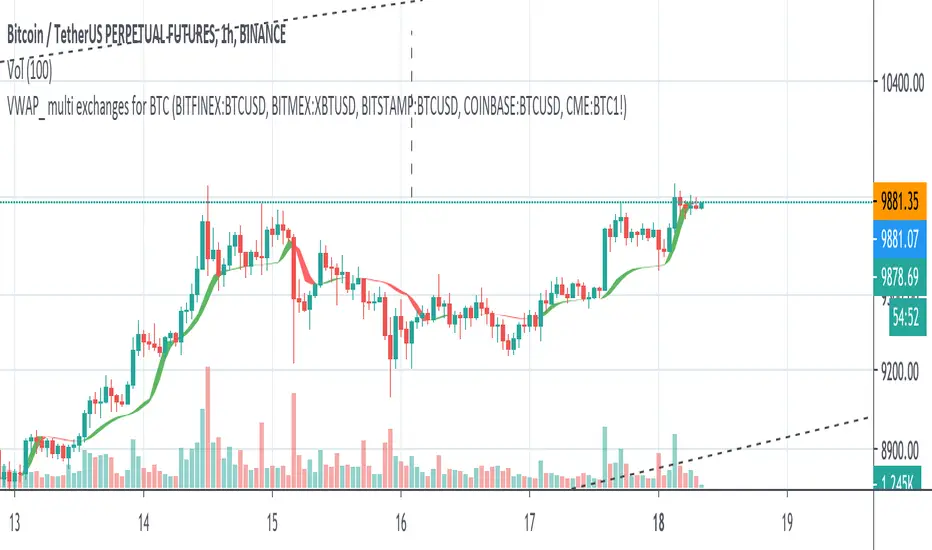
VWAP_ multi exchanges for crypto marketvwap of multiple exchanges to smooth the signal.
above the ribbon long.
under the ribbon short

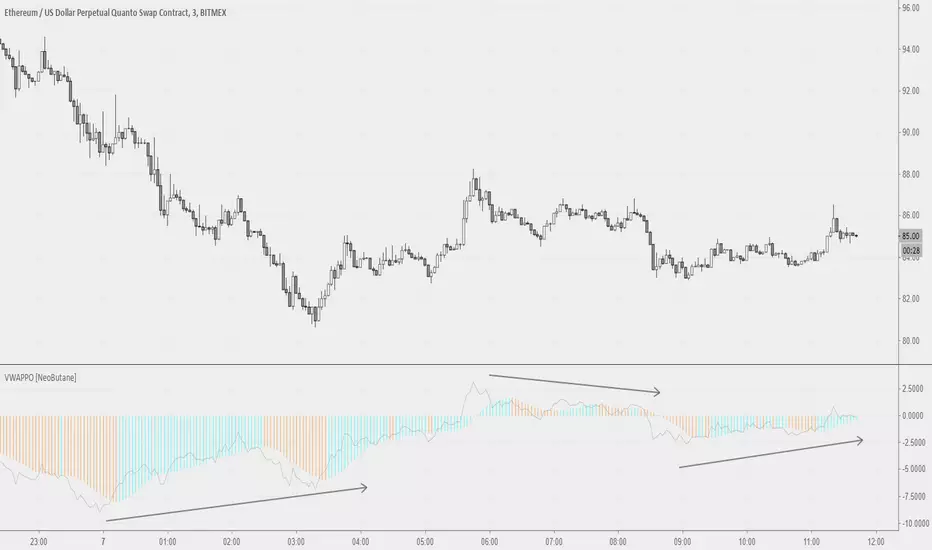
Volume Weighted Average Price Oscillator [NeoButane]VWAP on PPO but not PPO. Two histograms, with the second one being SMAs of the first and signals color/trend change.
1.0 - Release
Framework laid out
Power level readings should be within 9000
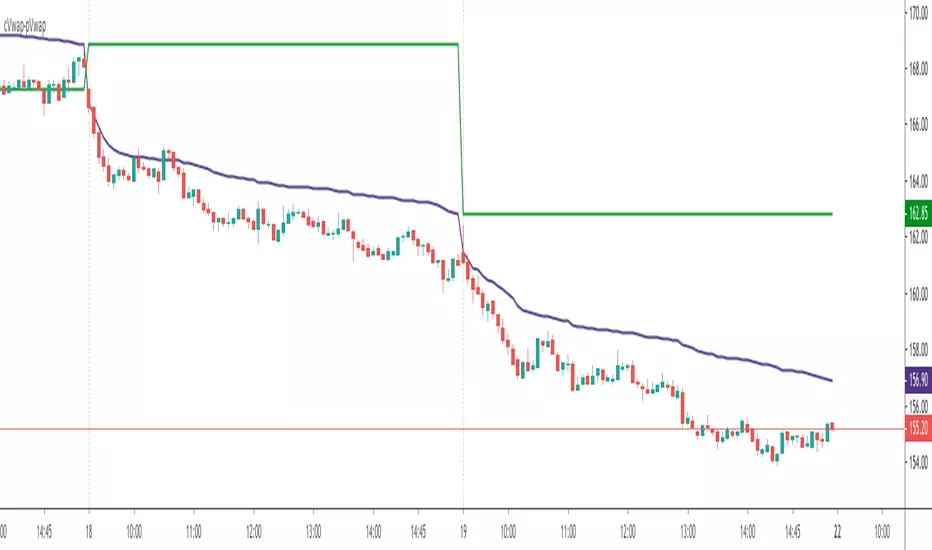
VWAP_CURRENT_YESTERDAY
The "VWAP CURRENT YESTERDAY" is a Pine Script designed for TradingView that automatically calculates and plots the Volume Weighted Average Price (VWAP) for the current day, the previous day.
Dynamic VWAP Calculation:
Automatically generates VWAPs for 1 day and 2 day.
User-Friendly Customization:
Through input options, users can easily toggle the visibility of each VWAP line, adjust colors, and set line thicknesses to their preference.
Configuration Options
1. VWAP Source:
Choose the price source for VWAP calculation. Default is the typical price (`hlc3` - the average of high, low, and close).
2. VWAP Lines:
Toggle the display for Today's VWAP, Yesterday's VWAP, and the VWAP from 2 days ago.
Customize colors and thickness for each VWAP line for clear visual distinction.
3. VWAP Labels:
Configure label sizes and positions to ensure that VWAP values are easily identifiable on the chart.
How It Works:
- The script calculates the sum of price multiplied by volume (`vwapsum`) and the sum of volumes (`volumesum`) for the specified periods.
- It utilizes an impulse function to reset calculations at the start of each new session or custom date, ensuring accurate and relevant VWAP values .
- Final VWAP values are plotted as lines on the chart, with optional labels for current and 2-day VWAPs for quick reference.
Customization Guide:
- To activate or deactivate specific VWAP lines, navigate to the 'VWAP Lines' section in the script's settings and toggle the respective options.
- Adjust the color and thickness of each VWAP line under the same section to match your charting preferences.
- Label settings, including size and offset, can be customized in the 'VWAP Labels' section, allowing for personalized label positioning and readability.

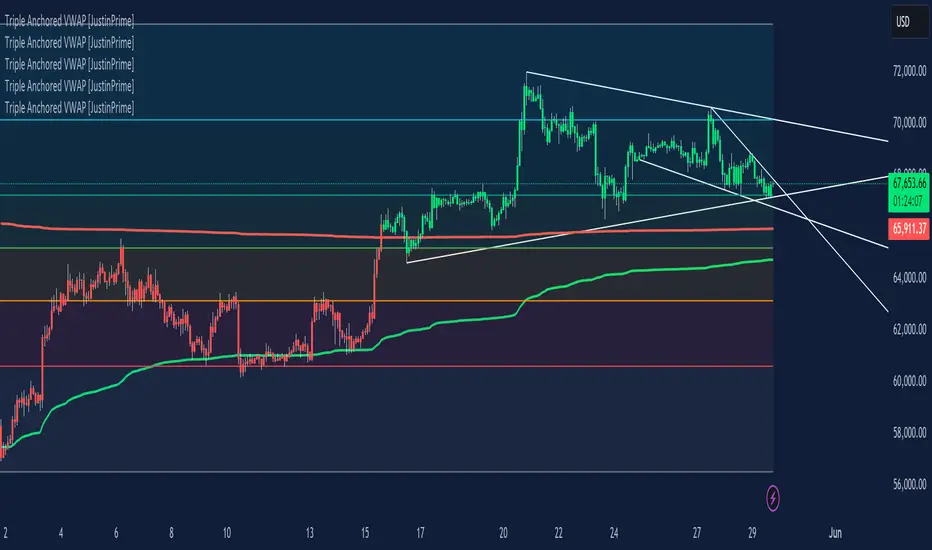
Triple Anchored Volume Weighted Average Price [JustinPrime]This indicator provides three separate Volume Weighted Average Price (VWAP) calculations, each anchored from different key points on the chart:
High Anchored VWAP: Resets from the highest price reached since the start date.
Low Anchored VWAP: Resets from the lowest price since the start date.
Start Date VWAP: Calculated from the trading data beginning at the user-defined start date.
Features:
Selectable Timeframe: Choose from timeframes like 1 minute, 5 minutes, 15 minutes, 1 hour, daily, and weekly.
Custom Start Date: Set a specific start date for the VWAP calculations.
Source Data: Uses high, low, and close prices (HLC3) for calculations.
How to Use:
Adjust the start date to focus on significant market periods or events.
Differentiate each VWAP with unique colors for clarity.
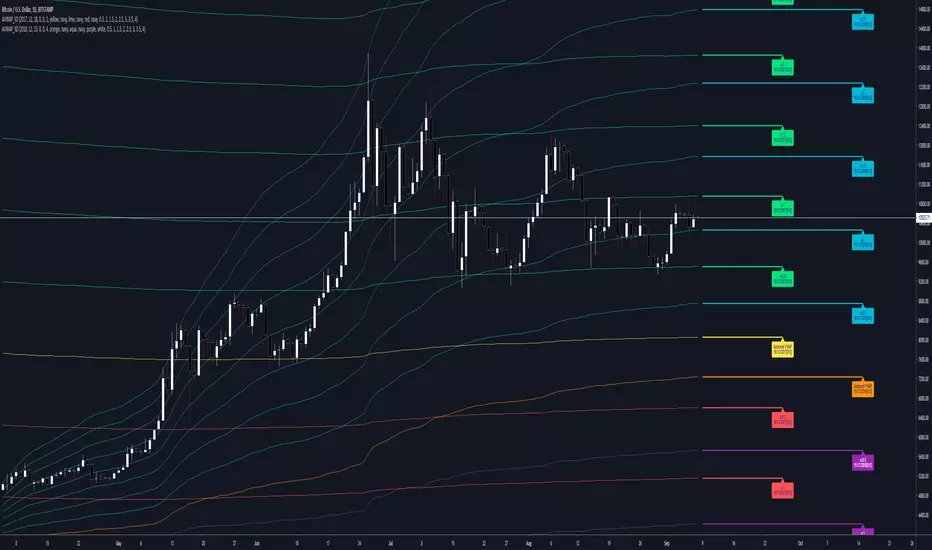
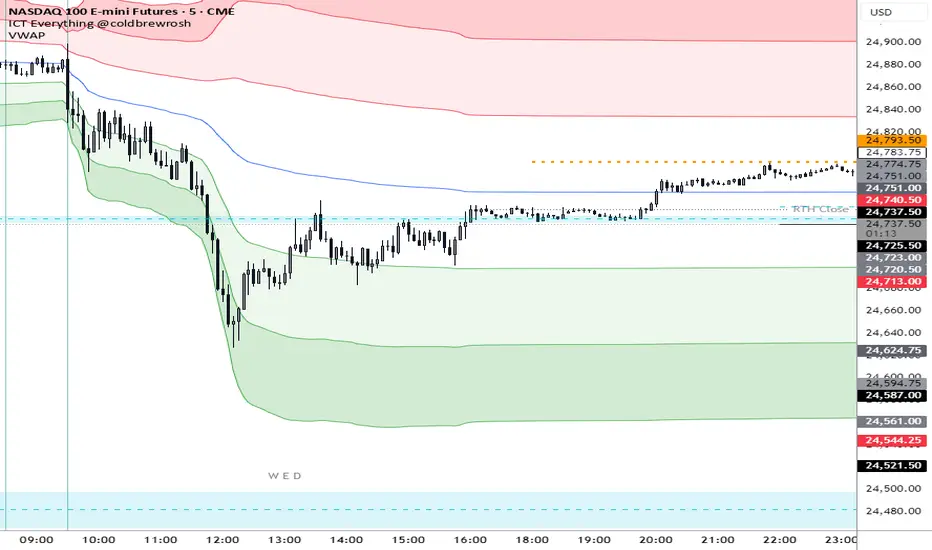
AVWAP Band✨ AVWAP Band by Mars ✨
The AVWAP Band indicator eliminates the guesswork of selecting multipliers for your VWAP analysis. Instead of using arbitrary deviations, this indicator provides three distinct VWAP lines calculated from different price points - giving you a complete VWAP band with just one tool.
What Makes This Different From Standard VWAP
Traditional VWAP indicators use multipliers (1.0, 2.0, 3.0) which require constant adjustment across different markets and timeframes. The AVWAP Band simplifies this by using natural price points:
Low-based VWAP (green) - acts as support
High-based VWAP (red) - acts as resistance
HL2-based VWAP (gray) - acts as the centerline
Key Features
Reduces cognitive load - no more guessing which multiplier to use
User-selected anchor point (click to set date)
Customizable colors and line styles
Built-in alerts for all crossover/crossunder events
Visual anchor point marker
How To Use It
After adding the indicator to your chart, you have to click on your anchor point
Watch for price reactions at each VWAP line
Look for crossovers between price and the different VWAPs
Use the HL2 VWAP as a centerline to determine overall bias
Trading Applications
Support/Resistance levels for intraday trading
Mean-reversion signals when price touches band extremes
Trend confirmation when price holds above/below centerline
Range identification between upper and lower bands
Volatility assessment based on band width
Customization Options
Toggle each VWAP line individually
Adjust line colors to match your chart theme
Control line width and transparency
Enable/disable anchor point label
This indicator simplifies VWAP analysis by giving you natural price-based bands without the need to adjust multipliers across different markets. The high, low, and HL2 sources create a complete VWAP picture with just one tool.
VIDEO
Feedback and suggestions welcome!
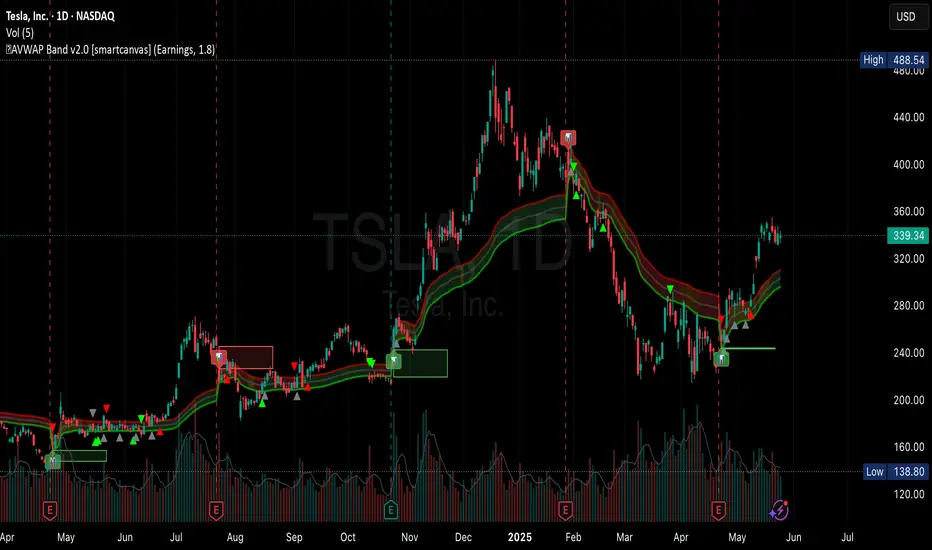
EVWAPThis indicator plots two Volume-Weighted Average Price (VWAP) lines anchored to earnings events:
EVWAP (Earnings Day): Resets VWAP on the day of the earnings release.
EVWAP (Post-Earnings Day): Resets VWAP on the first trading day after earnings.
These earnings-based VWAPs help identify average price zones impacted by earnings, providing insight into post-earnings support/resistance and potential trend shifts. Works on all timeframes.
Useful for traders analyzing price reactions around earnings reports.

MultiWAPThe VWAP tracks the average price, giving weight to each candle based upon its' relative volume.
In other words, high-volume candles move the VWAP faster than low-volume candles.
On a good day, market maker:
-Buys the dip
-Pumps past resistance, causing bullish FOMO
-Sells into the bullish FOMO, causing bearish FOMO
-Buys the dip (rinse and repeat)
By default, MultiWAP begins at the first visible bar.
Range low/high - tracks the most recent high/low
Upper VWAP - tracks retail's average buy price (MM is selling)
Lower VWAP - tracks MM's average buy price (MM is buying)
If price closes below the lower VWAP or the range low, the lower VWAP and range low are reset.
If price closes above the upper VWAP or the range high, the upper VWAP and range high are reset.
Resets are indicated by the dots. Resetting either VWAP moves it close to last price, making it easy to breach again.
A down-trend that lasts many bars will produce a string of green dots. When the accumulation phase ends, price pulls away from the lower VWAP, so it stops resetting. The ABSENCE of green dots tells you that we're in the markup phase/up-trend.
An up-trend that lasts many bars will produce a string of red dots. When the distribution phase ends, price pulls away from the upper VWAP, so it stops resetting. The ABSENCE of red dots tells you that we're in the markdown phase/down-trend.
By default, the net result is two VWAP's that automatically anchor themselves to the most recent, significant, and visible, high and low.
Usage:
For any timeframe, I recommend starting zoomed way out. Find the last green dot and drop an "Anchored VWAP" there. Now, zoom in until that candle is no longer visible. Find the last green dot and drop an anchored VWAP there. Continue doing so until you notice the lower VWAP getting reset to basically the same place.
This works the same, in reverse, during down-trends.

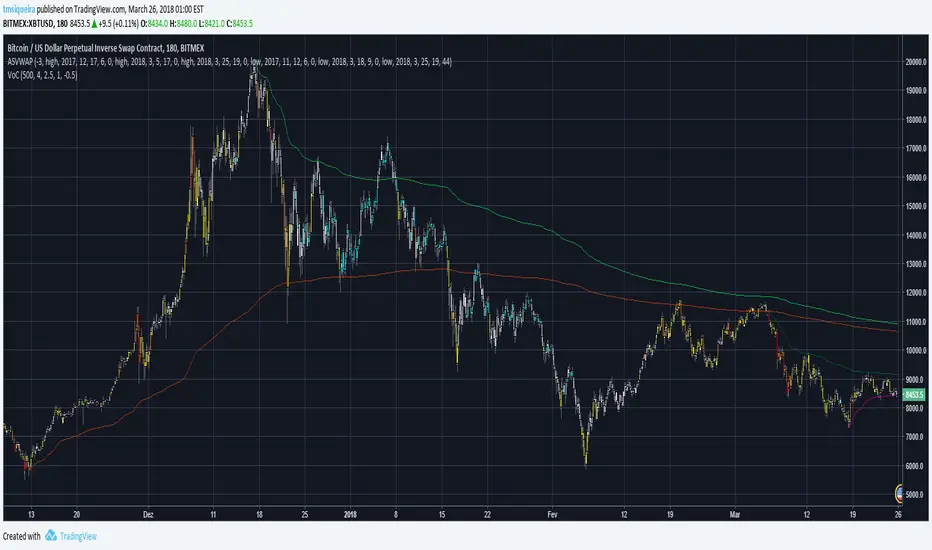
Spot v Perp aggrRollingVWAPThis indicator is a rolling VWAP that shows an aggregated BTC VWAP for both spot markets and futures markets
Spot VWAP is shown in BTC orange while perp VWAP is shown in blue
This is useful for identifying which market (spot or perps) is pushing trending moves
If the spot VWAP is more closely following the trend, then spot is pushing the move
If the perp VWAP is more closely following the trend, then perps are pushing the move
e.g. In the following picture you can see that the move down was followed much more closely by the spot VWAP, therefore you can assume that the move is being pushed my spot

[VJ] Mega Supertrend for IntradayThis is a simple intraday strategy for working on Stocks or commodities based out on Super Trend and intraday's best friend - VWAP . You can modify the start time and end time based on your timezones. Session value should be from market start to the time you want to square-off
Important: The end time should be at least 2 minutes before the intraday square-off time set by your broker
Comment below if you get good returns
Strategy: Tweaked Super trend with VWAP
Indicators used :
Super trend is simple and easy to use indicator and gives a precise reading about an on going trend.It is built with two parameters, namely period and multiplier.The Buy and Sell signal modifies once the indicator tosses over the closing price. When the Super trend closes above the Price, a Buy signal is generated, and when the Super trend closes below the Price, a Sell signal is generated. In this case we use it only for direction .
Multiplier is a vital input for Super trend. If the multiplier value is too high, then lesser number of signals is made.
Volume is important as we don’t want to get stuck with a stock which has few takers, even if you think it is priced attractively. Thus, the VWAP was created to take into account both volume as well as Price so that the potential trader would make the trading decision or not.
In simple terms, the Volume Weighted Average price is the cumulative average price with respect to the volume
Buying/Selling
when the closing price starts moving up/down and farther from the VWAP, there is pressure among the traders to sell/buy, a general belief kicks in that it might be that the stock is overvalued/undervalued .This is the time when we couple the Super trend to take our entries
Usage & Best setting :
Choose a good volatile stock and a time frame - 5m.
ST multiplier : 3
There is stop loss and take profit that can be used to optimise your trade
The template also includes daily square off based on your time.

Standardized ROC Engine (EMA Version)The purpose of this script is to create a standardized rate‑of‑change engine that compares the momentum of multiple structural anchors, specifically several EMAs, VWAP, price and volume. By converting each ROC stream into a z‑score, the indicator places all components on a common scale, allowing the trader to see when any anchor is accelerating or decelerating relative to its own long‑term distribution. This transforms raw ROC, which is naturally unstable and scale‑dependent, into a normalized momentum map that highlights extremes, clustering and regime shifts with far greater clarity.
The script works by first computing four EMAs of different lengths, along with VWAP, then calculating the percentage rate of change for each series over a user‑defined ROC window. Each ROC stream is then passed through a standardization function that subtracts its rolling mean and divides by its rolling standard deviation, producing a z‑score that expresses how unusual the current momentum is compared to the past. These standardized curves are plotted together, using consistent colors, while horizontal reference lines at one, two and three standard deviations provide visual thresholds for identifying statistically significant momentum events.
The rationale behind this architecture is that raw ROC values are not comparable across different structures because each anchor has its own volatility profile, amplitude and noise characteristics. Standardization solves this by converting every ROC stream into a dimensionless measure of deviation, enabling cross‑anchor comparison without distortion. This approach reveals when short‑term EMAs are accelerating faster than long‑term EMAs, when VWAP momentum diverges from trend momentum, and when volume expansion aligns with or contradicts price acceleration, all expressed in a unified statistical language that is robust across assets and timeframes.

[MCN] Volume Weighted Average PriceStandard VWAP with custom stdv colourings and the ability to anchor by midnight price.
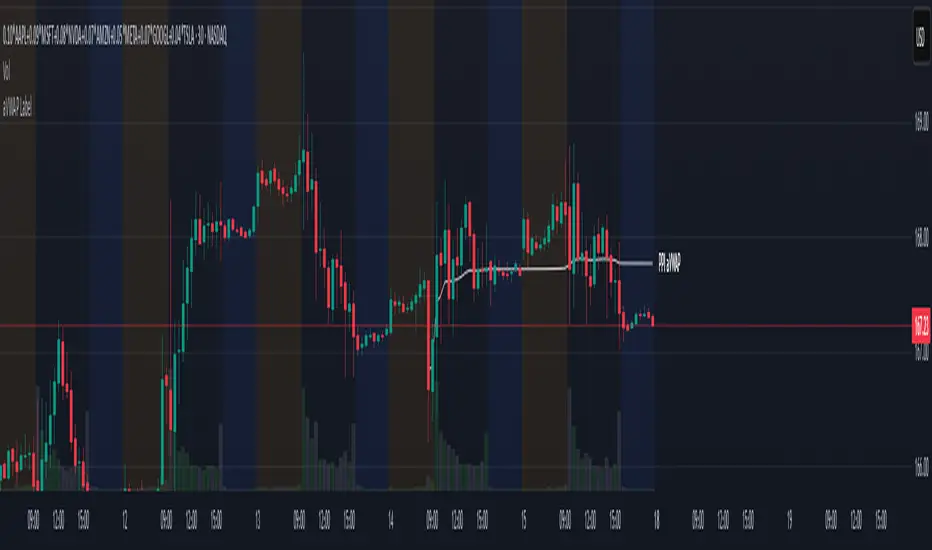
aVWAP with LabelAnchored VWAP with Label
- Select the indicator, a vertical line will appear on the chart to select the anchor
- Allows to hide the plot line while keeping the label, for a cleaner chart
- Allows 3 Presets of color and line width for types
News
Buyers
Sellers