aVWAP with LabelAnchored VWAP with Label
- Select the indicator, a vertical line will appear on the chart to select the anchor
- Allows to hide the plot line while keeping the label, for a cleaner chart
- Allows 3 Presets of color and line width for types
News
Buyers
Sellers
Cari dalam skrip untuk "vwap"
Two Days Auto Anchored VWAPEasier way to set anchors to today and last trading day's open.
All you need to do is to select today from the dates picker in Setting ➔ Inputs ➔ Anchor Today .
If last workday is holiday for the market, then overwrite by selecting Manually Set Prev Day
Next update: auto set today's anchor, so completely automatic

Custom_AVWAP_Harpal's-AnchorsAutomated VWAP Indicator written in PineScript for TradingView charts. Automatically Anchored at key swing H/L levels extracted from price and volume time-series.
Indicator takes one Argument, "LookBack (# of Periods)", and then for a given security finds three key anchors, the highest and lowest values in the 'hlc3' column (average of high low and close on the daily timeframe) in the last 'LookBack' # of days. The script displays up to three color coded time-series corresponding to a trailing Volume Weighted Average Price beginning at the anchor dates corresponding to the anchor points listed above.

Max of VWAP of last three daysThe script searches for max values of last three days and then calculates average of those values

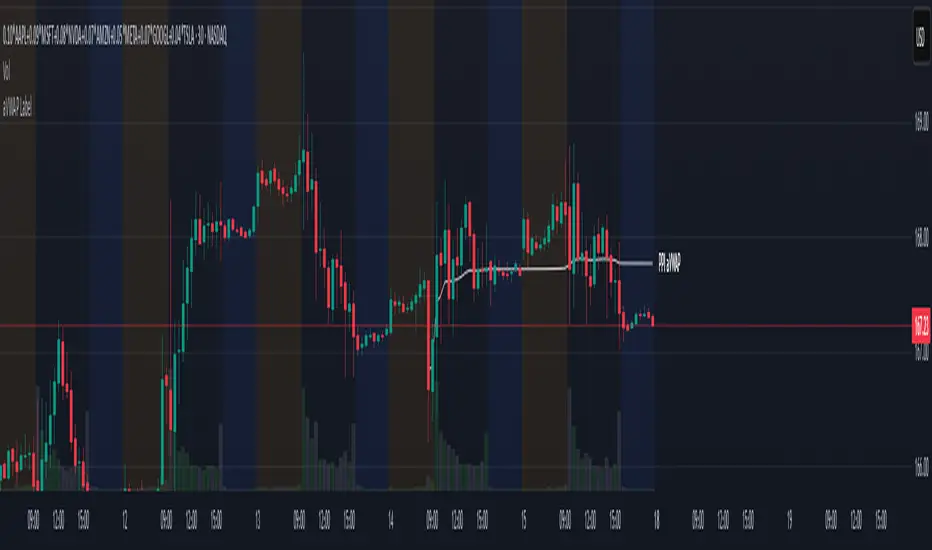
ZenAlgo - LevelsThis script combines multiple anchored Volume-Weighted Average Price (VWAP) calculations into a single tool, providing a continuous record of past VWAP levels and highlighting when price has tested them. Typically, VWAP indicators show only the current VWAP for a single anchor period, requiring you to either keep re-anchoring manually or juggle multiple instances of different VWAP tools for each timeframe. By contrast, this script automatically tracks both the ongoing VWAP and previously completed VWAP values, along with real-time detection of “tests” (when price crosses a particular VWAP level). It’s especially valuable for traders who want to see how price has interacted with VWAP over several sessions, weeks, or months—without switching between separate indicators or manually setting anchors.
Below is a comprehensive explanation of each component, why multiple VWAP lines working together can be more informative than a single line, and how to adjust the script for various markets and trading styles:
Primary VWAP vs. Historical VWAP Lines - Standard VWAP indicators typically focus on the current line only. This script also calculates a primary VWAP, but it “locks in” each completed VWAP value when a new time anchor is detected (e.g., new weekly bar, new monthly bar, new session). As a result, you retain an ongoing history of VWAP lines for every completed anchored period. This is more powerful than manually setting up multiple VWAP tools—one for each desired timeframe—because everything is handled in a single script. You avoid chart clutter and the risk of forgetting to reset your manual VWAP at the correct bar.
Why Combine Multiple Anchored VWAP Lines in One Script? - Viewing several anchored VWAP lines together offers synergy . You see not only the current VWAP but also previous ones from different sessions or months, all within the same chart pane. This synergy becomes apparent if multiple historical VWAP lines cluster near the same price level, indicating a potentially significant zone of volume-based support or resistance. Handling this manually would involve repeatedly setting separate VWAP indicators, each reset at specific points, which is time-consuming and prone to error. In this script, the process is automated: as soon as the anchor changes, a completed VWAP line is stored so you can observe how price eventually reacts to it, repeatedly or not at all.
Automated “Test” Detection - Once a historical VWAP line is set, the script tracks when price crosses it in subsequent bars. If the high and low of a bar span that line, the script marks it in red (both the line and its label). It also keeps a counter of how many times each line has been tested. This method goes beyond a simple visual approach by quantifying the retests. Because all these lines are created and managed in one place, you don’t have to manually label the lines or check them one by one.
Advantages Over Manually Setting Multiple VWAPs
You save screen space: Instead of layering several VWAP indicators, each with unique settings, this single script plots them all on one overlay.
Automation: When a new anchor period begins, the script “closes out” the old VWAP and starts a new one. You never need to remember to reset it manually.
Retest Visualization: The script not only draws each line but also changes color and updates the label automatically if a line gets tested. Doing this by hand would be labor-intensive.
Unified Parameters: All settings (e.g., array size, max distance, test count limit) apply uniformly. You can manage them from one place, instead of configuring multiple separate tools.
Extended Insight with Multiple VWAP Lines
Since VWAP reflects the volume-weighted average price for each chosen period, historical lines can show zones where the market had a fair-value consensus in previous intervals. When the script preserves these lines, you see potential support/resistance areas more distinctly. If, for instance, price continually pivots around an old VWAP line, that may reveal a strong volume-based level. With several older VWAP lines on the chart, you gain an immediate sense of where these volume-derived averages have appeared and how price reacted over time. This wider perspective often proves more revealing than a single “current” VWAP line that does not reflect previous anchor sessions.
Handling of Illiquid Markets and Volume Limitations
VWAP is inherently tied to volume data, so its reliability decreases if volume reporting is missing or if the asset trades with very low liquidity. In such cases, a single large trade might momentarily skew the VWAP, resulting in “false” test signals when the high/low range intersects an abnormal price swing. If you suspect the data is incomplete or the market is unusually thin, it’s wise to confirm the validity of these VWAP lines before using them for any decision-making. Additionally, unusual market conditions—like after-hours trading or sudden high-volatility events—may cause VWAP to shift quickly, setting up multiple lines in a short time.
Key User-Configurable Settings
Hide VWAP on Day timeframe and above : Lets you disable the primary VWAP plot on daily or higher timeframes for a cleaner view.
Anchor Period : Select from Session, Week, Month, Quarter, Year, Decade or Century. Controls how frequently the script resets and preserves the VWAP line.
Offset : Moves the current VWAP line by a specified number of bars if you need a shifted perspective.
Max Array Size : Caps how many past VWAP lines the script will remember. Prevents clutter if you’re charting very long histories.
Max Distance : Defines how far back (in bar index units) a line is kept. If a line’s start bar is older than this threshold, it’s removed, keeping the chart uncluttered.
Max Red Labels : Limits the number of tested (red) VWAP lines that appear. If price tests a large number of old lines, only the newest red labels remain once you hit the set limit.
Workflow Overview
As soon as a new anchor period begins (e.g., a new weekly candle if “Week” is chosen), the script ends the current VWAP and stores that final value in its internal arrays.
It creates a dotted line and label representing the completed VWAP, and keeps track of whether it has been tested or not.
Subsequent bars may then cross that line. If a bar’s high/low includes the line’s value, it’s flagged as tested, labeled red, and a test counter increases.
As new anchored periods come, old lines remain visible—unless they fall outside your maxDistance or you exceed the maximum stored line count.
Real-World Benefits
Combining multiple VWAP lines—ranging, for example, from session-based lines for intraday perspectives to monthly or quarterly lines for broader context—provides a layered view of the volume-based fair price. This can help you quickly spot zones where price repeatedly intersects old VWAPs, potentially highlighting where bulls or bears took action historically. Because this script automates the management of all these lines and flags their retests, it removes a great deal of repetitive manual work that would typically accompany multiple, separate VWAP indicators set to different anchors.
Limitations & Practical Use
As with any volume-related tool, the script depends on reliable volume data. Assets trading on smaller venues or during illiquid periods may produce spurious signals. The script does not signal buy or sell decisions; rather, it helps visually map out where volume-weighted averages from previous periods might still be relevant to market behavior. Always combine the insight from these historical VWAP lines with your existing analytical approach or other technical and fundamental tools you use.
Conclusion
This script unifies past and present VWAP lines into one overlay, automatically detecting new anchor resets, storing the final VWAP values, and indicating whenever old lines are retested by price. It offers synergy through the simultaneous display of multiple historical VWAP lines, making it quicker and easier to detect potential support/resistance zones and better reflect changing market volumes over time. You no longer need to manually create, configure, or reset multiple VWAP indicators. Instead, the script handles all aspects of line creation, retest detection, and clutter management, giving you a robust framework to observe how historical VWAP data aligns with current price action.
By understanding the significance of multiple anchored VWAP lines, you can assess market structure from multiple angles in a single view. As always, ensure you confirm the reliability of the volume data for your particular asset and use these lines in conjunction with other analyses to form a well-rounded perspective on current market behavior.

VWAP Diario + VWAP 08:00-12:00 ventanas NYWhat it plots
Daily VWAP (main line)
Anchored to the current trading day and only visible between 19:00 and 16:50 New York (UTC-5) to prevent any “ghost” segments.
Dynamic color: turns green when price closes above (bullish bias) and red when price closes below (bearish bias).
Optional standard-deviation/percentage bands (off by default).
08:00–12:00 VWAP (morning line)
Resets at 08:00 NY and shows until 12:00 NY only.
Acts as a morning value guide for early direction and pullbacks.
Clean rendering: Both lines use strict time masks and line breaks, so nothing is drawn outside their windows. You can toggle either line on/off.
How to Read It
Daily VWAP ≈ “fair value” of the whole session; use it for directional bias and confluence.
08:00–12:00 VWAP ≈ “fair value” of the morning; helps refine entries during the open.
Alignment:
Bullish environment: price and 08–12 VWAP sit above the Daily VWAP.
Rotation/mixed: price oscillates between the two lines.
Bearish: price and 08–12 VWAP sit below the Daily VWAP.
Two Mechanical Playbooks
Recommended charts: 1-minute for entries, 5-minute for context on NQ/Nasdaq100.
Primary execution window: 09:30–12:00 NY.
A) Trend Play (Break → Pullback to VWAP)
Goal: Join the day’s impulse with value confirmation.
Rules
Bias filter before 09:30
Bullish: 08–12 VWAP ≥ Daily VWAP; Bearish: 08–12 ≤ Daily.
First push 09:30–09:45 breaks the initial range high (bull) or low (bear).
Entry (pullback into confluence)
Wait for a pullback that tags/wicks the 08–12 VWAP or the Daily VWAP in the direction of bias.
Go long on bullish rejection (close back above); short on bearish rejection.
Stop-loss
Beyond the rejection wick or the touched VWAP (e.g., 1–1.5× ATR(1m/5m)).
Take-profit
TP1 = 1R (scale 50%); TP2 = 2–3R or day extremes (HOD/LOD).
If bands are on, consider exiting on a clean tag of the opposite band.
Management
Move to breakeven at 1R; exit early if price reclaims the opposite side of Daily VWAP.
Avoid when the morning is choppy and price sits glued between the two VWAPs.
B) Mean-Reversion Play (Controlled Reversal at Daily VWAP)
Goal: Capture a return to value after an overstretch and a clean rejection.
Rules
Stretch condition
Fast move away from Daily VWAP (3–5 bars) or beyond Band #1/#2 if enabled.
Rejection signal at Daily VWAP
A bar that touches Daily VWAP and closes back on the opposite side (pin/engulfing/strong close).
Entry
Long if a selloff rejects above Daily VWAP.
Short if a rally rejects below Daily VWAP.
Stop-loss
Just beyond the rejection wick or ~1× ATR(1m).
Take-profit
TP1 = 1R or the 08–12 VWAP; TP2 = 2–3R or a prior consolidation.
Management
If price crosses and holds on the other side of Daily VWAP (2 closes), cut the idea.
Avoid during high-impact news or when the session is strongly trending (prefer Play A).
Quality Filters
Volatility: Ensure ATR(14, 1m) or the 09:30–09:45 range exceeds your minimum.
Spread/liquidity: Skip abnormal spreads at the open.
News: If a red-level release is imminent, wait 2–3 bars after the print.
Coherence: Prefer trades when 08–12 and Daily VWAP don’t conflict.
Risk & Trade Management
Risk per trade: 0.25%–0.5% account risk.
Daily cap: 2–3 trades; stop for the day at –1R to –1.5R.
No over-reentry: Don’t chase if price is sitting exactly on a VWAP; wait for separation.
Log your metrics: setup type (A/B), confluences, distance to VWAP at trigger, time, R multiple.
Quick Pre-Trade Checklist
Bias aligned? (price vs Daily and 08–12 VWAP)
Choose Trend or Mean-Reversion play
Clear confluence at the VWAP line?
Realistic stop (≤ ~1.5× ATR 1m)?
Any imminent news?
TP plan: TP1 = 1R → BE, TP2 = 2–3R.

VWAP CALENDARThe VWAP CALENDAR indicator plots up to 20 anchored Volume-Weighted Average Price (VWAP) lines on your chart, each starting from a user-defined date and time (e.g., April 20, 2024). Designed for simplicity, it helps traders visualize VWAPs for key events or dates, with customizable labels and colors. The indicator is optimized for crypto markets (e.g., BTC/USD) but works with any symbol providing volume data.
Features: Multiple VWAPs: Configure up to 20
independent VWAPs, each with a custom anchor date and time.
Dynamic Labels: Labels update in real-time, aligning precisely with each VWAP line’s price level, positioned to the right of the chart for clarity.
Customizable Settings: Adjust label text (e.g., “Event A”), line colors, line widths (1–5 pixels), text colors, and text sizes (8–40 points, default 22).
Bubble or No-Background Labels: Choose between bubble-style labels (with colored backgrounds) or plain text labels without backgrounds.
Timeframe Support: Accurate on daily, 4-hour, 1-hour, and 30-minute charts for anchors within ~1.5 years (e.g., April 20, 2024, from August 2025).
Limitations: VWAP accuracy for anchors like April 20, 2024 (~477 days back) is reliable on 1-hour and larger timeframes. Below 30-minute (e.g., 15-minute, 24-minute), VWAPs may start later or be unavailable due to TradingView’s 5,000-bar historical data limit. For distant anchors, use 4-hour or daily charts to ensure accuracy.
Requires sufficient chart history (e.g., premium account or deep exchange data) for older anchors on 1-hour or 30-minute charts.
Usage Notes: Set anchor dates via the indicator settings (e.g., “2024-04-20 00:00”).
Enable/disable individual VWAPs as needed.
Zoom out to load maximum chart history for best results, especially on 1-hour or 30-minute timeframes.
Ideal for crypto symbols with continuous trading data, but verify data availability for other markets.
Disclaimer:
This is a free indicator provided as-is

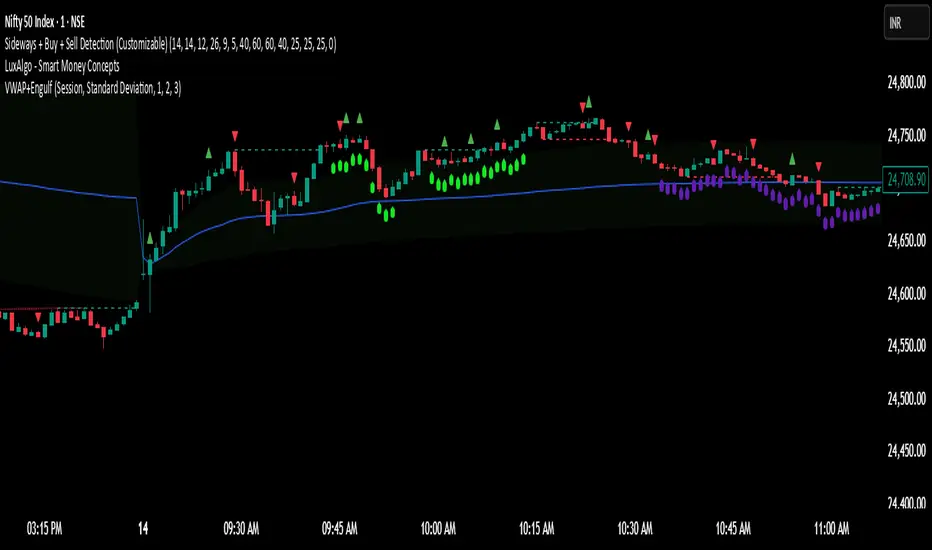
VWAP + Engulfing CandlesHere’s a clear breakdown of what your merged Pine Script does:
---
### 📌 **Indicator Name: VWAP + Engulfing Candles**
* This custom TradingView indicator **plots VWAP (Volume Weighted Average Price)** along with **up to 3 dynamic bands** around it.
* It also **detects Bullish and Bearish Engulfing Candlestick Patterns**, displaying visual markers and triggering alerts.
---
## 🔹 **1. VWAP Section**
### ➤ **Main Features:**
* Calculates VWAP anchored to a **customizable time period**:
* Options: Session, Week, Month, Quarter, Year, Decade, Century, Earnings, Dividends, Splits.
* Optional **hiding of VWAP on Daily/Weekly/Monthly charts** to reduce clutter.
### ➤ **Bands Around VWAP:**
* Up to **3 bands** can be plotted above and below the VWAP.
* Bands can be based on either:
* **Standard Deviation** of the price from VWAP (volatility-based), or
* **Percentage** deviation from VWAP (fixed range).
* You can control:
* Whether each band is shown
* Band width via multiplier (e.g., 1x, 2x, 3x)
### ➤ **Plot Colors:**
* VWAP: Blue
* Bands: Green (1x), Olive (2x), Teal (3x)
* Band fill areas are semi-transparent.
---
## 🔹 **2. Engulfing Candlestick Pattern Detector**
### ➤ **Bullish Engulfing Criteria:**
* Current candle opens **below** or **equal to** the close of the previous candle.
* Current candle opens **below** the previous candle's open.
* Current candle closes **above** the previous candle’s open.
### ➤ **Bearish Engulfing Criteria:**
* Current candle opens **above** or **equal to** the close of the previous candle.
* Current candle opens **above** the previous candle’s open.
* Current candle closes **below** the previous candle’s open.
### ➤ **Visual Signals:**
* 🔼 Green triangle **below bar** for **Bullish Engulfing**
* 🔽 Red triangle **above bar** for **Bearish Engulfing**
### ➤ **Alerts:**
* The script includes two alert conditions:
* One for Bullish Engulfing
* One for Bearish Engulfing
These alerts can be used to automate notifications for potential reversal points.
---
## 🛠️ **Use Cases**
* **Trend following or reversal spotting**: VWAP helps identify the average trading price; engulfing patterns often signal reversals.
* **Intraday and swing trading**: Works best on timeframes like 5m, 15m, 1h for intraday, or 4h, 1D for swing.
* **Mean reversion strategies**: Bands help spot overbought/oversold areas relative to VWAP.
VWAP Kalman FilterOverview
This indicator applies Kalman filtering techniques to Volume Weighted Average Price (VWAP) calculations, providing a statistically optimized approach to VWAP analysis. The Kalman filter reduces noise while maintaining responsiveness to genuine price movements, addressing common VWAP limitations in volatile or low-volume conditions.
Technical Implementation
Kalman Filter Mathematics
The indicator implements a state-space model for VWAP estimation:
- Prediction Step: x̂(k|k-1) = x̂(k-1|k-1) + v(k-1)
- Update Step: x̂(k|k) = x̂(k|k-1) + K(k)
- Kalman Gain: K(k) = P(k|k-1) / (P(k|k-1) + R)
Where:
- x̂ = estimated VWAP state
- K = Kalman gain (adaptive weighting factor)
- P = error covariance
- R = measurement noise
- Q = process noise
- v = optional velocity component
Core Components
Dual VWAP System
- Standard VWAP: Traditional volume-weighted calculation
- Kalman-filtered VWAP: Noise-reduced estimation with optional velocity tracking
- Real-time divergence measurement between filtered and unfiltered values
Adaptive Filtering
- Process Noise (Q): Controls adaptation to price changes (0.001-1.0)
- Measurement Noise (R): Determines smoothing intensity (0.01-5.0)
- Optional velocity tracking for momentum-based filtering
Multi-Timeframe Anchoring
- Session, Weekly, Monthly, Quarterly, and Yearly anchor periods
- Automatic Kalman state reset on anchor changes
- Maintains VWAP integrity across timeframes
Features
Visual Components
- Dual VWAP Lines: Compare filtered vs. unfiltered in real-time
- Dynamic Bands: Three-level deviation bands (1σ, 2σ, 3σ)
- Trend Coloring: Automatic color adaptation based on price position
- Cloud Visualization: Highlights divergence between standard and Kalman VWAP
- Signal Markers: Crossover and band-touch indicators
Trading Signals
- VWAP crossover detection with Kalman filtering
- Band touch alerts at multiple standard deviation levels
- Velocity-based momentum confirmation (optional)
- Divergence warnings when filtered/unfiltered values separate
Information Display
- Real-time VWAP values (both standard and filtered)
- Trend direction indicator
- Velocity/momentum reading (when enabled)
- Divergence percentage calculation
- Anchor period display
Input Parameters
VWAP Settings
- Anchor Period: Choose calculation reset period
- Band Multipliers: Customize deviation band distances
- Display Options: Toggle standard VWAP and bands
Kalman Parameters
- Length: Base period for calculations (5-200)
- Process Noise (Q: Higher values increase responsiveness
- Measurement Noise (R): Higher values increase smoothing
- Velocity Tracking: Enable momentum-based filtering
Visual Controls
- Toggle filtered/unfiltered VWAP display
- Band visibility options
- Signal markers on/off
- Cloud fill between VWAPs
- Bar coloring by trend
Use Cases
Noise Reduction
Particularly effective during:
- Low volume periods (pre-market, lunch hours)
- Volatile market conditions
- Fast-moving markets where standard VWAP whipsaws
Trend Identification
- Cleaner trend signals with reduced false crosses
- Earlier trend detection through velocity component
- Confirmation through divergence analysis
Support/Resistance
- Filtered VWAP provides more stable S/R levels
- Bands adapt to filtered values for better zone identification
- Reduced false breakout signals
Technical Advantages
1. Optimal Estimation: Mathematically optimal under Gaussian noise assumptions
2. Adaptive Response: Self-adjusting to market conditions
3. Predictive Element: Velocity component provides forward-looking insight
4. Noise Immunity: Superior noise rejection vs. simple moving average smoothing
Limitations
- Assumes linear price dynamics
- Requires parameter optimization for different instruments
- May lag during sudden volatility regime changes
- Not suitable as standalone trading system
Mathematical Background
Based on control systems theory, the Kalman filter provides recursive Bayesian estimation originally developed for aerospace applications. This implementation adapts the algorithm specifically for financial time series, maintaining VWAP's volume-weighted properties while adding statistical filtering.
Comparison with Standard VWAP
Standard VWAP Issues Addressed:
- Choppy behavior in low volume
- Whipsaws around VWAP line
- Lag in trend identification
- Noise in deviation bands
Kalman VWAP Benefits:
- Smooth yet responsive line
- Fewer false signals
- Optional momentum tracking
- Statistically optimized filtering
Alert Conditions
The indicator includes several pre-configured alert conditions:
- Bullish/Bearish VWAP crosses
- Upper/Lower band touches
- High divergence warnings
- Velocity shifts (if enabled)
---
This open-source indicator is provided as-is for educational and trading purposes. No guarantees are made regarding trading performance. Users should conduct their own testing and validation before using in live trading.

VWAP table with color
## 📊 VWAP Table with Color – Clear VWAP Deviation at a Glance
This script displays a **VWAP (Volume-Weighted Average Price)** table in a non-intrusive, color-coded panel on your chart. It helps you **quickly assess where the current price stands relative to VWAP**, classified into sigma bands (standard deviations). The goal is to provide valuable VWAP insight **without cluttering the chart with multiple lines**.
---
### 🔍 Purpose & Concept
VWAP is a powerful tool used by institutional traders to measure the average price an asset has traded at throughout the day, based on both volume and price.
In this script:
- We **do not plot traditional VWAP lines** with multiple ±1σ, ±2σ, etc., on the chart.
- Instead, we **summarize VWAP and its relative position in a table**, color-coded by deviation.
- This provides the **same information**, but in a **cleaner, minimal, and visually digestible format**.
---
### 🧠 VWAP Deviation Classification
The script calculates how far the current price is from the VWAP, in units of **standard deviation (σ)**.
The formula is:
```plaintext
VWAP Delta σ = (Current Price - VWAP) / Standard Deviation
```
This gives you a normalized value for deviation from VWAP, and it is **clamped between -3 and +3** to avoid extreme outliers.
Each range is color-coded and classified as:
| VWAP Δσ | Zone | Interpretation | Color |
|---------|---------------|------------------------------------------|--------------|
| -3σ | Far Below | Strongly below VWAP – potentially oversold | 🔴 Red |
| -2σ | Below | Below VWAP – bearish territory | 🟠 Orange |
| -1σ | Slightly Below| Slightly under VWAP – weak signal | 🟡 Yellow |
| 0σ | At VWAP | Price is around VWAP – neutral zone | ⚪ Gray |
| +1σ | Slightly Above| Slightly above VWAP – weak bullish | 🟢 Lime Green |
| +2σ | Above | Above VWAP – bullish signal | 🟢 Green |
| +3σ | Far Above | Strongly above VWAP – potentially overbought | 🟦 Teal |
This **compact summary in the table** provides a clear situational view while keeping the chart clean.
---
### ⚙️ User Customization
Users can configure:
- **VWAP σ Multiplier** (default 0.1) to set the width of the optional VWAP band on the chart.
- **Table Position** (Top Center, Bottom Right, etc.).
- **Text Size** and **Text Color**.
- **Hide VWAP logic**: VWAP data can be hidden automatically on higher timeframes (e.g., daily or weekly).
- **Enable/disable the VWAP ±σ band lines** (optional visual aid).
---
### 📐 Technical Highlights
- VWAP is recalculated each day using `ta.vwap(hlc3, isNewPeriod, 1)`.
- The band width uses standard deviation and the selected multiplier: `VWAP ± σ * multiplier`.
- Table updates dynamically with the new VWAP values each day.
- To **avoid floating-point rounding issues**, `vwapDelta` is rounded before comparison, ensuring correct background color display.
---
### ✅ Why Use This?
- Keeps your chart **visually clean and readable**.
- Gives **immediate context** to current price action relative to VWAP.
- Helps **discretionary traders** or **scalpers** decide whether price is stretched too far from the mean.
- Easier than tracking multiple σ bands manually.
---
### Example Usage:
- On intraday timeframes, you can identify price exhaustion as it hits ±2σ or ±3σ.
- On a 5-minute chart, if price touches `+3σ`, you may consider taking profits on longs.
- On reversal setups, watch for price at `-3σ` with bullish divergence.
---
### 🧩 Future Enhancements (Optional Ideas)
- Add alerts for when `vwapDelta` crosses thresholds like ±2σ or ±3σ.
- Let user select the timeframe for VWAP source (e.g., 1H, 5M, etc.).
- Extend to display VWAP on session or weekly basis.
---
Let me know if you want a version of this script formatted and cleaned up for direct TradingView publication (with annotations, credits, and formatting). Would you like that?

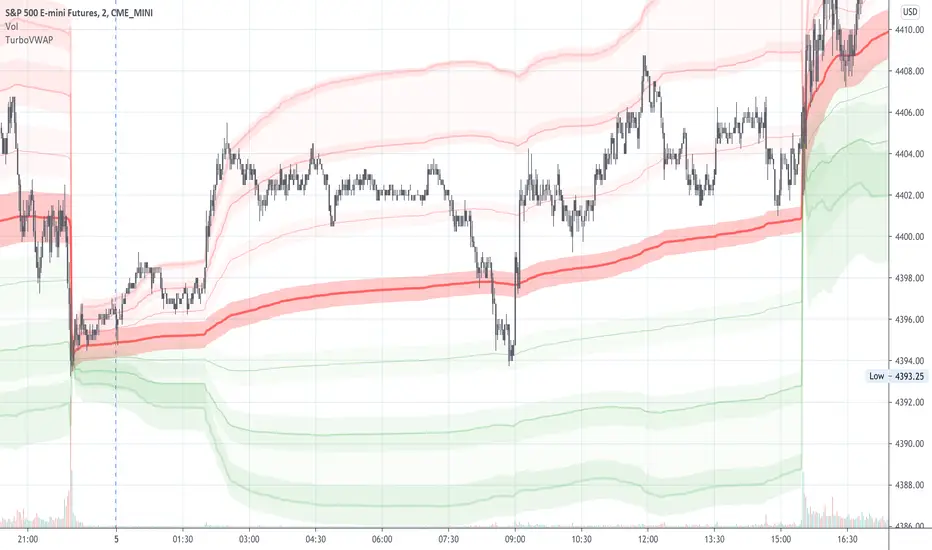
TurboVWAPVWAP indicator based in the built-in one but completely rewritten. Features:
- more standard deviation bands, up to 3.
- added the possibility to not anchor the VWAP but make it a rolling one instead, like a VWMA, being in this case able to specify days, hours or minutes for the rolling VWAP.
- for rolling VWAPs, the indicator doesn't count bars but real days, hours or minutes instead, so regardless of the chart timeframe the indicator will always show the correct values.
- for rolling VWAPs, if you specify x days as the rolling time, the indicator will always count exactly 24 hours from the current time backwards - so, from the same time yesterday or x days ago.
- in rolling VWAPs, although the indicator counts real time elapsed as per your settings and not chart bars, it will automatically skip holidays, so you needn't worry about that.
- for the anchored VWAP, added the possibility to specify custom session times (for example, for ES 0830-1500, instead of Globex, which is the Tradingview default as of today)
- complete customization of all fills and linetypes
For illustration purposes in the attached 1min chart I have:
- a 30min rolling VWAP in BLUE with no standard deviation plots,
- a 1 day rolling VWAP in RED with standard deviations in light red and green (these are the default settings)
- a RTH-session-anchored VWAP in ORANGE with standard deviations in light orange and light blue
VWAP roller autoBrief Description
VWAP Roller Auto is a TradingView Pine Script indicator that combines a rolling (resetting) Volume Weighted Average Price (VWAP) with dozens of dynamic support/resistance levels derived from Gann's Square of 9 principles. The VWAP resets periodically (automatically or manually) starting from a user-defined session open time, and the Gann levels "roll" with it, creating an adaptive grid of potential price reaction zones. It's designed for intraday trading and overlays directly on the price chart.
Key Features
Rolling VWAP with Custom Session Start
VWAP calculation restarts at configurable session open (default 8:30 CST, using proper Chicago timezone handling).
Auto-Adaptive Period Selection
Automatically chooses the VWAP reset period (from 2 min up to 48 hours) based on current volatility (ATR + realized range). Targets a user-defined spacing (~0.08% by default) between consecutive VWAPs to keep the grid relevant to market conditions. Falls back to manual period if disabled.
Gann Square of 9 Levels
Generates ~8 pairs of resistance (R) and support (S) levels above/below the current rolling VWAP using octave-based increments.
Two increment modes:
Points mode — fixed point steps that double octavely (e.g., 0.305, 0.610, 1.22, 2.44, etc.).
Percent mode — percentage steps scaled so the middle octave aligns near 0.025% for finer resolution on lower-priced assets.
Visual Enhancements
Colored fills between key level groups (e.g., inner ±0.25 octave in blue, ±1–2 octave zones in gray, higher extremes in yellow/red).
Labels on the right side marking important zones ("low", "normal", "high", "3/4 - ps1", "extreme - ps2").
Central VWAP line (customizable color and offset).
Table showing current period length and whether auto mode is active.
Non-Timeframe Friendly
Works on range bars, Renko, etc., using fallback settings when timeframe is non-standard.
Use Cases
Intraday Support/Resistance Trading
Treat the rolling VWAP as fair value and use the Gann-derived levels as dynamic zones for potential reversals, breakouts, or mean reversion.
Scalping and Day Trading
Auto-period ensures the grid spacing matches current volatility — tighter levels in quiet markets, wider in volatile ones — ideal for futures (ES, NQ), crypto, or forex.
Zone-Based Entries/Exits Buy near labeled support zones (e.g., "low" or "normal" volatility bottoms) when price trades below VWAP.
Sell/short near resistance zones in overbought conditions.
Watch for hits of "extreme" zones (±8 octave) as potential strong reversal signals.
Confluence Tool
Combine with order flow, volume profile, or other indicators; the colored fills highlight "value areas" similar to market profile concepts but anchored to a rolling VWAP.
In short, VWAP Roller Auto provides a sophisticated, self-adjusting Gann-inspired grid that moves with the market's fair value, helping traders identify high-probability reaction zones throughout the trading session.

Volume Weighted Average Price AdvancedVWAP (Advanced) with Multi‑Venue Aggregation and Historical Value Areas
Core: Anchored VWAP with configurable anchor (session/week/month/quarter/year/decade/century or corporate events), offset, and up to three standard-deviation bands.
Multi‑Venue Aggregation: Optionally pull price/volume from up to 5 additional exchanges/symbols (pair-matched by default). VWAP/σ are computed on the aggregated price*volume.
Value Area Blocks: Each completed anchor draws a block from the chosen basis (±1σ or ±2σ) or an optional percentile-based range (default 20–80%). Blocks project to the exact next anchor boundary, or you can extend them to the latest bar. Prior-period VWAP lines are shown inside the blocks.
Volume Gate: Optionally skip drawing prior blocks when the anchor’s aggregated volume is below a median/mean baseline times a multiplier.
HTF Context: Optional higher-timeframe VWAP overlay; can filter the current VWAP/bands so they only show when aligned with the HTF VWAP.
Venue Health: Label shows how many extra venues were included (non‑na) and median venue volume; flags divergence when primary volume is below venue median × threshold.
Alerts: Price in current value area (VWAP ±1σ) and price crossing the most recent prior VWAP.
Styling: Bands and fills are minimal; HTF VWAP is a distinct line; value-area blocks are shaded with prior VWAP lines inside.
Configure via the grouped inputs: VWAP Settings, Additional Exchange Sources, Historical Value Areas, HTF Context, and Bands Settings.

VWAP + Volume Spikes See Where Smart Money ExhaustsVolume tells the truth. VWAP tells the bias. This script shows both — live.
If you trade intraday momentum, reversals, or liquidity sweeps, this indicator is built for you.
It shows where volume spikes hit extreme levels, anchored around VWAP and its dynamic bands, so you can instantly spot capitulation or hidden absorption.
🎯 What This Indicator Does
✅ Plots VWAP — session-anchored, updates automatically
✅ Adds dynamic VWAP bands — standard deviation envelopes showing volatility context
✅ Highlights volume spikes — colored candles + background for abnormal prints
✅ Includes alerts — “Volume Spike”, “VWAP Cross”, or a combined alert with direction
✅ Clean visual design — instantly readable in fast markets
It’s your visual orderflow radar — whether you’re trading gold, indices, or small caps.
🔍 Why It Works
Institutions build and unwind positions around VWAP.
Retail often chases volume… this script shows you when that volume becomes too extreme.
A spike above VWAP near resistance? → Likely distribution.
A spike below VWAP near support? → Likely capitulation.
Combine volume exhaustion + VWAP context, and you’ll see market turning points form before most indicators react.
⚙️ Inputs You Can Tune
Bands lookback: adjusts how reactive the VWAP bands are
Band width (σ): set how tight or wide your deviation envelope is
Volume baseline length: controls how “abnormal” a spike must be
Spike threshold: multiplier vs. average volume
Toggle color-coding, bands, and labels
Default settings work well across 1m–15m intraday charts and 1h–4h swing frames.
💡 How Traders Use It
1️⃣ Fade Parabolics:
When a green spike candle pierces upper VWAP band on high volume → smart money unloading.
Look for rejection and short into VWAP.
2️⃣ Catch Capitulations:
When a red spike candle dumps below lower VWAP band → panic selling.
Watch for stabilization and long back to VWAP.
3️⃣ VWAP Rotation Plays:
Alerts for price crossing VWAP help you spot shift in intraday control.
Above VWAP = buyers in charge.
Below VWAP = sellers in charge.
🧠 Best Practices
Pair it with Volume Profile or Delta/Flow tools to confirm exhaustion.
Don’t chase — wait for spike confirmation + reversal candle.
Use it on liquid tickers (NASDAQ, SPY, GOLD, BTC, etc.).
Great for Dux-style small-cap shorts or index pullbacks.
🔔 Alerts Ready
Choose from:
Volume Spike (single-bar explosion)
VWAP Cross Up/Down (trend shift confirmation)
One Combined Alert (any signal, includes ticker, price, and volume)
Set once — get real-time push notifications, Telegram, or webhook signals.
📊 My Favorite Setups
US100 / NASDAQ: fade rallies above VWAP + spike
Gold / Silver: trade reversals from VWAP bands
Small caps: short back-side after volume climax
ES, DAX, Oil: scalp VWAP rotation with confluence
❤️ Support This Work
I release free and premium scripts weekly — combining smart money concepts, VWAP tools, and volume analytics.
👉 Follow me on TradingView for more indicators and setups.
👉 Comment “🔥” if you want me to post the multi-timeframe VWAP + Volume Pressure version next.
👉 Share this with your team — it helps the community grow.

VWAP Deviation Oscillator [BackQuant]VWAP Deviation Oscillator
Introduction
The VWAP Deviation Oscillator turns VWAP context into a clean, tradeable oscillator that works across assets and sessions. It adapts to your workflow with four VWAP regimes plus two rolling modes, and three deviation metrics: Percent, Absolute, and Z-Score. Colored zones, optional standard deviation rails, and flexible plot styles make it fast to read for both trend following and mean reversion.
What it does
This tool measures how far price is from a chosen VWAP and expresses that gap as an oscillator. You can view the deviation as raw price units, percent, or standardized Z-Score. The plot can be a histogram or a line with optional fills and sigma bands, so you can quickly spot polarity shifts, overbought and oversold conditions, and strength of extension.
VWAP modes track a session VWAP that resets (4H, Daily, Weekly) or a rolling VWAP that updates continuously over a fixed number of bars or days.
Deviation modes let you choose the lens: Percent, Absolute, or Z-Score. Each highlights different aspects of stretch and mean pressure.
Visual encoding uses a 10-zone color palette to grade the magnitude of deviation on both sides of zero.
Volatility guards compute mode-specific sigma so thresholds are stable even when volatility compresses.
Why this works
VWAP is a high signal anchor used by institutions to gauge fair participation. Deviations around VWAP cluster in regimes: mild oscillations within a band, decisive pushes that signal imbalance, and standardized extremes that often precede either continuation or snapback. Expressing that distance as a single time series adds clarity: bias is the oscillator’s sign, risk context is its magnitude, and regime is the way it behaves around sigma lines.
How to use it
Trend following
Favor the side of the zero line. Bullish when the oscillator is above zero and making higher swing highs. Bearish when below zero and making lower swing lows. Use +1 sigma and +2 sigma in your mode as strength tiers. Pullbacks that hold above zero in uptrends, or below zero in downtrends, are often continuation entries.
Mean reversion
Fade stretched readings when structure supports it. Look for tests of +2 sigma to +3 sigma that fail to progress and roll back toward zero, or the mirror on the downside. Z-Score mode is best when you want standardized gates across assets. Percent mode is intuitive for intraday scalps where a given percent stretch tends to mean revert.
Session playbook
Use Daily or Weekly VWAP for intraday or swing context. Rolling modes help when the asset lacks clean session boundaries or when you want a continuous anchor that adapts to liquidity shifts.
Key settings
VWAP computation
VWAP Mode = 4 Hours, Daily, Weekly, Rolling (Bars), Rolling (Days). Session modes reset the VWAP when a new session begins. Rolling modes compute VWAP over a fixed trailing window.
Rolling (Lookback: Bars) controls the trailing bar count when using Rolling (Bars).
Rolling (Lookback: Days) converts days to bars at runtime and uses that trailing span.
Use Close instead of HLC3 switches the price reference. HLC3 is smoother. Close makes the anchor track settlement more tightly.
Deviation measurement
Deviation Mode
Percent : 100 * (Price / VWAP - 1). Good for uniform scaling across instruments.
Absolute : Price - VWAP. Good when price units themselves matter.
Z-Score : Standardizes the absolute residual by its own mean and standard deviation over Z/Std Window . Ideal for cross-asset comparability and regime studies.
Z/Std Window sets the mean and standard deviation window for Z-Score mode.
Volatility controls
Percent Mode Volatility Lookback estimates sigma for percent deviations.
Absolute Mode Volatility Lookback estimates sigma for absolute deviations.
Minimum Sigma Guard (pct pts) prevents the percent sigma from collapsing to near zero in extremely quiet markets.
Visualization
Plot Type = Histogram or Line. Histogram emphasizes impulse and polarity changes. Line emphasizes trend waves and divergences.
Positive Color / Negative Color define the palette for line mode. Histogram uses a 10-bucket gradient automatically.
Show Standard Deviations plots symmetric rails at ±1, ±2, ±3 sigma in the current mode’s units.
Fill Line Oscillator and Fill Opacity add a soft bias band around zero for line mode.
Line Width affects both the oscillator and the sigma rails.
Reading the zones
The oscillator’s color and height map deviation to nine graded buckets on each side of zero, with deeper greens above and deeper reds below. In Percent and Absolute modes, those buckets are scaled by their mode-specific sigma. In Z-Score mode the bucket edges are fixed at 0.5, 1.0, 2.0, and 2.8.
0 to +1 sigma weak positive bias, usually rotational.
+1 to +2 sigma constructive impulse. Pullbacks that hold above zero often continue.
+2 to +3 sigma strong expansion. Watch for either trend continuation or exhaustion tells.
Beyond +3 sigma statistical extreme. Requires structure to avoid fading too soon.
Mirror logic applies on the negative side.
Suggested workflows
Trend continuation checklist
Pick a session VWAP that matches your timeframe, for example Daily for intraday or Weekly for position trades.
Wait for the oscillator to hold the correct side of zero and for a sequence of higher swing lows in the oscillator (uptrend) or lower swing highs (downtrend).
Buy pullbacks that stabilize between zero and +1 sigma in an uptrend. Sell rallies that stabilize between zero and -1 sigma in a downtrend.
Use the next sigma band or a prior price swing as your target reference.
Mean reversion checklist
Switch to Z-Score mode for standardized thresholds.
Identify tests of ±2 sigma to ±3 sigma that fail to extend while price meets support or resistance.
Enter on a polarity change through the prior histogram bar or a small hook in line mode.
Fade back to zero or to the opposite inner band, then reassess.
Notes on the three modes
Percent is easy to reason about when you care about proportional stretch. It is well suited to intraday and multi-asset dashboards.
Absolute tracks cash distance from VWAP. This is useful when instruments have tight ticks and you plan risk in price units.
Z-Score standardizes the residual and is best for quant studies, cross-asset comparisons, and threshold research that must be scale invariant.
What the alerts can tell you
Polarity changes at zero can mark the start or end of a leg.
Crosses of ±1 sigma identify overbought or oversold in the current mode’s units.
Zone changes signal an upgrade or downgrade in deviation strength.
Troubleshooting and edge cases
If your instrument has long flat periods, keep Minimum Sigma Guard above zero in Percent mode so the rails do not vanish.
In Rolling modes, very short windows will respond quickly but can whip around. Session modes smooth this by resetting at well known boundaries.
If Z-Score looks erratic, increase Z/Std Window to stabilize the estimate of mean and sigma for the residual.
Final thoughts
VWAP is the anchor. The deviation oscillator is the narrative. By separating bias, magnitude, and regime into a simple stream you can execute faster and review cleaner. Pick the VWAP mode that matches your horizon, choose the deviation lens that matches your risk framework, and let the color graded zones guide your decisions.

Vwap by EVThis indicator provides a complete multi-VWAP framework designed for traders who rely on price acceptance, value areas, and mean reversion across different market horizons. It plots Session, Daily, and Weekly VWAPs simultaneously, allowing users to understand short-term, intraday, and higher-timeframe value in a single, uncluttered view.
The Session VWAP supports custom trading hours and timezones, making it adaptable to equities, indices, forex, and crypto markets. All VWAP calculations are volume-weighted and non-repainting, with optional standard deviation bands based on true volume dispersion rather than fixed offsets. This ensures that each VWAP reflects genuine market participation and volatility.
Daily and Weekly VWAPs act as higher-timeframe equilibrium references, helping traders identify premium and discount zones, dynamic support and resistance, and directional bias. Optional band visibility and independent styling allow the indicator to remain clean while still providing depth when needed.

Relative Average Extrapolation [ChartPrime]Relative Average Extrapolation (ChartPrime) is a new take on session averages, like the famous vwap . This indicator leverages patterns in the market by leveraging average-at-time to get a footprint of the average market conditions for the current time. This allows for a great estimate of market conditions throughout the day allowing for predictive forecasting. If we know what the market conditions are at a given time of day we can use this information to make assumptions about future market conditions. This is what allows us to estimate an entire session with fair accuracy. This indicator works on any intra-day time frame and will not work on time frames less than a minute, or time frames that are a day or greater in length. A unique aspect of this indicator is that it allows for analysis of pre and post market sessions independently from regular hours. This results in a cleaner and more usable vwap for each individual session. One drawback of this is that the indicator utilizes an average for the length of a session. Because of this, some after hour sessions will only have a partial estimation. The average and deviation bands will work past the point where it has been extrapolated to in this instance however. On low time frames due to the limited number of data points, the indicator can appear noisy.
Generally crypto doesn't have a consistent footprint making this indicator less suitable in crypto markets. Because of this we have implemented other weighting schemes to allow for more flexibility in the number of use cases for this indicator. Besides volume weighting we have also included time, volatility, and linear (none) weighting. Using any one of these weighting schemes will transform the vwap into a wma, volatility adjusted ma, or a simple moving average. All of the style are still session period and will become longer as the session progresses.
Relative Average Extrapolation (ChartPrime) works by storing data for each time step throughout the day by utilizing a custom indexing system. It takes the a key , ie hour/minute, and transforms it into an array index to stor the current data point in its unique array. From there we can take the current time of day and advance it by one step to retrieve the data point for the next bar index. This allows us to utilize the footprint the extrapolate into the future. We use the relative rate of change for the average, the relative deviation, and relative price position to extrapolate from the current point to the end of the session. This process is fast and effective and possibly easier to use than the built in map feature.
If you have used vwap before you should be familiar with the general settings for this indicator. We have made a point to make it as intuitive for anyone who is already used to using the standard vwap. You can pick the source for the average and adjust/enable the deviation bands multipliers in the settings group. The average period is what determines the number of days to use for the average-at-time. When it is set to 0 it will use all available data. Under "Extrapolation" you will find the settings for the estimation. "Direction Sensitivity" adjusts how sensitive the indicator is to the direction of the vwap. A higher number will allow it to change directions faster, where a lower number will make it more stable throughout the session. Under the "Style" section you will find all of the color and style adjustments to customize the appearance of this indicator.
Relative Average Extrapolation (ChartPrime) is an advanced and customizable session average indicator with the ability to estimate the direction and volatility of intra-day sessions. We hope you will find this script fascinating and useful in your trading and decision making. With its unique take on session weighting and forecasting, we believe it will be a secret weapon for traders for years to come.
Enjoy

VWAP, MFI, RSI with S/R StrategyBest for 0dte/intraday trading on AMEX:SPY with 1 minute chart
Strategy Concept
This strategy aims to identify potential reversal points in a price trend by combining momentum indicators (RSI and MFI), volume-weighted price (VWAP), and recent price action trends. It looks for conditions where the price is poised to change direction, either bouncing off a support level in a potential uptrend or falling from a resistance level in a potential downtrend.
By incorporating both price level analysis (support/resistance) and momentum indicators, the strategy seeks to increase the likelihood of identifying significant trend reversals, taking into consideration both recent price movements and the current price's position relative to historical highs and lows.
VWAP (Volume-Weighted Average Price)
VWAP acts as a benchmark to determine the general market trend. It's an average price weighted by volume.
A price above VWAP is often considered bullish, and a price below VWAP is seen as bearish.
MFI (Money Flow Index) and RSI (Relative Strength Index) Parameters
MFI is a volume-weighted RSI, used to identify overbought (above 70) or oversold (below 30) conditions.
RSI is a momentum indicator that measures the magnitude of recent price changes to identify overbought or oversold conditions, similar to MFI.
The script uses standard overbought (70) and oversold (30) thresholds for both MFI and RSI.
Trend Check Function
The function trendCheck analyzes the past pastBars candles to count how many were bullish (closing price higher than the opening price) and bearish.
This function is used to assess the recent trend direction.
Support and Resistance Detection
The script calculates the highest high (highestHigh) and lowest low (lowestLow) over the last lookbackSR (50) periods to identify potential support and resistance levels.
isNearSupport and isNearResistance are conditions to check if the current price is within 0.08% of these identified levels, indicating proximity to support or resistance.
Buy and Sell Logic
Buy Signal:
The RSI crosses over the oversold threshold (30).
The MFI is also below its oversold level (30).
The current price is above the VWAP.
The recent trend (past 20 bars) has been predominantly bearish.
The price is near the identified support level.
Sell Signal:
The RSI crosses under the overbought threshold (70).
The MFI is above its overbought level (70).
The current price is below the VWAP.
The recent trend has been predominantly bullish.
The price is near the identified resistance level.
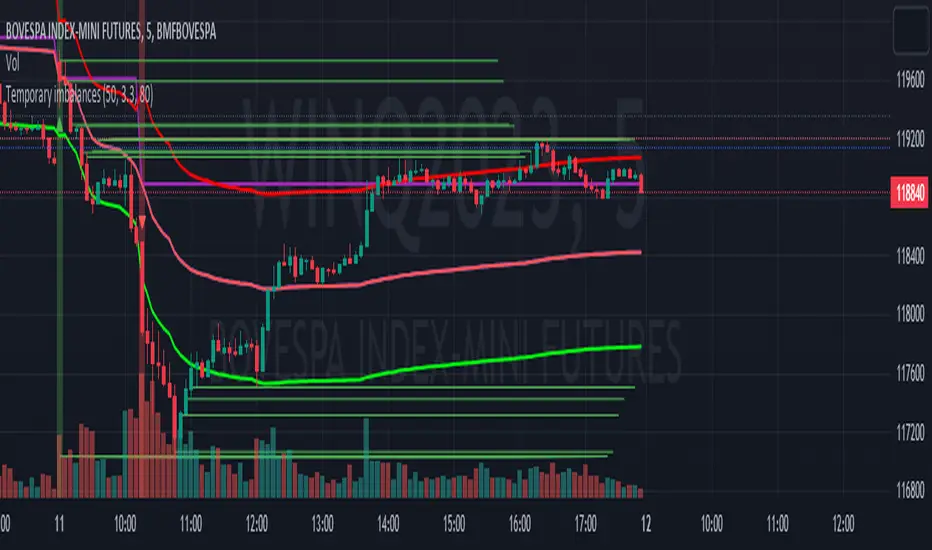
Temporary imbalancesThis indicator is designed to identify imbalances in order flow and market liquidity, It highlights candles with significant imbalances and draws reference lines
The indicator calculates imbalance based on changes in closing prices and volume. It uses the standard deviation to determine the significant imbalance threshold. Candles with bullish imbalances are highlighted in green, while candles with bearish imbalances are highlighted in red.
Furthermore, the indicator includes features of latency arbitrage and liquidity analysis. Latency arbitrage looks for price differences between the anchored VWAP and bid/ask quotes, targeting trading opportunities based on these differences. The liquidity analysis verifies the liquidity imbalance and calculates the VWAP anchored on this value in total using 4 VWAP.
This indicator can be adjusted according to the preferences and characteristics of the specific asset or market. It provides clear visual information and can be used as a complementary tool for technical analysis in trading strategies.
Interesting Segment Length 20,50,80,200
and Interesting lookback period 20,50,80,200
Interesting imbalance threshold 1.5, 2.4, 3.3 ,4.2
Este indicador é projetado para identificar desequilíbrios no fluxo de ordens e na liquidez do mercado, Ele destaca velas com desequilíbrios significativos e traça linhas de referência
O indicador calcula o desequilíbrio com base nas mudanças nos preços de fechamento e no volume. Ele usa o desvio padrão para determinar o limiar de desequilíbrio significativo. As velas com desequilíbrios de alta são destacadas em verde, enquanto as velas com desequilíbrios de baixa são destacadas em vermelho.
Além disso, o indicador inclui recursos de arbitragem de latência e análise de liquidez. A arbitragem de latência procura diferenças de preços entre a VWAP ancorada e as cotações de compra/venda, visando oportunidades de negociação com base nessas diferenças. A análise de liquidez verifica o desequilíbrio de liquidez e calcula a VWAP ancorada nesse valor ao total utiliza 4 VWAP.
Este indicador pode ser ajustado de acordo com as preferências e características do ativo ou mercado específico. Ele fornece informações visuais claras e pode ser usado como uma ferramenta complementar para análise técnica em estratégias de negociação.
Comprimento do Segmento interessante para usa 20,50,80,200
e Período de lookback interessante para usa 20,50,80,200
Limiar de desequilíbrio interessante para usa 1.5 ,2.4, 3.3 ,4.2
VWAP Flow ParmezanThe "Official Bank Flow VWAP" is a comprehensive trading suite designed for institutional Forex traders.
This indicator solves the problem of chart clutter by combining two critical components of liquidity: Price (Value) and Time (Sessions). It is specifically optimized for EUR/USD and GBP/USD on intraday timeframes (M5, M15), helping you identify high-probability setups where "Fair Value" meets "Volatility."
Key Features
1. Multi-Timeframe VWAP Hierarchy Unlike standard indicators, this tool visualizes the interaction between three distinct timeframes:
Daily VWAP (Dynamic Color): Your primary trend filter. Green when Bullish (Price > VWAP), Red when Bearish (Price < VWAP).
Weekly VWAP (Orange Dots): Represents the medium-term balance. Acts as a magnet for mean reversion mid-week.
Monthly VWAP (Purple Line): The institutional "line in the sand." Major support/resistance level.
2. Standard Deviation Bands (Market Balance) The indicator plots SD1 and SD2 bands around the Daily VWAP:
Inner Zone (SD1): Represents the "Fair Value" area.
Outer Bands (SD2): Represents overbought/oversold conditions. Useful for identifying mean reversion plays back to the center.
3. Official Exchange Sessions (Time) Forget confusing "killzones." This tool highlights the Official Open times for major exchanges, adjusted for Daylight Savings via New York time:
London Open (08:00 LDN): The start of European volume.
New York Open (08:00 NY): The injection of US liquidity.
London Close/Fix: The daily overlap close, often marking trend reversals.
Note: Sessions are visualized with non-intrusive black "shadow" backgrounds to keep your chart clean.
4. "Ghost" Levels (Previous VWAP) A unique feature that plots the closing VWAP level of the previous day. Institutional algorithms often target these "untested" levels as Take Profit targets or liquidity pools.
How to Use
Trend Following: If Price is above the Daily VWAP (Green) during the London Open, look for Long entries targeting the SD1/SD2 upper bands.
Mean Reversion: If Price hits the SD2 Band while far away from the Weekly VWAP, look for a reversal back to the mean.
Confluence: The strongest signals occur when price touches a key VWAP level (e.g., Weekly VWAP) specifically during the highlighted Session Start times.
Settings
Timezone: Defaults to America/New_York to automatically handle DST shifts for London/NY opens.
Visuals: Fully customizable colors and transparency. Default is set to a "Dark Mode" friendly professional palette.

Vwap MTFExplanatory Note: VWAP Multi-Timeframe Script (Dedicated to Intraday Trading)
Description:
This Pine script has been specifically designed for intraday traders to display the VWAP (Volume Weighted Average Price) from four different timeframes (15 minutes, 1 hour, 4 hours, and daily) on a single TradingView chart. The VWAP is calculated by considering the volume-weighted average price over a specified period, providing a perspective on the market's average value. This script streamlines your analysis by avoiding the need to navigate through multiple timeframes to identify the trend.
Usage Instructions:
Apply the script to your TradingView chart.
The script will showcase the average VWAP for 15 minutes, 1 hour, 4 hours, and daily on the current chart.
The color of the VWAP indicates the direction: blue if the VWAP is higher than the previous period, red otherwise.
Parameters:
VWAP Period Length (length): The length of the period used for VWAP calculation. By default, the length is set to 30 bars.
Explanation of VWAP: "This VWAP will be more precise for your analysis and closer to price/volume."
VWAP is a crucial indicator for intraday traders, taking into account transaction volume. It provides a volume-weighted average price over a specified period, assisting traders in evaluating the average value at which an asset has been traded throughout the day. "It can be wise for the self-directed investor to use VWAP in combination with moving averages or other technical indicators to confirm buy and sell signals."
You have the option to change the colors.

VWAP D/W/M + MA100 & EMA100 albanThis TradingView indicator displays three independent VWAPs (Volume Weighted Average Prices) along with MA100 (Simple Moving Average) and EMA100 (Exponential Moving Average) on the chart.
Key Features:
VWAP #1, VWAP #2, VWAP #3: Each VWAP can be configured independently with:
Source (hlc3, close, etc.)
Anchor period (Session, Week, Month, Quarter, Year, Decade, Century, Earnings, Dividends, Splits)
Offset
Option to hide on daily or higher timeframes
MA100: 100-period Simple Moving Average
EMA100: 100-period Exponential Moving Average
Purpose:
This script is ideal for traders who want to track multiple VWAP levels simultaneously while also monitoring the 100-period moving averages for trend analysis. It provides a clean setup without bands or fills, focusing solely on price averages.
Use Cases:
Identify intraday or multi-timeframe VWAP levels
Combine VWAP levels with MA100/EMA100 for support/resistance analysis
Analyze trend direction and momentum using moving averages
