Elliott Wave 3 FinderThis script will attempt to find the location of the third wave in the Elliot Wave Theory. The bars will become highlighted when possible wave 3 criteria is met. Multiple bars in a row may have a painted background. The point at which the bars are no longer painted will potentially be at or near the end of wave 3.
The background paints a baby blue for wave 3s in an overall uptrend, and pink for downtrends.
Cari dalam skrip untuk "wave"

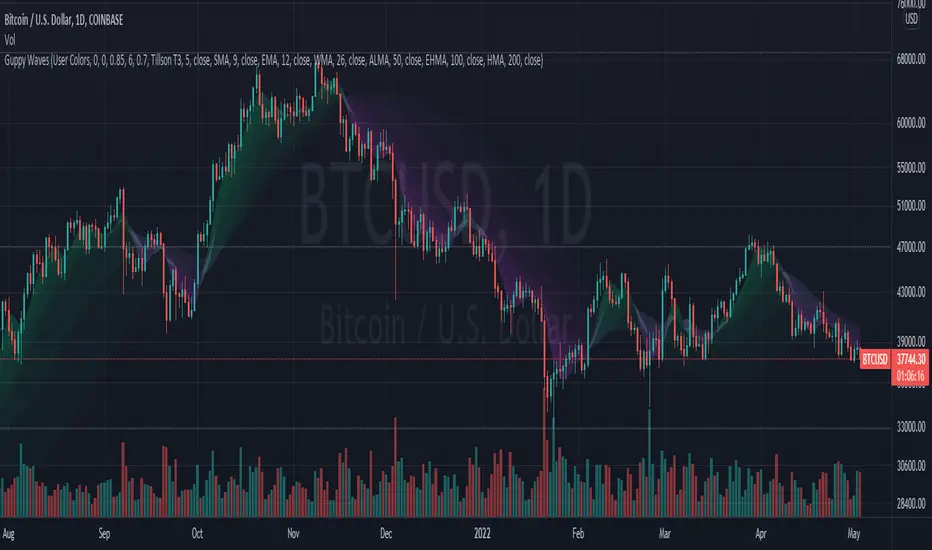
Guppy WavesA lightweight version of the popular "Moving Average Ribbon" or "Guppy" indicators where the visuals are plotted as "waves" rather than moving average lines. As is customary for my indicators, nearly everything about it is user selectable.
Visual Features:
User Customizable Colors
RSI-Based Rainbow Color Scheme
Simple Offset for adjusting transparency
Create great-looking charts very easily
Moving Average Options:
Running (SMoothed) Moving Average (RMA or SMMA ) - very slow/smooth
Simple Moving Average ( SMA )
Exponential Moving Average ( EMA )
Weighted Moving Average ( WMA )
Volume-Weighted Moving Average ( VWMA )
Triple EMA ( TEMA ) - very fast
Exponential Hull Moving Average (EHMA) - Hull with Smoothing (Slower than Hull)
Least Squares Moving Average ( LSMA ) - Simple Linear Regression
Arnaud Legoux Moving Average ( ALMA ) - Adjustable, set offset=1 to be current, offset=0.85 for good smoothing
Hull Moving Average ( HMA ) - very fast
Tillson T3 - very smooth
Donchian Moving Average - plots the average of (lowest, highest) for a given period length
The user can change the source, period, and type of moving average used for every single line on the chart.
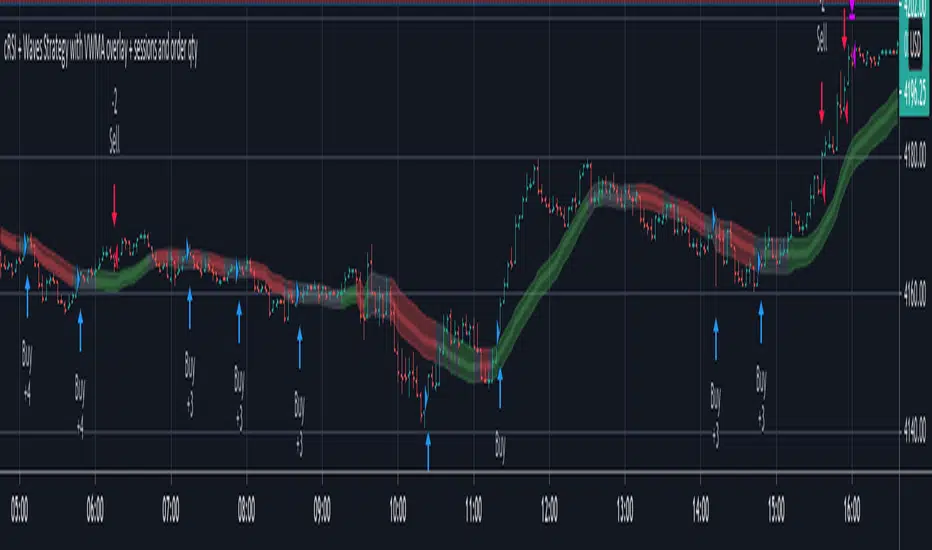
cRSI + Waves Strategy with VWMA overlay + sessions and order qtyThis is a fork of the cRSI + Waves Strategy with VWMA overlay strategy by Dr_Roboto , which adds two additional features, namely:
the ability to limit trade signals to certain defined periods of time ("Sessions") during the trading day and, optionally, to close any open position at the end of either or both "Sessions"
the ability to control the maximum order size suggested by the strategy on the "Inputs" tab of the strategy's "Settings" window
If you are trading on a daily chart (or longer) you must disable the Limit Signals to Trading Sessions? option in order for the strategy to produce signals.
All other features are identical to the original strategy (revision 2.0).
R100 Wave v2 (*v*)This is a Wave (or Zig Zag) indicator I made to use in conjunction with the Wave Volume indicator I use.
It uses the Jurik moving average to determine turning points, and will plot the tops and bottoms of the wave based on the most recent high- so you can also use to quickly find pivot highs and lows. If you are using with the R100 Wave Volume indicator, first adjust the wave to fit better (if required) using the Jurik length and/or power, and then use the same settings on the Wave Volume indicator. Default settings work pretty well for most stocks, but adjusting the length between 8 and 14 should be enough for a good fit, or adjust the power between 1 and 3, or get fussy and tweak it with both.
The Jurik MA has been modified to include a VWAP component, so will only work where you have volume. The last "leg" of the wave will move about until the next pivot high or low is found and then will remain fixed.
I hope you find some value with it. Only conditions of use are that if you improve it, let me know and if you publish something that uses it, don't hide the code! Enjoy!
Code pinched and modified from Zero Lag ZigZag by Duyck - thankyou
Jurik Moving Average (for turning points) by Everget - thankyou
and Weis Wave by Modhelius - thankyou

test - wave collapseexperimental:
translates a gaussian wave to collapse from high/low peaks, slice of a pun intended to the cat in the box :)

Wave Period Oscillator Wave Period Oscillator developed by Akram El Sherbini
Published in article Time Cycle Oscillators in IFTA Journal 2018 (page 66 - 77)
read his article : ifta.org
Entry Long - WPO cross above centerline (Zero Line)
Exit Long - WPO cross below overbought level or cross below centerline(Zero Line)
Entry Short - WPO cross below centerline (Zero Line)
Exit Short - WPO cross above oversold level or cross above centerline(Zero Line)


Weis Wave ChartThis indicator is based on the Weis Wave described by David H. Weis in his book Trades About to Happen: A Modern Adaptation of the Wyckoff Method, more info how to use this indicator can be found in this video . The Weis Wave is an adaptation of Richard D. Wyckoff’s method Wave Charts. It works in all time periods and can be applied to all asset types.
Unlike other implementations I found here on TradingView, this implementation make use of a Renko-like zig zag pattern, very similar to how it is described in David H. Weis' book. The settings for the zig zag pattern are very similar to the standard Renko settings here on TradingView, in the "Renko Assignment Method" you either chose "ATR" or "Traditional" (read more about it here ). The ATR length or the brick size is then entered in the textbox "Value". You can also chose another setting in the "Renko Assignment Method" drop down named "Part of Price" which calculate the brick size from the current close and divide it by the value in the text box "Value". It is also possible to chose if the zig zag pattern shall use the high/low, the open/close or just the close as the most extreme values in its calculation, you select this in the drop down "Price Source".
TradingView's pine script does currently not support to print non-static text on the chart, so it is not possible at this point to write out the volume on the zig zag chart. It is also not possible to have both an overlay and separate chart pane in the same indicator, therefor this indicator is split up in two.
You can find the volume indicator here:

Weis Wave VolumeThis indicator is based on the Weis Wave described by David H. Weis in his book Trades About to Happen: A Modern Adaptation of the Wyckoff Method, more info how to use this indicator can also be found in this video . The Weis Wave is an adaptation of Richard D. Wyckoff’s method Wave Charts. It works in all time periods and can be applied to all asset types. For assets that do not support volume Weis propose in his book to use the true range instead, so if you want to use this indicator for assets that do not support volume, make sure to enable the checkbox "Use True Range instead of Volume".
Unlike other implementations I found here on Trading, this implementation make use of a Renko-like zig zag pattern, very similar to how it is described in David H. Weis' book. The settings for the zig zag pattern are very similar to the standard Renko settings here on TradingView, in the "Renko Assignment Method" you either chose "ATR" or "Traditional" (read more about it here ). The ATR length or the brick size is then entered in the textbox "Value". You can also chose another setting in the "Renko Assignment Method" drop down named "Part of Price" which calculate the brick size from the current close and divide it by the value in the text box "Value". It is also possible to chose if the zig zag pattern shall use the high/low, the open/close or just the close as the most extreme values in its calculation, you select this in the drop down "Price Source". If you want the price to oscillate around a zero value, enable the "Oscillating" checkbox.
TradingView's pine script does currently not support to print non-static text on the chart, so it is not possible at this point to write out the volume on the zig zag chart. It is also not possible to have both an overlay and separate chart pane in the same indicator, therefor this indicator is split up in two.
You can find the zig zag indicator here:

waves█ OVERVIEW
This library intended for use in Bar Replay provides functions to generate various wave forms (sine, cosine, triangle, square) based on time and customizable parameters. Useful for testing and in creating oscillators, indicators, or visual effects.
█ FUNCTIONS
• getSineWave()
• getCosineWave()
• getTriangleWave()
• getSquareWave()
█ USAGE EXAMPLE
//@version=6
indicator("Wave Example")
import kaigouthro/waves/1
plot(waves.getSineWave(cyclesPerMinute=15))
█ NOTES
* barsPerSecond defaults to 10. Adjust this if not using 10x in Bar Replay.
* Phase shift is in degrees.
---
Library "waves"
getSineWave(cyclesPerMinute, bar, barsPerSecond, amplitude, verticalShift, phaseShift)
`getSineWave`
> Calculates a sine wave based on bar index, cycles per minute (BPM), and wave parameters.
Parameters:
cyclesPerMinute (float) : (float) The desired number of cycles per minute (BPM). Default is 30.0.
bar (int) : (int) The current bar index. Default is bar_index.
barsPerSecond (float) : (float) The number of bars per second. Default is 10.0 for Bar Replay
amplitude (float) : (float) The amplitude of the sine wave. Default is 1.0.
verticalShift (float) : (float) The vertical shift of the sine wave. Default is 0.0.
phaseShift (float) : (float) The phase shift of the sine wave in radians. Default is 0.0.
Returns: (float) The calculated sine wave value.
getCosineWave(cyclesPerMinute, bar, barsPerSecond, amplitude, verticalShift, phaseShift)
`getCosineWave`
> Calculates a cosine wave based on bar index, cycles per minute (BPM), and wave parameters.
Parameters:
cyclesPerMinute (float) : (float) The desired number of cycles per minute (BPM). Default is 30.0.
bar (int) : (int) The current bar index. Default is bar_index.
barsPerSecond (float) : (float) The number of bars per second. Default is 10.0 for Bar Replay
amplitude (float) : (float) The amplitude of the cosine wave. Default is 1.0.
verticalShift (float) : (float) The vertical shift of the cosine wave. Default is 0.0.
phaseShift (float) : (float) The phase shift of the cosine wave in radians. Default is 0.0.
Returns: (float) The calculated cosine wave value.
getTriangleWave(cyclesPerMinute, bar, barsPerSecond, amplitude, verticalShift, phaseShift)
`getTriangleWave`
> Calculates a triangle wave based on bar index, cycles per minute (BPM), and wave parameters.
Parameters:
cyclesPerMinute (float) : (float) The desired number of cycles per minute (BPM). Default is 30.0.
bar (int) : (int) The current bar index. Default is bar_index.
barsPerSecond (float) : (float) The number of bars per second. Default is 10.0 for Bar Replay
amplitude (float) : (float) The amplitude of the triangle wave. Default is 1.0.
verticalShift (float) : (float) The vertical shift of the triangle wave. Default is 0.0.
phaseShift (float) : (float) The phase shift of the triangle wave in radians. Default is 0.0.
Returns: (float) The calculated triangle wave value.
getSquareWave(cyclesPerMinute, bar, barsPerSecond, amplitude, verticalShift, dutyCycle, phaseShift)
`getSquareWave`
> Calculates a square wave based on bar index, cycles per minute (BPM), and wave parameters.
Parameters:
cyclesPerMinute (float) : (float) The desired number of cycles per minute (BPM). Default is 30.0.
bar (int) : (int) The current bar index. Default is bar_index.
barsPerSecond (float) : (float) The number of bars per second. Default is 10.0 for Bar Replay
amplitude (float) : (float) The amplitude of the square wave. Default is 1.0.
verticalShift (float) : (float) The vertical shift of the square wave. Default is 0.0.
dutyCycle (float) : (float) The duty cycle of the square wave (0.0 to 1.0). Default is 0.5 (50% duty cycle).
phaseShift (float) : (float) The phase shift of the square wave in radians. Default is 0.0.
Returns: (float) The calculated square wave value.

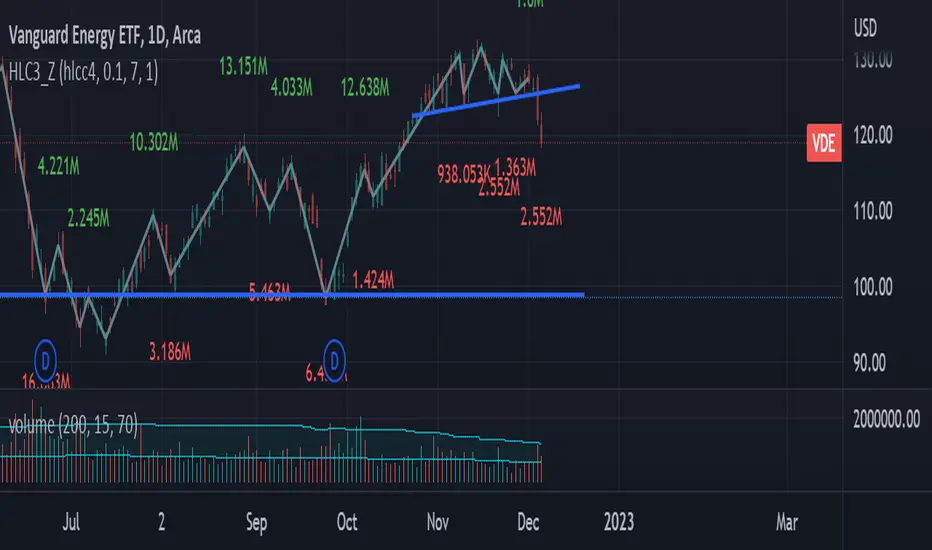
HLC3_ZThis indicator uses a single price point for each session (HLC3 by default) to draw waves.
This helps to filter out small or high frequency fluctuation in the price, and focus on the trend.
There are also options to display cumulative volume for each wave, or to overlay the price source to draw the wave on the chart.
I find using this indicator helps with finding the wave structures or the head or bottom structures such as head-and-shoulder.
HTF Anchor DotsHigh Time Frame Anchor Dots is designed for traders who use the 15m or 1H chart and want a clear visual of higher-timeframe momentum conditions without constantly switching timeframes. The script builds on the Wave Anchor Indicator concept and is intended to complement the TP Mint Trading Strategy.
Using the momentum waves (similar to VuManChu Cipher B / Market Cipher B), the script identifies “anchor” states on higher timeframes (1H, 4H, Daily) and plots colored dots on your current chart:
• Yellow Dots: TP1 timeframe is anchored (overbought/oversold)
• Red Dots: TP2 timeframe is anchored (overbought/oversold)
• Orange Dots: Both TP1 and TP2 timeframes are simultaneously anchored, indicating a significant confluence.
Dots above the price indicate overbought anchors; dots below indicate oversold anchors. Because the indicator checks these conditions at the close of your entry timeframe candles, you may occasionally see a dot even though the higher-timeframe candle later closes out of anchor. Remember, this indicator offers no direct entry signals; it merely highlights potential confluence or caution zones.
Why Use It?
- Quickly assess if momentum on higher timeframes is stretched in one direction.
- Avoid entering a new position when a higher timeframe has just hit a potential turning point.
- Spot patterns in anchor dot clusters that can refine your trading entries or exits.
If you have questions or suggestions, feel free to share them! The script is open to improvements, and I appreciate all feedback. As with any indicator, this tool is not guaranteed to be an accurate prediction of future price action. Most successful traders combine indicators with sound risk management practices and their own personal analysis.

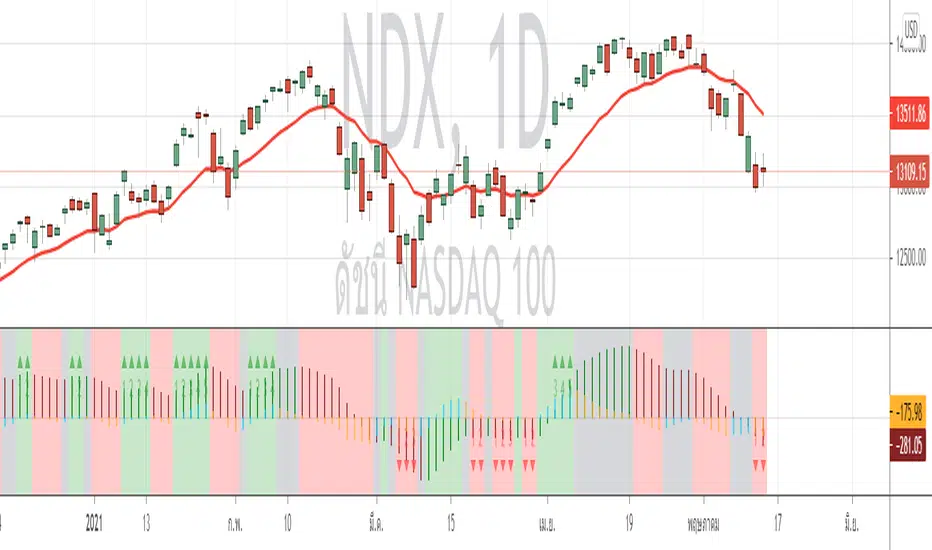
AO-ZoneThe Zone is mention in New Trading Dimensions by Bill Williams,PhD.
The Zone is used for Entry Signal
Green Zone are painting Green when Awesome Oscillator (AO) and Accelerater/Decelerator (AC) are both increasing.
Red Zone are painting Red when Awesome Oscillator (AO) and Accelerater/Decelerator (AC) are both decreasing.
Gray Zone are painting Gray when AO and AC in difference changing
Gray Zone are indicate the indecision between bulls and bears.
Bill Williams, PhD. mention that Green Zone or Red Zone usually happen 6-8 bars Continuously.
(in my opinion, it happen lower than in intraday time frame)
The First Bar that change to be Green or Red color is the Signal Bar.
Entry Signal is the second bar in the same color as the Signal bar happen with Volume
Price go higher the high of previous Green Bar is Buy Signal. Entry Buy (Long) and place Stop at 1 tick lower the Low of previous bar.
Price go lower the Low of previous Red Bars is Sell Signal. Entry Sell (Short) and place Stop at 1 tick higher the High of previous bar.
Can Entry from 2nd bar to 5th bar.
Do not Entry if Green Bars or Red Bars completed 5 bars continuously.
This indicator have AO , AC and Zone in 1 tools and there are counter to show the number of Green bar or Red bar.
Green counter will happen when AO >0 and Green zone because AO > 0 show uptrend condition.
Red Counter will happen when AO < 0 and Red Zone because AO <0 show downtrend condition.
When we entry , we should follow the trend. So I design to non-show the counter if zone is against the trend.
#WaveRiders
The Zone Trades v1.0The Zone is mention in New Trading Dimensions by Bill Williams,PhD.
The Zone is used for Entry Signal
Green Zone are painting Green Bars when Awesome Oscillator (AO) and Accelerater/Decelerator (AC) are both increasing.
Red Zone are painting Red Bars when Awesome Oscillator (AO) and Accelerater/Decelerator (AC) are both decreasing.
Gray Zone are painting Gray Bars AO and AC in difference changing
Gray Zone are indicate the indecision between bulls and bears.
Bill Williams, PhD. mention that Green Zone or Red Zone usually happen 6-8 bars Continuously.
The First Bar that change to be Green or Red color is the Signal Bar.
Entry Signal is the second bar in the same color as the Signal bar happen with Volume
Price go higher the high of previous Green Bar is Buy Signal. Entry Buy (Long) and place Stop at 1 tick lower the Low of previous bar.
Price go ;ower the Low of previous Red Bars is Sell Signal. Entry Sell (Short) and place Stop at 1 tick higher the High of previous bar.
Do not Entry if Green Bars or Red Bars completed 5 bars continuously.

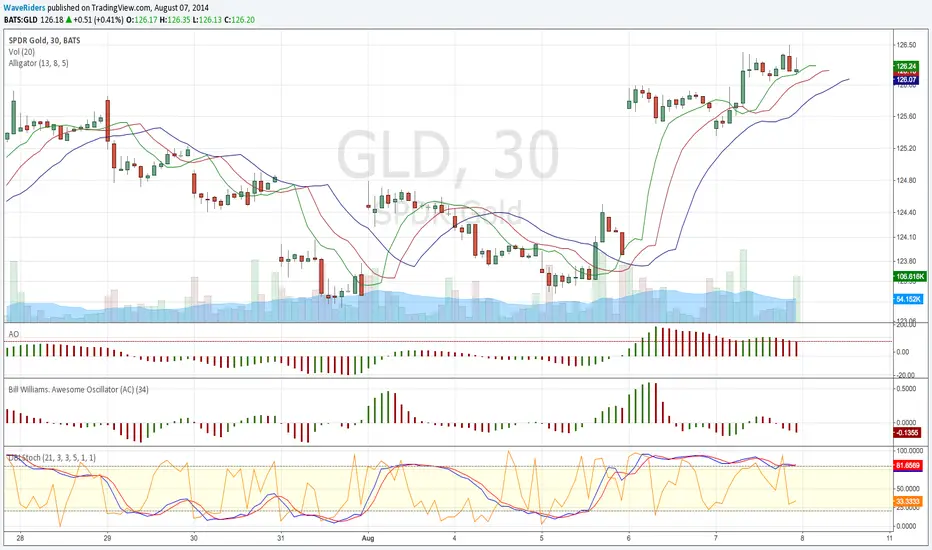
Double StochasticDouble Stochastic is use Slow Stochastic (21,3,3) and Fast Stochastic (5,1,1) to monitor price movement.
Slow Stochastic use for monitor cycle of price.
Fast Stochastic use for monitor price swing and divergence.
Both Stochastic turn together mean price will reverse for real.
Fast Stochastic turn away from Slow Stochastic mean price only minor swing.
.....
Designed by Wave Riders

Continuation Gauge - ES 3m (v1.1)Continuation Gauge - ES 3m (v1.1)
wave trend analysis between bull and bear imbalance trends

Wavelet Candle Constructor (Inc. Morlet) 2Here is the detailed description of the **Wavelet Candle** construction principles based on the code provided.
This indicator is not a simple smoothing mechanism (like a Moving Average). It utilizes the **Discrete Wavelet Transform (DWT)**, specifically the Stationary variant (SWT / à Trous Algorithm), to separate "noise" (high frequencies) from the "trend" (low frequencies).
Here is how it works step-by-step:
###1. The Wavelet Kernel (Coefficients)The heart of the algorithm lies in the coefficients (the `h` array in the `get_coeffs` function). Each wavelet type represents a different set of mathematical weights that define how price data is analyzed:
* **Haar:** The simplest wavelet. It acts like a simple average of neighboring candles. It reacts quickly but produces a "boxy" or "jagged" output.
* **Daubechies 4:** An asymmetric wavelet. It is better at detecting sudden trend changes and the fractal structure of the market, though it introduces a slight phase shift.
* **Symlet / Coiflet:** More symmetric than Daubechies. They attempt to minimize lag (phase shift) while maintaining smoothness.
* **Morlet (Gaussian):** Implemented in this code as a Gaussian approximation (bell curve). It provides the smoothest, most "organic" effect, ideal for filtering noise without jagged edges.
###2. The Convolution EngineInstead of a simple average, the code performs a mathematical operation called **convolution**:
For every candle on the chart, the algorithm takes past prices, multiplies them by the Wavelet Kernel weights, and sums them up. This acts as a **digital low-pass filter**—it allows the main price movements to pass through while cutting out the noise.
###3. The "à Trous" Algorithm (Stationary Wavelet Transform)This is the key difference between this indicator and standard data compression.
In a classic wavelet transform, every second data point is usually discarded (downsampling). Here, the **Stationary** approach is used:
* **Level 1:** Convolution every **1** candle.
* **Level 2:** Convolution every **2** candles (skipping one in between).
* **Level 3:** Convolution every **4** candles.
* **Level 4:** Convolution every **8** candles.
Because of this, **we do not lose time resolution**. The Wavelet Candle is drawn exactly where the original candle is, but it represents the trend structure from a broader perspective. The higher the `Decomposition Level`, the deeper the denoising (looking at a wider context).
###4. Independent OHLC ProcessingThe algorithm processes each component of the candle separately:
1. Filters the **Open** series.
2. Filters the **High** series.
3. Filters the **Low** series.
4. Filters the **Close** series.
This results in four smoothed curves: `w_open`, `w_high`, `w_low`, `w_close`.
###5. Geometric Reconstruction (Logic Repair)Since each price series is filtered independently, the mathematics can sometimes lead to physically impossible situations (e.g., the smoothed `Low` being higher than the smoothed `High`).
The code includes a repair section:
```pinescript
real_high = math.max(w_high, w_low)
real_high := math.max(real_high, math.max(w_open, w_close))
// Same logic for Low (math.min)
```
This guarantees that the final Wavelet Candle always has a valid construction: wicks encapsulate the body, and the `High` is strictly the highest point.
---
###Summary of ApplicationThis construction makes the Wavelet Candle an **excellent trend-following tool**.
* If the candle is **green**, it means that after filtering the noise (according to the selected wavelet), the market energy is bullish.
* If it is **red**, the energy is bearish.
* The wicks show volatility that exists within the bounds of the selected decomposition level.
Here is a descriptive comparison of **Wavelet Candles** against other popular chart types. As requested, this is a narrative explanation focusing on the differences in mechanics, interpretation philosophy, and the specific pros and cons of each approach.
---
###1. Wavelet Candles vs. Standard (Japanese) CandlesThis is a clash between "the raw truth" and "mathematical interpretation." Standard Japanese candles display raw market data—exactly what happened on the exchange. Wavelet Candles are a synthetic image created by a signal processor.
**Differences and Philosophy:**
A standard candle is full of emotion and noise. Every single price tick impacts its shape. The Wavelet Candle treats this noise as interference that must be removed to reveal the true energy of the trend. Wavelets decompose the price, reject high frequencies (noise), and reconstruct the candle using only low frequencies (the trend).
* **Wavelet Advantages:** The main advantage is clarity. Where a standard chart shows a series of confusing candles (e.g., a long green one, followed by a short red one, then a doji), the Wavelet Candle often draws a smooth, uniform wave in a single color. This makes it psychologically easier to hold a position and ignore temporary pullbacks.
* **Wavelet Disadvantages:** The biggest drawback is the loss of price precision. The Open, Close, High, and Low values on a Wavelet candle are calculated, not real. You **cannot** place Stop Loss orders or enter trades based on these levels, as the actual market price might be in a completely different place than the smoothed candle suggests. They also introduce lag, which depends on the chosen wavelet—whereas a standard candle reacts instantly.
###2. Wavelet Candles vs. Heikin AshiThese are close cousins, but they share very different "DNA." Both methods aim to smooth the trend, but they achieve it differently.
**Differences and Philosophy:**
Heikin Ashi (HA) is based on a simple recursive arithmetic average. The current HA candle depends on the previous one, making it react linearly.
The Wavelet Candle uses **convolution**. This means the shape of the current candle depends on a "window" (group) of past candles multiplied by weights (Gaussian curve, Daubechies, etc.). This results in a more "organic" and elastic reaction.
* **Wavelet Advantages:** Wavelets are highly customizable. With Heikin Ashi, you are stuck with one algorithm. With Wavelet Candles, you can change the kernel to "Haar" for a fast (boxy) reaction or "Morlet" for an ultra-smooth, wave-like effect. Wavelets handle the separation of market cycles better than simple HA averaging, which can generate many false color flips during consolidation.
* **Wavelet Disadvantages:** They are computationally much more complex and harder to understand intuitively ("Why is this candle red if the price is going up?"). In strong, vertical breakouts (pumps), Heikin Ashi often "chases" the price faster, whereas deep wavelet decomposition (High Level) may show more inertia and change color more slowly.
###3. Wavelet Candles vs. RenkoThis compares two different dimensions: Time vs. Price.
**Differences and Philosophy:**
Renko completely ignores time. A new brick is formed only when the price moves by a specific amount. If the market stands still for 5 hours, nothing happens on a Renko chart.
The Wavelet Candle is **time-synchronous**. If the market stands still for 5 hours, the Wavelet algorithm will draw a series of flat, small candles (the "wavelet decays").
* **Wavelet Advantages:** They preserve the context of time, which is crucial for traders who consider trading sessions (London/New York) or macroeconomic data releases. On a wavelet chart, you can see when volatility drops (candles become small), whereas Renko hides periods of stagnation, which can be misleading for options traders or intraday strategies.
* **Wavelet Disadvantages:** In sideways trends (chop), Wavelet Candles—despite the smoothing—will still draw a "snake" that flips colors (unless you set a very high decomposition level). Renko can remain perfectly clean and static during the same period, not drawing any new bricks, which for many traders is the ultimate filter against overtrading in a flat market.
###Summary**Wavelet Candles** are a tool for the analyst who wants to visualize the **structure of the wave and market cycle**, accepting some lag in exchange for noise reduction, but without giving up the time axis (like in Renko) or relying on simple averaging (like in Heikin Ashi). It serves best as a "roadmap" for the trend rather than a "sniper scope" for precise entries.

SJ WaveTrendWaveTrend Indicator – Full English Brief for TradingView
Description:
The WaveTrend Oscillator (WT) is a momentum-based indicator originally developed by LazyBear, designed to identify overbought and oversold market conditions with high precision. It is conceptually similar to the RSI and Stochastic Oscillator but uses a wave-based mathematical approach to detect turning points in price action earlier and more smoothly.
⸻
🔍 How It Works
WaveTrend analyzes the difference between price and its moving average (typically the exponential moving average of the Typical Price).
It then applies multiple layers of smoothing to filter out noise and produce two oscillating lines — WT1 (fast) and WT2 (slow).
The crossing points between WT1 and WT2 are used to identify momentum shifts:
• When WT1 crosses above WT2 from below the oversold zone → Bullish signal
• When WT1 crosses below WT2 from above the overbought zone → Bearish signal
⸻
⚙️ Core Formula Concept
The WaveTrend calculation typically follows this process:
1. Compute the Typical Price (TP) = (High + Low + Close) / 3
2. Calculate the Exponential Moving Average (EMA) of TP over a short length
3. Determine the Raw Wave (ESA) and De-trended Price Oscillator (DPO)
4. Apply double smoothing to produce the final WT1 and WT2 values
These smoothed waves behave like energy waves that expand and contract based on market volatility — hence the name WaveTrend.
⸻
📈 Interpretation
• Overbought Zone: WT values above +60 to +70
• Oversold Zone: WT values below -60 to -70
• Crossovers: WT1 crossing WT2 signals a potential trend reversal
• Divergence: When price makes a new high/low but WT does not, it signals momentum weakening
⸻
🧠 Trading Insights
• Best used on higher timeframes (H1 and above) for trend confirmation, and on lower timeframes (M15–M30) for precise entries.
• Combine with ADX, EMA Cloud, or Volume Filters to confirm real momentum shifts and avoid false signals.
• You can highlight WT Diff (WT1 - WT2) to visualize momentum expansion and contraction; large positive or negative differences often precede strong reversals.

WaveTrend Dynamic (Lazy Bear Style)█ OVERVIEW
The WaveTrend Dynamic indicator (in the style of Lazy Bear) is an advanced tool based on the Exponential Smoothing Average (ESA), which adapts to the volatility and price of a financial instrument. It is more flexible than the classic WaveTrend but shares a similar concept of bands around a main oscillator line.
The indicator uses dynamic bands calculated as distances from the ESA, with their width adjustable via the "level" parameter. This allows it to be tailored to various markets, timeframes, and volatility conditions, making it easier to identify trends, reversal points, and buy/sell signals.
█ CONCEPTS
The WaveTrend Dynamic combines oscillator functions with trend analysis. Below, we explain the key components in a simple way, understandable even for beginner users.
Core Calculations
The indicator relies on the adaptive ESA and a few straightforward steps:
1 — ESA (Adaptive Average): Calculated as a smoothed average of the price (from high, low, and close, or HLC3) using the ESA Length parameter (default: 10). This number determines how many past candles are considered in the calculation. The ESA quickly responds to price changes, helping to track trends.
2 — Deviation (D): Measures how much the price deviates from the ESA, factoring in market volatility. This allows the indicator to adapt to different instruments.
3 — Price Distance Indicator (CI): Shows how far the price is from the ESA relative to market volatility. This forms the basis for the main indicator line, reacting to price movements.
4 — WT1 (WaveTrend 1): The main line, smoothing the Price Distance Indicator (CI) with the Average Length parameter (default: 21). It reflects the direction of price movement and momentum.
5 — WT2 (WaveTrend 2): A signal line that further smooths WT1 (with a period of 4). It helps confirm signals through crossovers with WT1.
6 — Bands (UpperBand and LowerBand): These form a dynamic channel around the ESA. Their width depends on the level parameter (default: 100). Wider bands result in fewer but more reliable signals. In the original WaveTrend, the oscillator bands use lower values, such as 50 or 60. To achieve classic oscillator signals (more frequent WT1/WT2 crossovers outside the bands), set the level to 50–60.
Trend Identification
The indicator identifies two types of trends:
• Major Trend: Determined by the position of WT1 relative to the ESA. When WT1 is above the ESA, it indicates a bullish trend. When below, it signals a bearish trend. Line and fill colors reflect this trend.
• Mini-Trend: Based on WT1 and WT2 crossovers. When the lines cross, they change to the same color, signaling short-term changes or reversal points. This is ideal for quick trading decisions.
Visuals and Effects
• WT1 and WT2 Lines: Scaled to price and displayed on the price chart for easier analysis.
• Fills: Between the bands (UpperBand/LowerBand) and between WT1/WT2, with a "wave" effect that adjusts transparency based on the trend (green for bullish, red for bearish).
• Signals: Three types—return-to-band, WT1/WT2 crossovers outside the bands, and crossovers inside the bands. Signals are displayed as triangles with different colors for buy and sell.
█ FEATURES
Detailed features of the indicator, aligned with the order of settings in the script:
• Basic Parameters: ESA Length — controls ESA smoothing; Average Length — affects WT1 responsiveness; level (WT Level) — adjusts band width for signal filtering.
• Display Elements: Options to show/hide ESA, bands, WT1/WT2; customizable colors for lines, fills, and the wave effect.
• Signals: Three signal groups (return-to-band, crossovers outside bands, crossovers inside bands) with display and color customization options.
█ HOW TO USE
1 — Add the indicator to your TradingView chart and adjust parameters: — Increase ESA Length and Average Length for low-volatility markets (e.g., stocks), or decrease for cryptocurrencies or forex. — Set level to 50–60 for classic WaveTrend signals with WT1/WT2 crossovers outside bands. The default value of 100 creates wider bands and fewer signals.
2 — Analyze trends: — Major trend (WT1 vs. ESA) shows the overall market direction. — Mini-trends (WT1/WT2 crossovers) help time short-term entries.
3 — Use signals: — Return-to-band: Buy at the lower band, sell at the upper band (mean-reversion). — Crossovers outside bands: Indicate strong momentum (with a lower level, e.g., 50). — Crossovers inside bands: Signal weaker trend changes.
4 — Combine with other tools: Use with volume, RSI, or support/resistance for better decisions. Test on historical data to optimize settings.

Ichimoku PourSamadi Signal [TradingFinder] KijunSen Magic Number🔵 Introduction
The Ichimoku Kinko Hyo system is one of the most comprehensive market analysis tools ever created. Developed by Goichi Hosoda, a Japanese journalist in the 1930s, its purpose was to allow traders to recognize the balance between price, time, and momentum at a single glance. (In Japanese, Ichimoku literally means “one look.”)
At the core of the system lie five key components: Tenkan-sen (Conversion Line), Kijun-sen (Baseline), Chikou Span (Lagging Line), and the two leading spans, Senkou Span A and Senkou Span B, which together form the well-known Kumo or cloud representing both temporal structure and equilibrium zones in the market.
Although Ichimoku is commonly used to identify trends and support/resistance levels, a deeper layer of time philosophy exists within it. Ichimoku was not designed solely for price analysis but equally for time analysis.
In the classical model, the numerical cycles 9, 26, 52 reflect the natural rhythm of the market originally based on the Tokyo Stock Exchange’s trading schedule in the 1930s.
These values repeat across the system’s calculations, forming the foundation of Ichimoku’s time symmetry where price and time ultimately seek equilibrium.
In recent years, modern analysts have explored new approaches to extract time-based turning points from Ichimoku’s structure. One such approach is the analysis of flat segments on the Kijun-sen and Senkou B lines.
Whenever one of these lines remains flat for a period, it signals temporary balance between buyers and sellers; when the flat breaks, the market exits equilibrium and a new cycle begins.
This indicator is built precisely upon that philosophy. Following the timing methodology introduced by M.A. Poursamadi, the focus shifts away from price signals and line crossovers toward identifying flat periods on Kijun-sen (period 52) as time anchors.
From the first candle that changes the line’s slope, the tool begins a temporal count using a fixed sequence of key numbers: 5, 9, 13, 17, 26, 35, 43, 52, 63, 72, 81, 90.
Derived from both classical Ichimoku cycles and empirical testing, these numbers mark potential timing nodes where a market wave may end, a correction may begin, or a new leg may form.
Thus, this method serves not merely as another Ichimoku tool but as a temporal metronome for market structure a way to visualize moments when the market is ready to change rhythm, often before candles reveal it.
🔵 How to Use
The Kijun Timing BoX is built entirely on Ichimoku’s concept of time analysis.
Its core idea is that within every flat segment of the Kijun-sen, the market enters a temporary balance between opposing forces.
When that flat breaks, a new time cycle begins. From that first breakout candle, the indicator starts counting forward through the predefined time sequence(5, 9, 13, 17, 26, 35, 43, 52, 63, 72, 81, 90).
This counting framework creates a temporal map of market behavior, where each number represents an area where meaningful price fluctuations often occur.
A “meaningful fluctuation” does not necessarily imply reversal or continuation; rather, it marks a moment when the market’s internal energy balance shifts, typically visible as noticeable reactions on lower timeframes.
🟣 Identifying the Anchor Point
The first step is recognizing a valid flat zone on the Kijun-sen.
When this line remains flat for several candles and then changes slope, the indicator marks that bar as the Anchor, initiating the time count.
From that point onward, vertical gray lines appear at each interval in the key-number sequence, visualizing the time nodes ahead.
🟣 Reading the Timing Lines
Each numbered line represents a timing node a temporal point where a change in price rhythm is statistically more likely to occur.
At these nodes, the market may :
Enter a consolidation or minor correction phase.
Develop range-bound movement.
Or simply alter the speed and intensity of its move.
These behaviors do not imply a specific direction; they only highlight zones where time-based activity tends to cluster, giving traders a clearer view of cyclical rhythm.
🟣 Applying Time Analysis
The indicator’s primary use is to observe temporal order, not to predict price direction.
By tracking the distance between Anchors and the reactions that appear near major timing lines, traders can empirically identify each market’s characteristic rhythm—its own time DNA.
For example, one asset may consistently show significant fluctuations around the 13- and 26-bar marks,while another might react closer to 9 or 52. Recognizing such patterns helps traders understand how long typical cycles last before new phases of volatility emerge.
🟣 Combining with Other Tools
The indicator does not generate buy/sell signals on its own.
Its best use is in combination with price- or structure-based methods, to see whether meaningful price reactions occur around the same timing nodes.
In practice, it helps distinguish structured time-based fluctuations from random, noise-driven moves an insight often overlooked in conventional market analysis.
🔵 Settings
🟣 Logical Settings
KijunSen Period : Defines the baseline period used for timing analysis. Default = 52. It is the main line for detecting flats and generating time anchors.
Flat Event Filter : Controls how flat segments are validated before triggering a new timing event.
All : Every flat triggers a new Timing Box.
Automatic : Only flats longer than the historical average are used (recommended).
Custom : User manually defines the minimum flat length via Custom Count.
Update Timing Analysis BoX Per Event : If enabled, a new Timing Box is drawn each time a new flat event occurs. If disabled, the box completes its 90-bar window before refreshing.
🟣 Ichimoku Settings
TenkanSen Period : Defines the period for the Conversion Line (Tenkan-sen). Default = 9.
KijunSen Period : Sets the standard Ichimoku baseline (not the timing line). Default = 26.
Span B Period : Defines the period for Senkou Span B, the slower cloud boundary. Default = 52.
Shift Lines : Offsets cloud projection into the future. Default = 26.
🟣 Display Settings
Users can show or hide all Ichimoku lines Tenkan-sen, Kijun-sen, Chikou Span, Span A, and Span B as well as the Ichimoku Cloud.
They can also customize the color of each element to match personal chart preferences and improve visibility.
🔵 Conclusion
This analytical approach transforms Ichimoku’s time philosophy into a visual and measurable framework. A flat Kijun-sen represents a moment of market equilibrium; when its slope shifts, a new temporal cycle begins.
The purpose is not to forecast price direction but to highlight periods when meaningful fluctuations are more likely to develop.
Through this perspective, traders can observe the hidden rhythm of market time and expand their analysis beyond price into a broader time-cycle dimension.
Ultimately, the method revives Ichimoku’s original principle: the market can only be truly understood through the simultaneous harmony of price, time, and balance.

WaveRider Momentum OscillatorWaveRider Momentum Oscillator
The WaveRider Momentum Oscillator applies principles inspired by fluid dynamics to model price momentum as a flowing system, rather than relying on traditional static calculations. By interpreting market movement through the lens of velocity, viscosity, and turbulence—core concepts in fluid mechanics—this indicator offers a more adaptive and nuanced view of momentum that adjusts dynamically to changing market conditions.
Conceptual Foundation
Velocity: Just as fluid velocity measures the speed of flow at a point, WaveRider calculates momentum velocity by measuring the rate of price change over a specified period, smoothed to reduce noise.
Viscosity: In fluid dynamics, viscosity represents internal friction that resists flow. Here, viscosity is modeled based on volatility, modulating momentum signals to account for the “thickness” or noise level of the market. High volatility increases viscosity’s damping effect, reducing false signals during turbulent price action.
Turbulence: Turbulence characterizes sudden, chaotic changes in fluid flow. WaveRider detects rapid acceleration bursts in momentum analogous to turbulence, highlighting moments when momentum is shifting sharply and potentially signaling strong upcoming price moves.
Technical Features and Interpretation
Adaptive Momentum Calculation: Momentum is scaled by volatility-adjusted viscosity, making the oscillator less prone to whipsaws and more responsive during stable trends.
Turbulence Burst Detection: The oscillator incorporates a turbulence factor, identifying abrupt momentum accelerations that traditional oscillators often miss. This feature provides early warning signals of potential breakout or reversal points.
HSV Gradient Color Mapping: The oscillator visualizes acceleration using a continuous hue gradient—ranging from red (deceleration) through yellow (neutral) to green (acceleration). This continuous color transition provides intuitive, real-time insight into momentum dynamics beyond mere numeric values.
Pivot Point Identification: WaveRider automatically marks momentum pivots, signaling local maxima and minima in momentum flow. These points serve as critical confirmation markers for potential entry and exit decisions.
How to Interpret WaveRider
Colors:
Green hues indicate positive acceleration — momentum is increasing, favoring bullish positions.
Yellow hues represent neutral momentum — the market is consolidating or pausing.
Red hues signal negative acceleration — momentum is weakening, suggesting caution or bearish bias.
Oscillator Direction:
An upward sloping oscillator line reflects strengthening momentum.
A downward slope indicates weakening momentum or a potential reversal.
Pivot Labels:
▲ (Pivot Low): Denotes local momentum troughs; potential points to consider initiating long positions.
▼ (Pivot High): Marks local momentum peaks; useful for identifying possible short entries or profit-taking zones.
Summary
By grounding momentum analysis in fluid dynamics, WaveRider transcends the limitations of traditional oscillators. It accounts for the market’s inherent volatility and captures real-time acceleration changes, enabling traders to detect meaningful momentum shifts with greater accuracy and clarity.
WaveRider is designed for traders seeking a scientifically informed tool that adapts fluidly with market conditions—offering deeper insight into momentum flow and better timing for entries and exits.

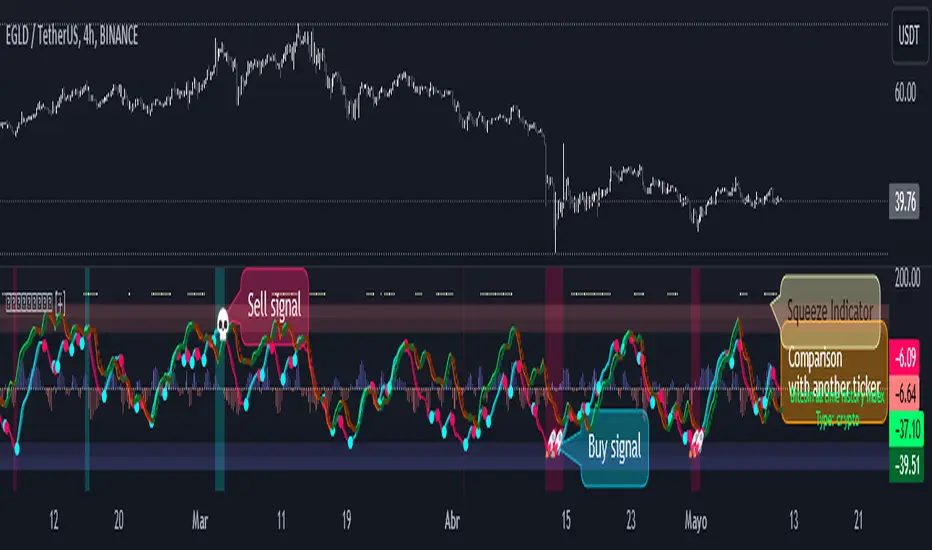
WaveTrend Oscillator PlusThe WaveTrend based on “Enhanced WaveTrend” of EliCobra. The WaveTrend Oscillator is a popular technical analysis tool used to identify overbought and oversold conditions in the market and generate trading signals. This indicator introduces additional features for improved analysis and comparison across assets.
WaveTrend:
The original WaveTrend indicator calculates two lines based on exponential moving averages and their relationship to the asset's price. The first line measures the distance between the asset's price and its EMA, while the second line smooths the first line over a specific period. The result is divided by 0.015 multiplied by the smoothed difference ('d' for reference). The indicator aims to identify overbought and oversold conditions by analyzing the relationship between the two lines.
In the original formula, the rudimentary estimation factor 0.015 times 'd' fails to accomodate for approximately a quarter of the data, preventing the indicator from reaching the traditional stationary levels of +-100. This limitation renders the indicator quantitatively biased, as it relies on the user's subjective adjustment of the levels. The enhanced version replaces this factor with the standard deviation of the asset's price, resulting in improved estimation accuracy and provides a more dynamic and robust outcome, we thereafter multiply the result by 100 to achieve a more traditional oscillation.
Enhancements and Features:
Dynamic Estimation: The original indicator uses an arbitrary estimation factor, while the enhanced version replaces it with the standard deviation of the asset's price. This modification provides a more dynamic and accurate estimation, adapting to the specific price characteristics of each asset.
Stationary Support and Resistance Levels: The enhanced version provides stationary key support and resistance levels that range from -150 to 150. These levels are determined based on the analysis of the indicator's data and encompass more than 95% of the indicator's values. These levels offer important reference points for traders to identify potential price reversals or significant price movements.
Comparison Across Assets: The enhanced version allows for better comparison and analysis across different assets. By incorporating the standard deviation of the asset's price, the indicator provides a more consistent and comparable interpretation of the market conditions across multiple assets.
Z-Score Analysis:
The Z-Score is a statistical measurement that quantifies how far a particular data point deviates from the mean in terms of standard deviations. In the enhanced version, the calculation involves determining the basis (mean) and deviation (standard deviation) of the asset's price to calculate its Z-Score, thereafter applying a smoothing technique to generate the final WaveTrend value.
Utility:
The offers traders and investors valuable insights into overbought and oversold conditions in the market. By analyzing the indicator's values and referencing the stationary support and resistance levels, traders can identify potential trend reversals, evaluate market strength, and make better informed analysis.
The following indicators were added:
⎆⎆ Squeeze Momentum Indicator
⎆⎆ Elliott Wave Oscillator
⎆⎆ Expert Trend Locator