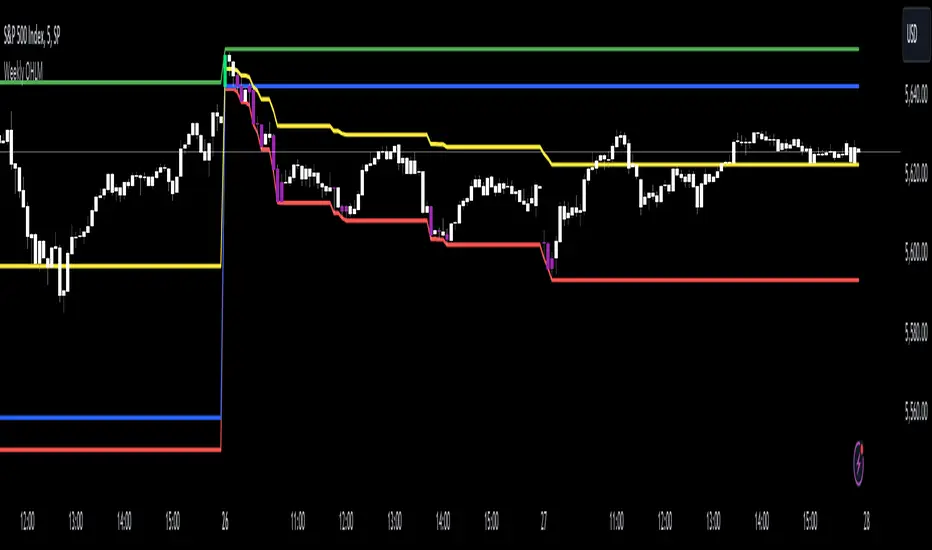
Weekly OHLC LevelsWeekly OHLC Levels Indicator
This indicator plots the previous week's open, high, low, and close (OHLC) levels on the chart for the entire duration of the current week. These levels can be critical for identifying key support and resistance zones, as they often represent psychological levels that traders watch closely.
Features:
Plots previous week’s High (green), Low (red), Open (blue), and Close (purple).
Levels remain visible throughout the current week, providing consistent reference points.
Helps in visualizing how current price action interacts with last week’s important levels.
How to Use:
Use these levels to gauge potential support and resistance areas.
Monitor price reactions around these levels, especially during the beginning of the week, as they can serve as pivot points.
This indicator is suitable for all markets and timeframes, providing valuable insight into price structure relative to weekly market behavior.
Cari dalam skrip untuk "weekly"

Weekly Map By BTweekly map
This indicator draws the Low and High of the weekly candle and divides it into the required percentages
Weekly OHLC UpdatedWeekly OHLC first edit is to include a standard style.
From here we'll be adding a few moving averages and a few other things I find helpful in both in crypto and FOREX trading.

Weekly OHLM [CrossTrade]The "Weekly OHLM" is a versatile utility indicator designed for traders who focus on weekly price movements. This indicator offers a comprehensive view of an asset's weekly price range and dynamic signaling features. Here's a summary of its key functionalities and how it works:
Weekly Price Levels: The indicator plots three critical levels based on weekly price data: the weekly high, weekly low, and weekly open. These levels are recalculated every week, providing a clear picture of the price range and the opening price for the week.
Midpoint Calculation: A crucial feature of this indicator is the calculation of the midpoint of the week's price range. This midpoint is derived by averaging the weekly high and weekly low, offering a reference point for the week's price equilibrium.
Dynamic Updating: As the week progresses, the indicator dynamically updates the weekly high and low if newer high or low prices are observed. This feature ensures that the plotted levels accurately reflect the current week's price movements.
Visual Highlights: The indicator uses color-coded plots to enhance visual clarity. The weekly high is marked in green, the weekly low in red, and the weekly open in blue. The midpoint is plotted in yellow, making it easily distinguishable.
Bar Coloring for New Highs and Lows: Bars that touch or surpass the weekly high are colored lime, and those that touch or drop below the weekly low are colored purple. This color-coding provides immediate visual cues about price touching these significant levels.
Alert System
The indicator includes a sophisticated alert system that notifies traders of specific events:
Crossing Over Midpoint: An alert is triggered when the price crosses over the midpoint, suggesting a potential upward movement.
Crossing Under Midpoint: An alert is activated when the price crosses under the midpoint, indicating a potential downward trend.
Weekly High and Low Touch: Alerts can also be set for when the price touches or exceeds the weekly high or low, signaling significant price movements.
This indicator is particularly useful for traders who base their strategies on weekly timeframes or need to understand weekly price dynamics in relation to intraday trading. By offering a clear view of important price levels and dynamic alerts, it aids in making informed trading decisions based on significant weekly price movements.
Weekly Power 3Did you know there is a simple line you can place on your chart to immediately make the weeks price action more understandable? Its called the Weekly Open Line. And its the opening price of the trading week. It was created by The Inner Circle Trader (ICT) and incorporates another one of his concepts called Power 3.
The Weekly Power 3 indicator takes the idea of the Weekly Open Line and builds a suite of intelligent and dynamic tools around it that will immediately help the user to start understanding how price moves within the trading week context.
Features
Static Weekly Open Line
Intelligent Days of the Week Text
Dynamic Weekly High Line
Dynamic Weekly Low Line
Weekly High Candle Label (highest candle of the week)
Weekly Low Candle Label (lowest candle of the week)
Best Odds High of the Week Zone Line & Text
Best Odds Low of the Week Zone Line & Text
Components
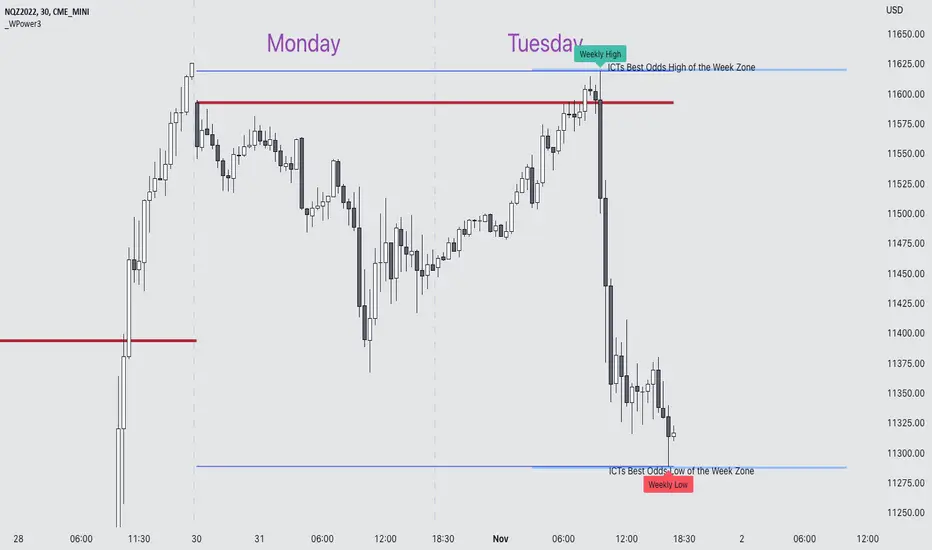
The primary feature is a line that forms on the weekly open price and grows as the week progresses. Additionally, lines are created for the highest and lowest prices of the week so the weekly profile can be easily recognized. A dynamic label marks each weeks highest and lowest point. This will automatically move as prices expand throughout the week.
A very useful component of the Weekly Power 3 indicator is the Days of the Week text. Each Day of the Week text is displayed in the middle of each trading day and also the user can specify in the Settings whether to position the text at the high or low of the weeks price range. Additionally, there is a Buffer setting that allows the user to move the Days of the Week text up or down to prevent chart overlapping.
To help the user visualize the span of time with the best odds of forming the weekly highs or weekly lows, according to ICT, this indicator adds at static line and optional label into the charts future that projects the span from Tuesday’s London Open to Wednesday’s New York. Having a static line out in the future on your chart really helps to picture where price could be drawn to based solely around time of the week.
Premise
ICT says that the weekly open price is the most important level that price reacts to across the five days of a trading week. If the week profile is expected to be bullish then price many times goes below the weekly open line at the beginning of the week and above it later in the week (a.k.a Bullish Power 3). Consequently, if the week is anticipated to be a bearish week, price often times starts the week high and then goes lower throughout the week (a.k.a Bearish Power 3).
ICT always specifies that the weekly high or weekly low have the best odds of forming between the Tuesday’s London Open and Wednesday’s New York Open.
Inputs and Style
Like all scripts publish by Infinity Trading, everything in the indicator is customizable by the user. Every label, line, or text can be individually toggled ON or OFF so the user has complete control over the elements they want displayed on their chart. All of the lines can be individually adjusted by color, line style, or line width. The color and text color on the high and low of the week labels can be individually changed. The text in the chart (day of the week & best odds zones text) each have a “buffer” value. This allows the user to individually move the text up or down on the chart to declutter the chart. And lastly, the day of the week text can be positioned above or below the weeks price action and the text will dynamically move higher or lower as price expands throughout the week.
Previous weeks have all of the Weekly Power 3 markups so it's easy to study past price action and identify trends.
Gallery
View the weeks price action
View multiple weeks price action
Visualize future price action

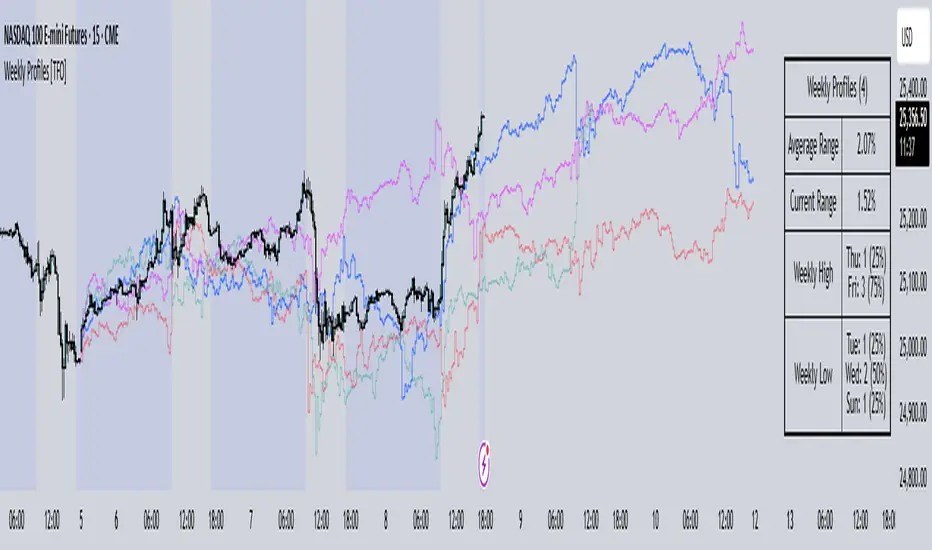
Weekly Profiles [TFO]This Weekly Profiles indicator was built to overlay historical data to show how prior weeks of price action have unfolded under specified input conditions.
When "Show Historical Weekly Profiles" is enabled, the indicator draws out how prior weeks have traded. This is done by tracking weekly price movements, measuring the percent change from each week's respective weekly open price, and translating that percent change to the current week's open price to visually describe how price fluctuated in those previous weeks.
With "Show Weekly Profile Table" enabled, we can observe some basic statistics on the weekly profiles that have been collected, such as the average range and which days have made the high/low of the week from the given dataset.
There are also options to refine the dataset by specifying which days have made the high/low of the week, which will only show profiles that meet said criteria. For instance, by enabling "Low of Week" and selecting "Monday", the indicator will show every weekly profile that made its low on a Monday. In the following chart, we can again use the table to observe that we currently have 14 such weeks on NQ1! (from the data available on our current chart timeframe and TradingView plan), whose average range is 3.65% from the week's low to the week's high, and from those 14 weeks, the high of the week was made on a Friday 10 times or 71% of the time.
The "Profile Resolution" option specifies the interval at which to show changes in price (given that it is greater than or equal to the current chart timeframe). In the below chart, the Profile Resolution is set to 4 hours. As such, it simplifies the profiles by tracking the close price of each 4 hour candle (again as a percent change from each profile's respective open price). The larger Profile Resolution can make it easier to observe commonalities between profiles, such as the below chart of NQ1! that highlights a noticeable price decrease during the New York morning session across several of the available weekly profiles.
There is also an option to "Highlight Closest Profiles" which does exactly that. Essentially, all weekly profiles are given a score according to how close the current week's price action is matching each profile up until the current point in time. For example, if one were observing this indicator on a Wednesday afternoon, each profile would be scored according to how close price is to each profile, starting from the weekly open, up until the Wednesday afternoon of each profile. Everything after that point in time is disregarded since it hasn't happened yet and can't be measured. With this in mind, profiles with greater similarity to the current week are highlighted with deeper colors, and profiles with lesser similarity are given lighter, more transparent colors.
The "Randomize Colors" option will use various colors for the weekly profiles for easier visual differentiation (especially where there are several profiles crowding each other), as opposed to otherwise having one color for all profiles. Lastly, there are basic styling options to control the table position, table size, and the line width of all weekly profiles.
Weekly Range Support & Resistance Levels [QuantVue]Weekly Range Support & Resistance Levels
Description:
The Weekly Range Support & Resistance Levels analyzes weekly ranges and takes the average range of the last 30 weeks (default setting).
It also takes the average +/- a standard deviation, and creates support & resistance levels/zones based on the weekly opening price.
The levels will update each week, and previous weekly levels can be toggled on or off.
Settings:
🔹Averaging Period
🔹Standard Deviation Multiplier
🔹Toggle Support & Resistance Prices
🔹Show Weekly Open Line
🔹Show Previous Levels
Don't hesitate to reach out with any questions or concerns. We hope you enjoy!
Cheers.

Weekly Open Range [BigBeluga]
A precision weekly range tracker that captures early market positioning from the first moments of the trading week.
By dynamically measuring the highest and lowest points from the first three candles after the Sunday 21:00 UTC open, the indicator builds a reactive support and resistance framework for the week ahead.
It also visualizes the active range with a dynamic box and provides live updates of the current price movement against the established range boundaries.
🔵 KEY FEATURES
Automatically marks the weekly open range starting at Sunday 21:00 UTC .
Identify maximum high and minimum low from the first 3 candles after the weekly open.
if isWeeklyOpen or isWeeklyOpen or isWeeklyOpen or isWeeklyOpen
h = math.max(high, range_box.get_top())
l = math.min(low, range_box.get_bottom())
Draws two horizontal lines from the range extremes, acting as dynamic support/resistance zones throughout the week.
Visualizes the range with a semi-transparent box for clear zone identification.
Includes a compact dashboard panel with:
- Symbol and current price with bullish or bearish bar indication with ▲ / ▼
- Current weekly high/low range values
🔵 USAGE
Treat the high and low of the range as support/resistance zones for the week.
Combine with volume analysis or liquidity tools for entry confirmation .
Refresh your key levels every week as the indicator resets each Sunday night .
Works great alongside Smart Money Concepts (ICT) strategies and weekly planning.
Weekly Open Range gives traders a reliable structure to anchor their week. With clear range mapping, breakout signals, and intuitive visuals, it becomes a valuable part of any strategic trading approach—especially when precision timing around liquidity zones is key.

Weekly Initial BalanceWeekly Initial Balance Indicator
The Weekly Initial Balance (IB) indicator is a powerful tool designed for traders to identify key support and resistance levels based on the market's initial activity at the start of each week. By analyzing the first 30 hours of trading.
Key Features:
Customizable IB Period: Define the start hour and duration of the initial balance period to suit your trading schedule and the specific market you are analyzing, I have it set at 30 hours by default.
IB High, Low, and Midpoint Levels: Automatically plots the high, low, and midpoint of the IB period, providing immediate visual reference to critical price levels.
Extension Levels: Calculate and display extension levels based on customizable percentages (e.g., 50%, 100%, 150%), allowing you to project potential breakout targets and identify areas of interest beyond the initial balance range.
Dynamic Lines and Labels: The indicator updates in real-time, extending lines and repositioning labels as new bars form, ensuring you always have the most current information.
Customizable Appearance: Adjust line styles, widths, colors, and label positions to match your charting preferences and improve visual clarity.
How to Use:
Set the IB Parameters:
Week Start Hour (UTC): Specify the hour when the weekly IB period begins. I use 1800EST as that is when the futures market opens.
IB Duration in Hours: Define how many hours constitute the IB period.
Configure Extension Levels:
Input the desired extension percentages to calculate levels beyond the IB range.
Customize Visual Settings:
Adjust line colors, styles, widths, and label offsets to tailor the indicator's appearance.
Interpret the Levels:
Use the IB high and low as immediate support and resistance levels.
Monitor the midpoint for potential pivot areas.
Watch for price interactions with extension levels to anticipate breakouts or reversals.
Benefits:
Identify Key Weekly Levels: Understand the market's initial sentiment each week to gauge potential trends.
Enhance Trading Strategies: Incorporate the IB levels into your trading plan for better entry and exit points.
Adaptable to Various Markets: Suitable for Forex, commodities, indices, and other markets where weekly analysis is beneficial.

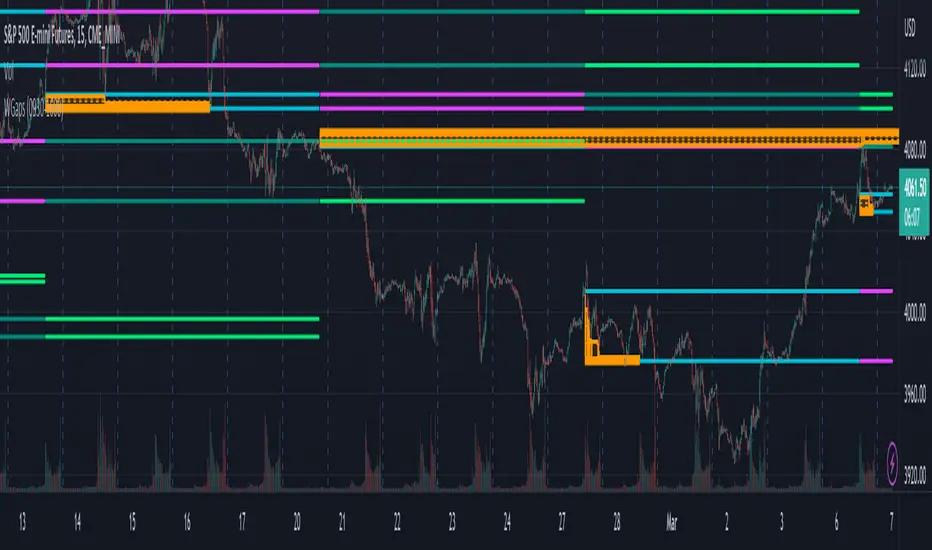
Weekly Opening GAPThis indicator will plot the weekly opening gap on the chart. The gap will be carried forward until it is closed or the max line count is reached. Additionally the 1/4 levels inside the gap are plotted on the chart as weekly gaps can be large.
The weekly opening gap levels can act as targets and rejection points.
Optionally the script can also carry forward the top and bottom lines of the weekly opening gap for up to the 10 prior gaps. These lines are not removed when the gap is closed.
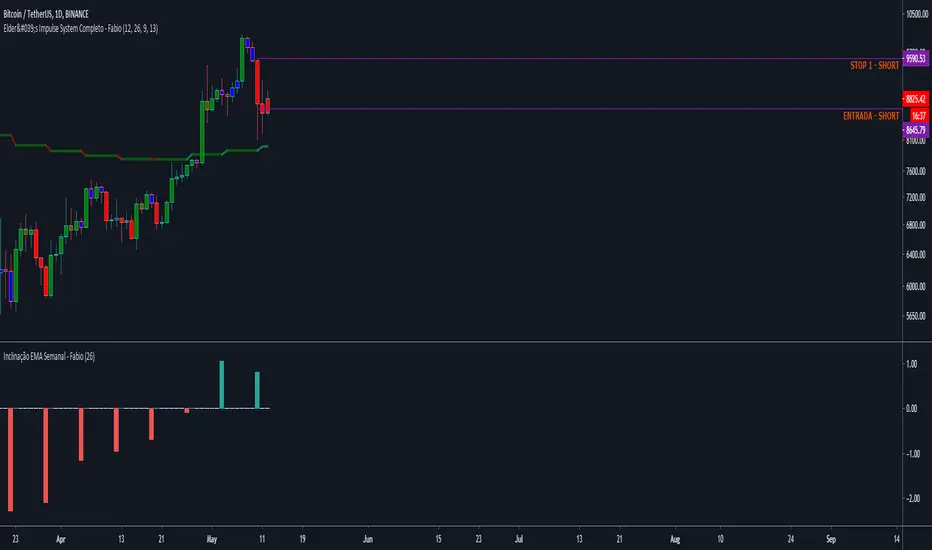
Weekly Moving Averages (MAs) to Intraday ChartThis indicator overlays key weekly timeframe moving averages onto your intraday chart, allowing you to visualize important long-term support and resistance levels while trading shorter timeframes. The indicator includes:
330-period Simple Moving Average (white): Ultra long-term trend indicator
200-period Simple Moving Average (fuchsia): Major long-term trend indicator often watched by institutional traders
100-period Simple Moving Average (purple): Medium-to-long term trend indicator
50-period Exponential Moving Average (blue): Medium-term trend indicator, more responsive to recent price action
21-period Exponential Moving Average (teal): Short-to-medium term trend indicator
9-period Exponential Moving Average (aqua): Short-term trend indicator, highly responsive to recent price movements
This multi-timeframe approach helps identify significant support/resistance zones that might not be visible on your current timeframe. When price interacts with these weekly moving averages during intraday trading, it often signals important areas where institutional orders may be placed.
The indicator uses color-coding with increasing line thickness to help you quickly distinguish between different moving averages. Consider areas where multiple MAs cluster together as particularly strong support/resistance zones.
Perfect for day traders and swing traders who want to maintain awareness of the bigger picture while focusing on shorter-term price action.

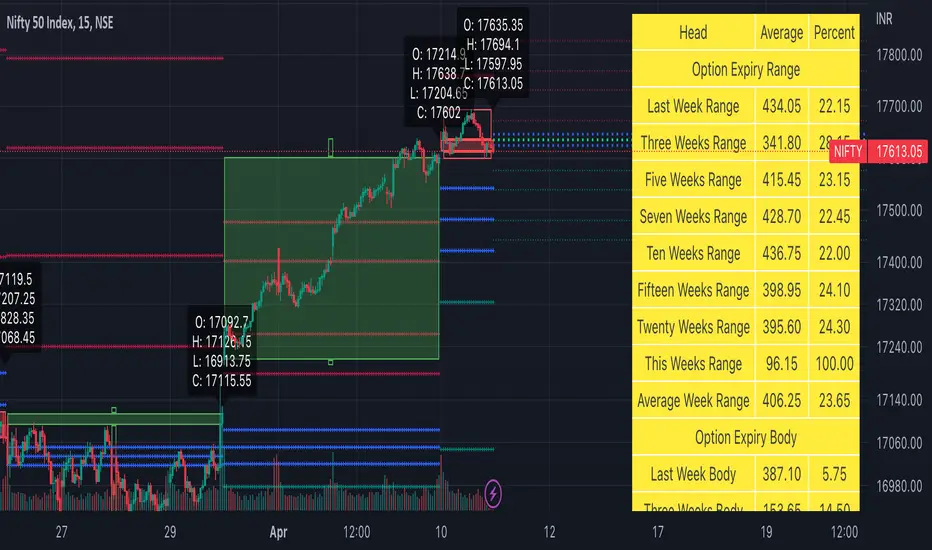
Weekly Options Expiry Candle V.2In India Weekly options expire on Thursday and that creates a different price action candle than the week timeframe.
My previous script Weekly Options Expiry Candle has some limitations. This script overcame those limitations and added some features.
You can use this in any intraday time frame candle.
It will show:
All expiry candle in box format
Expiry OHLC label
Pivot (Floor or Fibonacci) based on expiry OHLC data
Developing Expiry candle and Pivot
A table showing expiry range(high-low) and Expiry body abs(open-close) stats.
You can turn on or off any feature.
Please let me know if you found this script useful or have any questions or suggestions.
NSE:BANKNIFTY
NSE:NIFTY
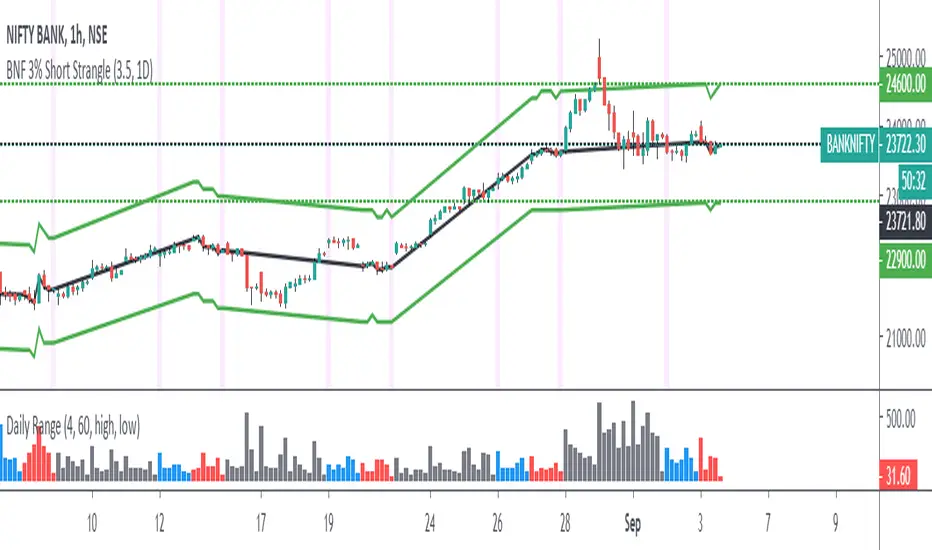
Weekly Short Strangle in % terms BandsDraw lines/band or deviation for any Script based on given input %
Generally used for Weekly options strangle/iron condor BANKNIFTY/NIFTY
1) Input % deviation required
2) for every Thursday Closing basis calculates the % distance and draws bands until next Thursday
Weekly and Daily EMA levelsThis Pine Script indicator provides important weekly and daily levels for lower time frame traders, whom trades based on reaction of these levels.
Dedicated to Prof Michael G
Key Features:
Multi-timeframe EMAs: Shows 12, 21, 50, 100, and 200 period EMAs from both Weekly and Daily timeframes
Horizontal dotted lines: Uses plot.style_linebr to create the dotted/dashed line effect
Works on all timeframes: The lines will appear on any chart timeframe you're viewing
Customizable: Individual toggles for each EMA period and timeframe
Settings Available:
Toggle Weekly/Daily EMAs on/off
Enable/disable individual EMA periods (12, 21, 50, 100, 200)
Customize colors for each EMA line
Adjust line width
Optional labels showing current EMA values
How to Use:
Copy the code into TradingView's Pine Editor
Click "Add to Chart"
Adjust settings in the indicator's Style tab as needed
The weekly EMAs appear with slightly more opacity (30%) while daily EMAs have higher transparency (60%) to help distinguish between timeframes. The lines will automatically update as new bars form and will be visible regardless of what timeframe you're currently viewing on your chart.

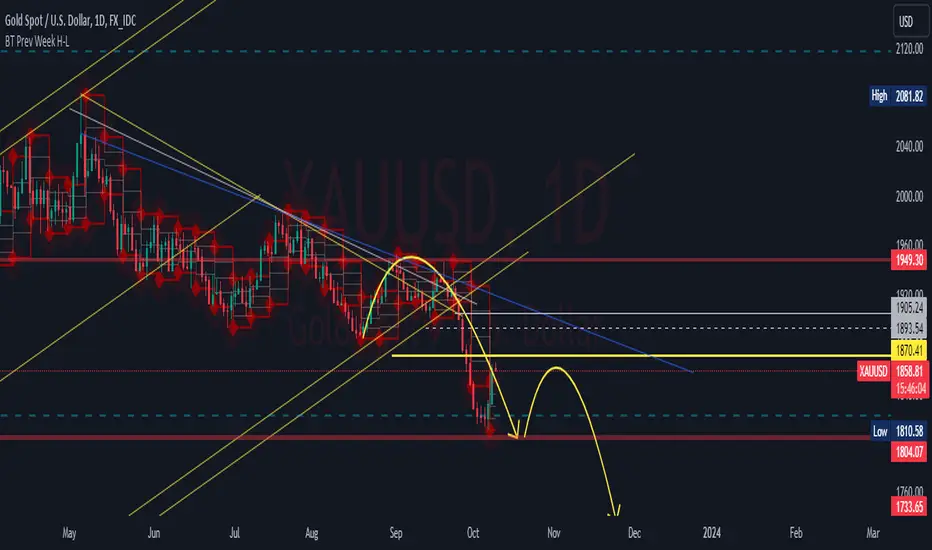
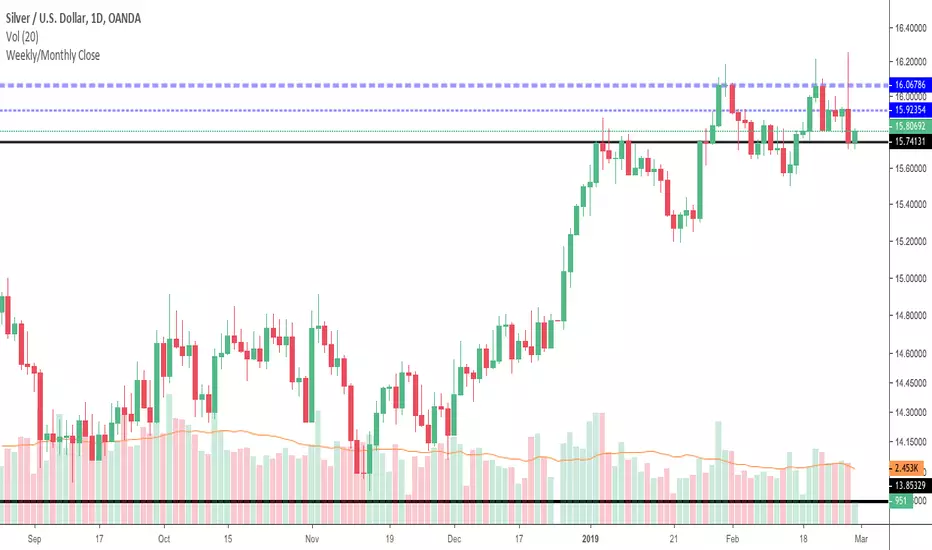
Weekly/Monthly CloseJust a simple support/resistance indicator that display weekly/monthly close price and it is configurable to work in two modes:
tracking mode - to display last week/month's close
history mode - to display weekly/monthly close prices
See how last month's close (ticker blue line) provides nice resistance and the price forms a double top then it consolidates under last week's close line (thiner blue line).
It also works on intraday charts and displays history close prices, see below how last month's close (ticker blue line) provides support over and over and also how price bounces off weekly close history prices (thiner blue line).
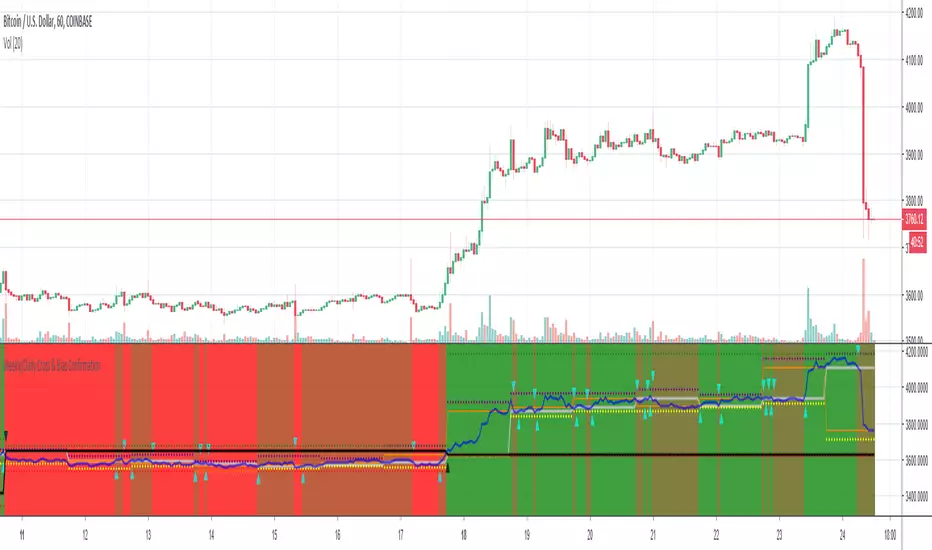
Weekly/Daily Cross & Bias ConfirmationThis indicator plots the weekly and daily open in addition to a current close price line.
It also signals when price closes above or below the daily and weekly opens.
Also, the bull/bear bias is painted on this indicator as well.
Black is the weekly open
Silver is the daily open
Weekly is default black arrows. Up is going above open, down is going below
Daily is default aqua arrows. Up is going above, down is going below
Weekly OHLC Plus 3 Weekly TF EMAsPlots weekly OHLC (with option to turn on monthly Open and Close) and 3 Weekly resolution EMAs (customizable).
This indicator is a combination of a few I've created/updated here on TV.
First part plots Weekly OHLC with an option to plot monthly open and close.
This indicator also plots on your chart 3 EMAs (customizable) from the Weekly timeframe (resolution).
The default settings (all EMAs)
200 - Orange
50 - Purple
20 - Black
There is no smoothing so the EMA line will appear jagged.

Weekly EMAs (Slow, Mid, Fast)This indicator plots on your chart 3 EMAs (customizable) from the Weekly timeframe (resolution).
The default settings (all EMAs)
200 - Orange
50 - Purple
20 - Black
There is no smoothing so the EMA line will appear jagged.
I start my week with understanding the bias on a weekly timeframe and weekly chart setups but I find it useful to have these weekly EMAs on different resolutions (especially the Daily).


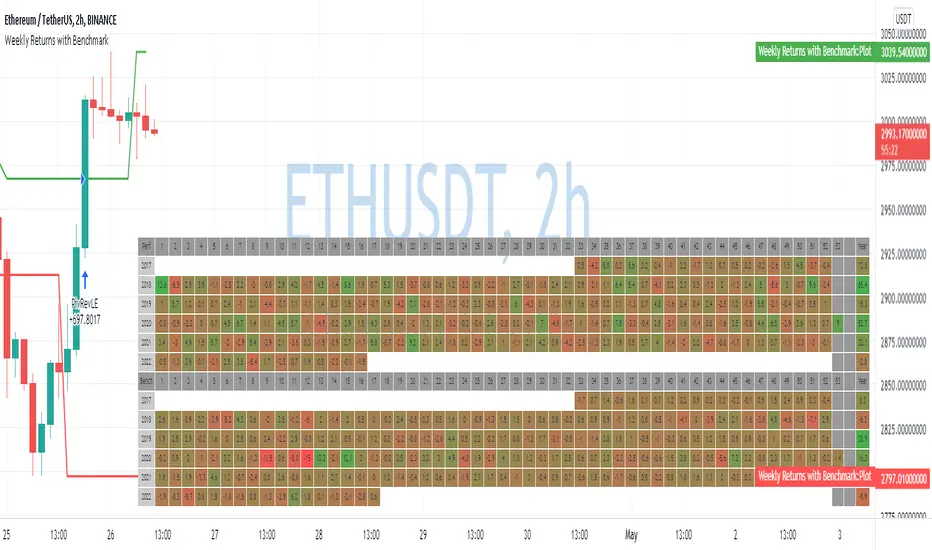
Weekly Returns with BenchmarkSome time ago I published Monthly returns table. Now It's time for weekly one.
To get it work you need a pretty big screen, but I hope it will be useful for some of you.
Features of this table includes:
Display weekly returns of your strategy, benchmark, and alpha over this benchmark.
Select benchmark to be another instrument
Select the date from which you want to compute monthly returns
Show/hide benchmark and alpha
Choose colors for gradient for gain/loss values
Use it with any type of strategy
Use it with replay
Thanks to @MUQWISHI to help me coding it.
It's not about the strategy itself but the way you display returns on your chart. So pls don't critique my choice of the strategy and its performance 🙂
Disclaimer
Please remember that past performance may not be indicative of future results.
Due to various factors, including changing market conditions, the strategy may no longer perform as well as in historical backtesting.
This post and the script don’t provide any financial advice.
Weekly/Daily/Hourly/Minutes Colored Background IntervalsThis is my "Weekly/Daily/Hourly/Minutes Colored Background Intervals" assistant. I wouldn't describe it as an indicator, it just exhibits coloration of referenced periods of time with bgcolor() in Pine. With the arrival of 2021, I pondered the necessity of needing a visualization pre-2021 to visually recognize periodicity of market movements by the week, day, hour, or an adjustable period of minutes. While this script is simply generic, I hope you may find useful in your endeavors as a member on TradingView.
Explaining the script's usage, the "Minutes" input can be adjusted from anywhere between 5-55 minutes for only intraday. This can be modified to accommodate 90 minutes (1.5hrs) or any other minutes period desirable by tweaking certain numbers up to 1440. Minutes and Hourly backgrounds are disabled by default for most daily traders. Changing the input() code to `true` will provide them on by default when the script loads, if you choose that route. Each time periods background color is enable/disable capable. All of the colors are easily adjustable to any combination you can ponder for your visual acuity with the color swatch provided by input(type=input.color). The coloring can be "swapped" by input() depending on how you wish to start and end the day visually. I thought this would come in handy. The weekly background can have different starting points, whether it be Sunday, Monday, or any other day such as Friday for example.
The entire script's contents isn't intended for complete re-use as is for publicly published scripts. It's more along the lines of code that could be used to personally modify indicators you have, depending on the time frames you may actually be trading on. The code is basically modular, so you can use bits and pieces of it in your personally modified Pine Editor scripts that you wish to customize for yourself. I will say that the isXxx() functions are completely reusable in any script without any need for author permission inquiries from me, as easy as copy and paste. Those may come in handy for many folks. If you find them useful in certain circumstances, use isXxx() functions as you please. Day of the week detection by functions will have applications beyond my current intended use for them.
Of notable mention, this is a miniature lesson by example of how the new input(type=input.color) may be used. I'm also using `var` inside functions to aid in computational efficiency of the script runtime. The colors are permanently stored at the very beginning of the scripts operation inside the function and just reused from that point onward. Its a rare use case, but well suited for this scripts intention. Once again I have demonstrated the "Power of Pine" for developers of any experience level to learn from via code elegance.
When available time provides itself, I will consider your inquiries, thoughts, and concepts presented below in the comments section, should you have any questions or comments regarding this indicator. When my indicators achieve more prevalent use by TV members , I may implement more ideas when they present themselves as worthy additions. Have a profitable future everyone!