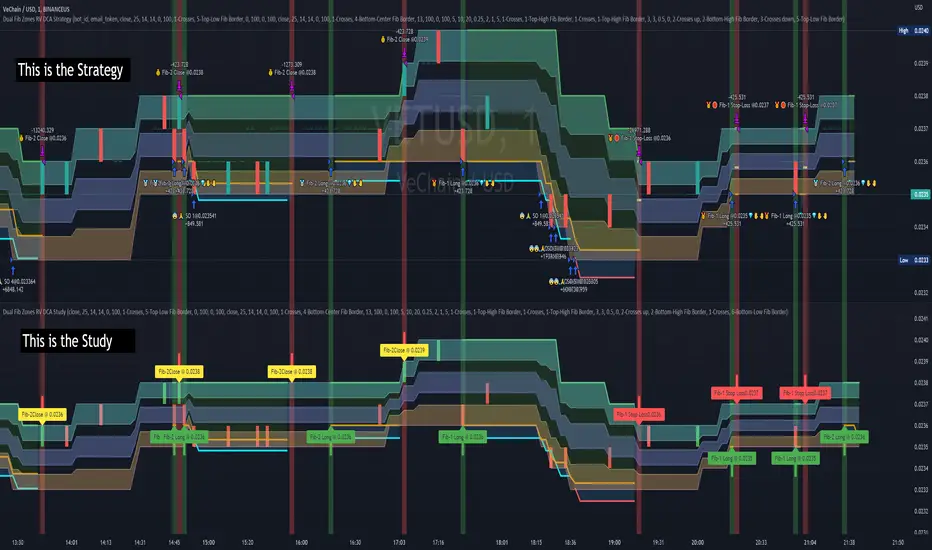
Dual Fibonacci Zones & Ranged Vol DCA Study - R3c0nTraderWhat does this do?
This signal script (aka Study) was created so it could be used with the corresponding strategy "Dual Fibonacci Zone & Ranged Vol DCA Strategy - R3c0nTrader" to create the buy and sell signals for 3Commas bots.
How to Use
Configure the study to match your settings you have set in the strategy. This script comes with an buy and sell alert conditions built-in. Just click to add alert and select Buy or Sell and paste in your bot messages.
Credits:
Thank you "EvoCrypto" for granting me permission to use "Ranged Volume" to create this study
Thank you "eykpunter" for granting me permission to use "Fibonacci Zones" to create this study
Cari dalam skrip untuk "zone"
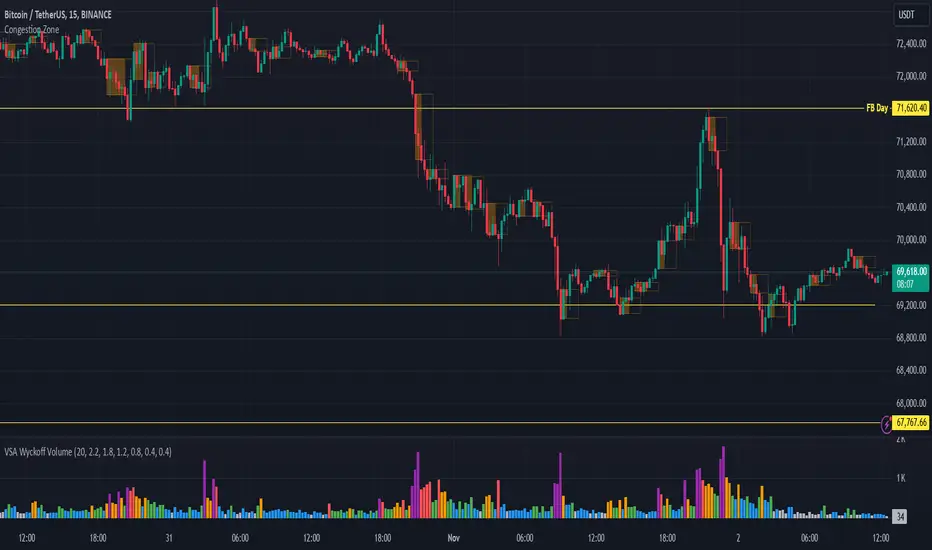
Congestion ZoneCongestion zone include at least 3 candle sticks that the next candle has an opening and closing price within the previous candle
When the price returns to the congested zone there is a possibility of a reversal
The congestion zone is used as a support-resistance area and is used by price action traders.
This script will highlight congestion zones, this will help PA Traders find out them easily.
Multiple MAs + No Trend Zone + ATR WidgetThis is my first Pine Script attempt. Nothing special, just an "all in one" for the most common things I use, and what I have found to be the most common in a lot of strategies.
Great for free and limited accounts as it combines 7 total indicators into one.
-- First 5 indicators are Independant Moving Averages:
-Each one can be set for length, as well as source and type (SMA, EMA, SMMA, WMA, VWMA) individually
-- Second type (6th) of indicator is one I find extremly useful for staying OUT of consolidation trading. It's called a "No Trend Zone" indicator I swipped from the Hoffman Startegy. Basically, its set for a small deviation (0.5) of a 35 EMA, which creates a "Band" around the 35 line. When you have this "Band" flat or with no discernable incline/decline, with price action OR some or multiple moving averages inside this banded zone, it typically indicates a zone of consolidation. This will help you identify when you may be in one of those zones, that way you don't get trapped "waiting for paint to dry" before the market starts to move again with your position, and keep you from entering should you be considering the market at that time.
The last indicator is my favorite, and one I will refine a little deeper soon.
-- The ATR widget finishes us out. This widget can be customized for colors, turned on or off, and automatically rounds the ATR (ATR period based on the chart timeframe) to a nice readable number for what you're trading. It has settings to show or not, the length, what rounding style to use (forex pip 0.0001, forex/stock/etf/indicies 0.01) where to show it on the pane, a Multiplier Factor (for stop loss calculations automatically) and the colors.
***NOTE ABOUT ATR WIDGET:
I am primarily a forex trader, so the defaults are for Forex 0.0001. If you see some odd numbers (like 55798 on a current chart), check the inputs tab on the settings, and change the "ATR Style" from "Forex 0.0001" to "Forex/Stock/ETF/Indicies 0.01", and you should arrive with the correct number.

Combo Ichimoku + CDC Action Zone by fukuizThis indicator combines the famous indicators Ichimoku and CDC ActionZone.
#A brief introduction to Ichimoku #
The Ichimoku Cloud is a collection of technical indicators that show support and resistance levels, as well as momentum and trend direction. It does this by taking multiple averages and plotting them on a chart. It also uses these figures to compute a “cloud” that attempts to forecast where the price may find support or resistance in the future.
#A brief introduction to CDC ActionZone #
CDC ActionZone is a very simple system, utilizing just two exponential moving averages. The 'zones' in which different 'actions' should be taken are highlighted in different colors. Calculations for the zones
They are based on the relative position of price to the two EMA lines and the relationship between the two EMAs.
The CDC ActionZone was developed by Piriya333, a Thai technical analyst.
#How to use #
The basic method for using Ichimoku+CDC ActionZone is to follow the green/red color and the cloud.
Buy condition
-Buy when the bar closes in green and closes above the cloud
Sell condition
-sell when the bar closes in red.

Volume Zone Oscillator (VZO)My interpretation of Walid Khalil's Volume Zone Oscillator (VZO) as published in the 2009 International Federation of Technical Analysis Journal.
This VZO indicator is also the same as Danielle Shay's popular Simpler Trading TurboVZO indicator.
ABOUT:
The oscillator breaks up volume activity into positive and negative categories. It is positive when the current closing price is greater than the prior closing price and negative when it's lower than the prior closing price. The resulting curve plots through relative percentage levels that yield a series of buy and sell signals, depending on level and indicator direction.
HOW TO USE THE INDICATOR:
The default period is 14 but can be adjusted after backtesting.
The VZO points to a positive trend when it rises above and maintains the 5% level, and a negative trend when it falls below the 5% level and fails to turn higher. Oscillations between the 5% and 40% levels mark a bullish trend zone, while oscillations between -40% and 5% mark a bearish trend zone. Meanwhile, readings above 40% signal an overbought condition, while readings above 60% signal an extremely overbought condition. Alternatively, readings below -40% indicate an oversold condition, which becomes extremely oversold below -60%.
Kahlil recommends confirming VZO signals with a 14-period average directional index (ADX), with values greater than 18 pointing to a trending market - search Tradingview's built-in indicators for the Directional Movement Index (DMI).
INTRADAY SCALPING:
Whilst the VZO is already smoothed with an exponential moving average, the indicator settings include an additional 'smoothing' function to remove any excess 'noise' in the plots for intraday use.

Heat Zone Relative Volatility Index 2.0v2 of Heat Zone RVI
• Updated aesthetics and added various alerts.
• The use of temperature descriptions with these Heat Zone scripts is more so metaphoric of the interpretations from what the RVI attempts to indicate primarily.
--- Due to the additions of the Overheated and Freezing Zones , the indicator-pane scaling is a little different from the original Heat Zone RVI .
Ex.)
--- If you like the scaling the way it was on v1, you can change it back by going into the settings , opening up the style page, and unchecking/turning off the Overheated Top Line as well as the Freezing Bottom Line . Otherwise, you can leave the settings be in regards to this matter.
Ex.)
Disclaimer : I am by no means a highly skilled or professional coder/programmer. I just enjoy dabbling and tinkering every now and again.
HOPE YOU ENJOY

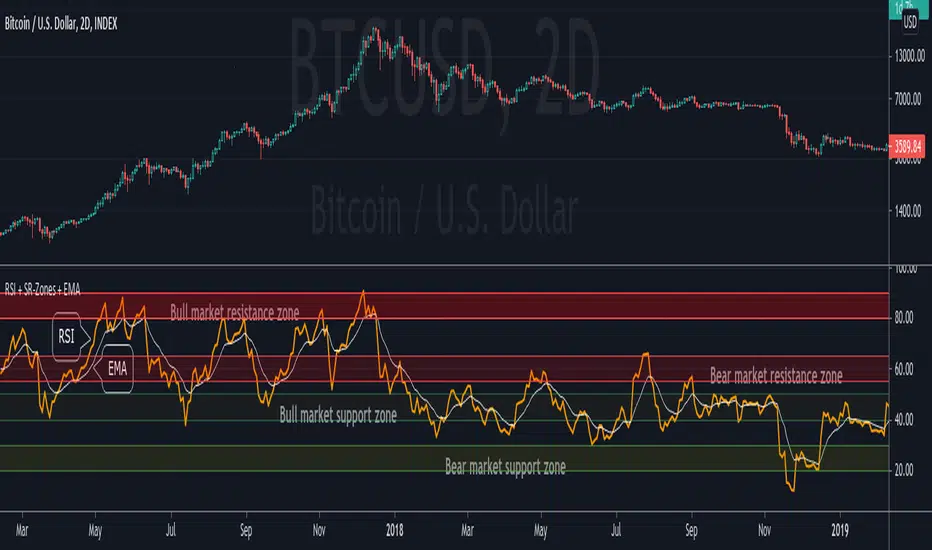
RSI + Support/Resistance Zones + EMAThis indicator enhances the RSI with support and resistance zones and an EMA.
RSI: a regular RSI (default: orange / 14 period)
EMA: an EMA on the RSI (default: light gray / 10 period)
RSI support/resistance zones
SR-Zones for bull markets: In a bull market the price tends to find resistance between 80 and 90 and support between 40 and 50 RSI.
SR-Zones for bear markets: In a bear market the price tends to find resistance between 55 and 65 and support between 20 and 30 RSI.
The concept of these support and resistance zones has been popularized by Constance Brown in her book Technical Analysis for the Trading Professional . The SR zones are described in the first chapter which is available in the preview section on Amazon.
RSI-EMA
The EMA on the RSI can also be used as support and resistance. For example, you can be use it for a simple strategy such as the following: In an uptrend after a significant correction during which the RSI has been below the EMA for some time, wait for the RSI to cross above the EMA to go long and exit (partially) after the RSI crossed down the EMA.
Hint: All visual elements (RSI, EMA, support zones) can be enabled/disabled and adjusted individually.
GMS: Mr. Yen's Color ZoneThis is Mr. Yen's color zone. I have also added an input to adjust the sizes of each box. Mainly targeted for MES and ES.
The default settings are as he describes:
white line is the previous day close
red zone = +/- 20 from the previous day close
yellow zone = +/- 40 from the previous day close
green zone = +/- 60 from the previous day close
blue zone = +/- 100 from the previous day close
The source code is open, so feel free to take a look and see whats up. This indicator is quite similar to his, however there is a gap at the cash close to overnight open on his chart that I'm not sure how to adjust for. In any case, this one is still pretty good!
I hope it helps,
Andre

Supply and Demand ZonesThis indicators should be used along with price action breakout
Red zones - Red zones are formed daily
10 days average ranges
Blue zones - Blue zones are formed every week
10 weeks average ranges
Green zones - Green zones are formed every month
10 months averange ranges
NSDT Triple KeltnerA different spin on Keltner Channels. Using 3 channels of varying widths provides a good visual for potential entries off of extremes. Normal channel is center, green and red "zones" could be used as potential entry/exit areas, and the outside yellow zones may be viewed as extremes (signifying potential breakouts or strong reversal areas).

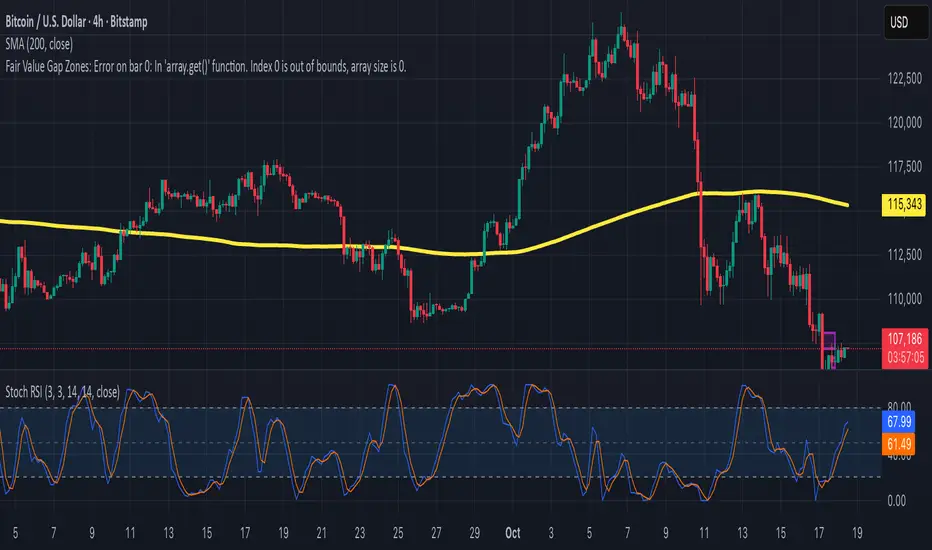
Fair Value Gap ZonesDescription
This script automatically detects and highlights Fair Value Gaps (FVGs) on any chart and timeframe.
It identifies bullish and bearish imbalance zones using candle-to-candle price displacement and shades them visually on the chart for easy reference.
Bullish FVGs are marked with dark green zones, showing areas where price may later return before continuing upward.
Bearish FVGs are shaded in light red, indicating potential retracement zones in downtrends.
All zones extend forward automatically, updating dynamically as new candles form.
Designed for traders who use Smart Money Concepts (SMC) or ICT-style analysis, this tool helps visualize market inefficiencies and potential reaction points with clear, minimal visuals.
200W MA Valuation ZonesInspired by "Crypto Currently"
📈 200-Week MA Valuation Zones Indicator
This script visualizes long-term valuation zones based on the 200-week moving average (MA) — a widely followed metric for identifying major market cycle bottoms and tops.
It divides price levels into five distinct zones relative to the 200W MA:
🟦 Very Cheap — Below 200W MA
🟩 Cheap — 1.0× to 1.5× 200W MA
🟨 Fair Value — 1.5× to 2.0× 200W MA
🟧 Expensive — 2.0× to 2.5× 200W MA
🟥 Very Expensive — Above 2.5× 200W MA
You can choose to anchor zones to the current price or display full historical bands.
Color-coded regions and labels make it easy to identify when an asset is historically undervalued or overvalued based on long-term moving averages.

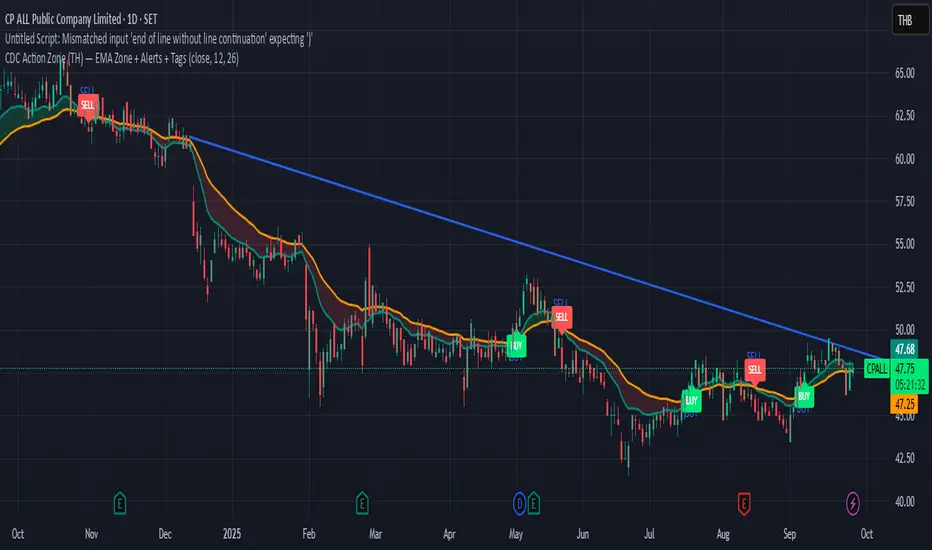
CDC Action Zone (TH) by MeowToolsThe CDC Action Zone indicator is like a stock market traffic light — it tells you when it’s green to go and when it’s red to stop. By combining just two EMAs (12 and 26), it highlights Buy and Sell zones clearly, cutting through market noise and keeping you on the right side of the trend. Think of it as a radar that spots the big moves before most people notice, giving you the confidence to ride the trend and exit before getting trapped. Meow 😺 give it a try and see how it can help your portfolio take off 🚀📈
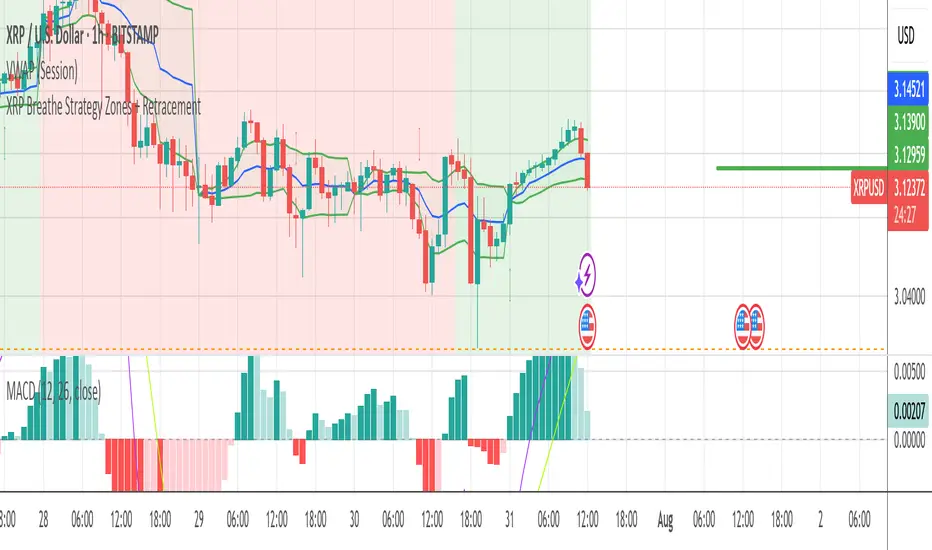
XRP Breathe Strategy Zones + RetracementGreen/red backgrounds = Inhale/Exhale phase timing
Horizontal lines at $3.65 / $3.00 / $2.60 for reference
MACD arrows = entry/exit hints within phase context
New yellow/purple retracement lines:
Inhale → yellow line = pullback buy zone
Exhale → purple line = potential rally target or short zone
Liquidity Zones (JTS)Title: Liquidity Zones (JTS)
Description:
This script marks out key liquidity zones using pivot highs and lows. It includes:
Buy-Side Liquidity (Highs): Shown in red lines
Sell-Side Liquidity (Lows): Shown in green lines
Sweep Protection: Zones will only be removed after a defined number of bars AND a true sweep beyond the level
Toggle Controls: Enable/disable highs or lows individually
Adjustable Settings: Pivot length, sweep delay, max lines, and colors
Perfect for traders looking to track untapped or recently swept liquidity.
Created by JTS
For educational and strategic use

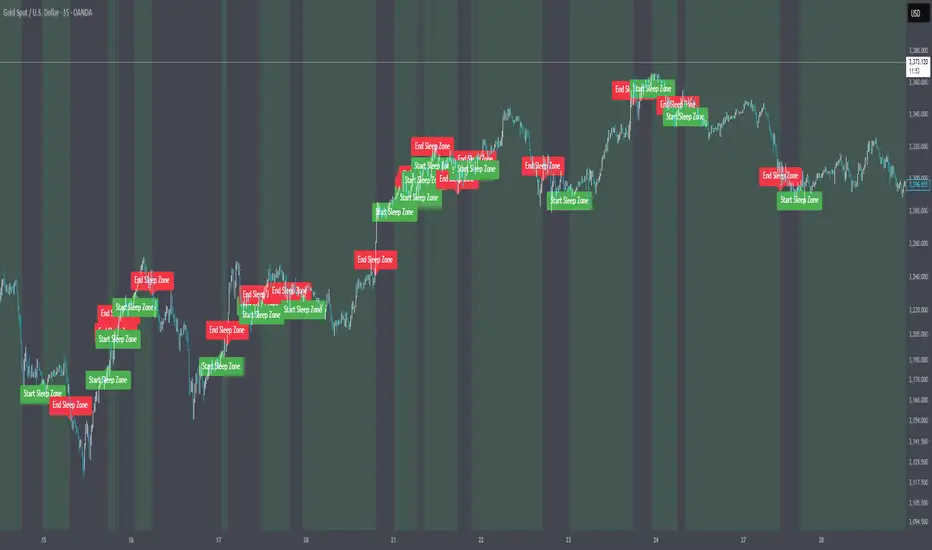
Market Sleep ZonesHey traders 👋
This script shows when the market is in a "sleeping" or low volatility phase. I call it Market Sleep Zones 😴
It looks at the average price movement over a window (default 20 bars), and if the price changes are small (under a % threshold you set), it highlights that area on the chart with a soft green background.
💡 This can help spot moments when the market is quiet — maybe before a breakout or just moving sideways.
It also places labels to mark where these zones start and end, so it's easy to track.
You can change:
The window size (how many bars to look back)
The breath depth (how much price is allowed to move before it’s "not sleeping" anymore)
Not perfect, but helpful if you want to avoid getting chopped in low-volatility zones or want to prepare for when the market "wakes up" 😄
Let me know if you find it useful or have ideas to improve it!
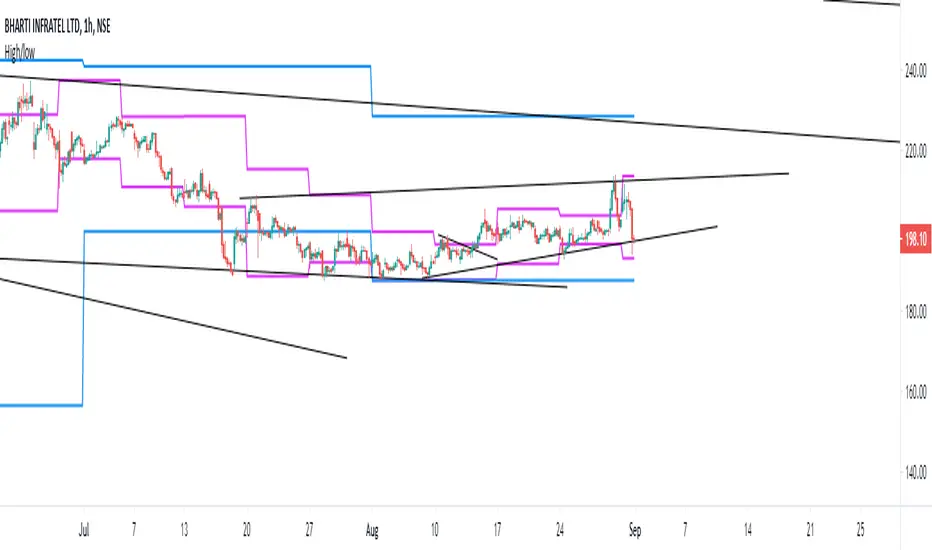
OA - Price Magnet Zones Price Magnet Zones Indicator
Overview
The Price Magnet Zones indicator identifies special price levels that have a high statistical probability of being revisited by price in the future.
It works by detecting candles with specific formation characteristics - those without top or bottom wicks - which often signify important market levels that price tends to return to.
Key Features
Automated Detection: Identifies special candle formations automatically and draws horizontal lines at these levels
Dynamic Management Removes lines once price touches them or when they exceed the lookback period
Statistical Analysis: Tracks touch rates and average time until price returns to these levels
Clean Visual Interface: Shows only untouched levels for a clear chart view
How It Works
The indicator detects two specific types of candle formations:
Bullish Levels: Candles with no bottom wick (open = low) that close higher
Bearish Levels: Candles with no top wick (open = high) that close lowe
These formations often represent hidden liquidity zones or order blocks where price tends to return. The indicator draws horizontal lines at these levels and tracks whether price revisits them.
Statistics Tracking
The indicator maintains comprehensive statistics about the detected levels:
Total Levels: Number of bullish, bearish, and total levels detected
Touched Levels: Number of levels that price has returned to touch
Touch Rate: Percentage of levels that have been touched by price
Average Touch Time: Average number of bars until price touches each level type
Trading Applications
These hidden levels can be valuable for:
Identifying potential support and resistance zones
Finding entry and exit points for trades
Setting stop loss levels
Determining price targets
Confirming other technical signals
Settings
Max Bars to Track: Maximum number of bars to keep tracking a level (default: 500)
Line Thickness: Visual thickness of the horizontal lines (1-4)
Line Color: Color of the horizontal lines
Min Candles Before Check: Number of candles to wait before including touches in statistics (default: 3)
Show Statistics: Toggle statistics table display
Usage Tips
The statistics only count touches that occur after the specified minimum number of candles have passed, providing more meaningful data
Higher touch rates indicate stronger magnetic properties of these levels
The average touch time can help with timing expectations for trades
These levels work across various timeframes and markets
For best results, use alongside other technical analysis tools
This indicator does not provide trading signals but offers valuable insights into hidden market structure that can enhance your trading strategy.

CandelaCharts - Liquidity Key Zones (LKZ)📝 Overview
The Liquidity Key Zones indicator displays the previous high and low levels for daily, weekly, monthly, quarterly, and yearly timeframes. These levels serve as crucial price zones for trading any market or instrument. They are also high-probability reaction zones, ideal for trading using straightforward confirmation patterns.
Each of these levels plays a significant role in determining whether the market continues its momentum or reverses its bias. I like to think of these levels as dual magnets—they simultaneously attract and repel price. You might wonder how having opposing views can be useful. The key is to remain neutral about direction and establish your own rules to identify when these zones are likely to attract or repel price. I have my own set of rules, and you can develop yours.
📦 Features
MTF
Styling
⚙️ Settings
Day: Shows previous day levels
Week: Shows previous week levels
Month: Shows previous month levels
Quarter: Shows previous quarter levels
Year: Shows previous year levels
Show Average: Shows previous level average price
Show Open: Shows previous level open price
⚡️ Showcase
Daily
Weekly
Monthly
Quarterly
Yearly
Average
Open
📒 Usage
When the price breaks through a significant level, such as a daily, weekly, or monthly high or low, it often signals a potential reversal in market direction. This occurs because these levels represent key areas of support or resistance, where traders anticipate heightened activity, including profit-taking, stop-loss orders, or new positions being initiated.
Once the price breaches these levels, it may trigger a sharp reaction as market participants adjust their strategies, leading to a reversal. Monitoring price action and volume around these levels can provide valuable confirmation of such reversals.
Another effective approach to utilizing these pivot points is by incorporating them into a structured trading strategy, such as the X Model, which leverages multiple timeframes and technical tools to refine trade entries and exits.
X Model conditions:
(D1) Previous Day High (ERL)
(H1) Bullish FVG/IFVG/OB (IRL)
(m15) MSS / SMT
Only Short Above 00:00
By combining these elements, the X Model offers a comprehensive framework for leveraging pivot levels effectively, emphasizing confluence between liquidity zones, time-based rules, and multi-timeframe analysis to enhance trading accuracy and consistency.
🚨 Alerts
This script provides alert options for all signals.
Bearish Signal
A bearish signal is generated when the price breaks below the previous low level.
Bullish Signal
A bullish signal is generated when the price breaks above the previous low level.
⚠️ Disclaimer
Trading involves significant risk, and many participants may incur losses. The content on this site is not intended as financial advice and should not be interpreted as such. Decisions to buy, sell, hold, or trade securities, commodities, or other financial instruments carry inherent risks and are best made with guidance from qualified financial professionals. Past performance is not indicative of future results.

Liquidity ZonesLiquidity Zones Indicator
The Liquidity Zones indicator is a custom Pine Script™ tool designed to identify significant price levels where high trading volume has occurred. These zones often act as support or resistance levels, providing valuable insights for traders.
Key Features:
Window Size: The number of bars to consider for calculating the moving averages and identifying peaks.
Tolerance: The allowable percentage difference to consider peaks as unique.
Number of Peaks: The maximum number of significant peaks to identify.
Minimum Volume: The minimum volume threshold relative to the average volume to consider a peak.
Minimum Range: The minimum price range to consider a peak.
How It Works:
Input Parameters: The user can customize the window size, tolerance, number of peaks, minimum volume, and minimum range.
Moving Averages: The script calculates the simple moving average (SMA) of the volume and closing prices over the specified window.
Peak Identification:
For each bar, the script identifies the bar with the highest volume within the window.
It checks if the volume exceeds the minimum volume threshold.
It determines the peak price based on whether the bar closed higher or lower than it opened.
It ensures the price range of the bar exceeds the minimum range.
It checks if the peak is above the SMA of the closing prices.
It verifies the peak is unique within the specified tolerance.
Plotting Peaks: The identified peaks are plotted on the chart with lines and labels, color-coded based on whether the bar closed higher (green) or lower (red).
This indicator helps traders visualize key liquidity zones, aiding in making informed trading decisions.

Momentum Zones [TradersPro]OVERVIEW
The Momentum Zones indicator is designed for momentum stock traders to provide a visible trend structure with actionable price levels. The indicator has been designed for high-growth, bullish stocks on a daily time frame but can be used on any chart and timeframe.
Momentum zones help traders focus on the momentum structure of price, enabling disciplined trading plans with specific entry, exit, and risk management levels.
It is built using CCI values, allowing for fixed trend range calculations. It is most effective when applied to screens of stocks with high RSI, year-to-date (YTD) price gains of 25% or higher, as well as stocks showing growth in both sales and earnings quarter-over-quarter and year-over-year.
CONCEPTS
The indicator defines and colors uptrends (green), downtrends (red), and trends in transition or pausing (yellow).
The indicator can be used for new trend entry or trend continuation entry. New trend entry can be done on the first green bar after a red bar. Trend continuation entries can be done with the first green bar after a yellow bar. The yellow transition zones can be used as price buffers for stop-loss management on new entries.
To see the color changes, users need to be sure to uncheck the candlestick color settings. This can be done by right-clicking the chart, going to Symbols, and unchecking the candle color body, border, and wick boxes.
Remember to check them if the indicator is turned off, or the candles will be blank with no color.
The settings also correspond to the screening function to get a list of stocks entering various momentum zones so you can have a prime list of the stocks meeting any other fundamental criteria you may desire. Traders can then use the indicator for the entry and risk structure of the trading plan.

MACD Highlight Zones for PrimetimeUse the MACD Highlight Zones to easily spot changes in market momentum and make more informed trading decisions.
The MACD Highlight Zones script visually enhances your chart by highlighting different zones based on the MACD's relationship to the zero line and its signal line. This script helps traders quickly identify the market's momentum and potential reversal points.
Features:
🟢 Green Background: Indicates the MACD line is above 0, signaling bullish momentum.
🟡 Yellow Background: Indicates the MACD line crosses the signal line, suggesting a potential momentum shift.
🔴 Red Background: Indicates the MACD line is below 0, signaling bearish momentum.

Blockunity Excess Index (BEI)Identify excess zones resulting in market reversals by visualizing price deviations from an average.
The Excess Index (BEI) is designed to identify excess zones resulting in reversals, based on price deviations from a moving average. This moving average is fully customizable (type, period to be taken into account, etc.). This indicator also multiplies the moving average with a configurable coefficient, to give dynamic support and resistance levels. Finally, the BEI also provides reversal signals to alert you to any risk of trend change, on any asset.
The Idea
The goal is to provide the community with a visual and customizable tool for analyzing large price deviations from an average.
How to Use
Very simple to use, this indicator plots colored zones according to the price's deviation from the moving average. Moving average extensions also provide dynamic support and resistance. Finally, signals alert you to potential reversal points.
Elements
The Moving Average
The Moving Average, which defaults to a gray line over 200 periods, serves as a stable reference point. It is accompanied by an Index, whose color varies from yellow to orange to red, offering an overview of market conditions.
Extensions
These dynamic lines can be used to determine effective supports and resistances.
Signals
Green and red triangles serve as clear indicators for buy and sell signals.
Settings
Mainly, the type of moving average is configurable. The default is an SMA.
A Simple Moving Average (SMA) calculates the average of a selected range of prices by the number of periods in that range.
But you can also, for example, switch the mode to EMA.
The Exponential Moving Average (EMA) is a moving average that places a greater weight and significance on the most recent data points:
You also have WMA.
A Weighted Moving Average (WMA) gives more weight on recent data and less on past data:
And finally, the possibility of having a PCMA.
PCMA takes into account the highest and lowest points in the lookback period and divides this by two to obtain an average:
You can change other parameters such as lookback periods, as well as the coefficient used to define extension lines.
You can refer to the tooltips directly in the indicator parameters.
For those who prefer a minimalist display, you can activate a "Bar Color" in the settings (You must also uncheck "Borders" and "Wick" in your Chart Settings), and deactivate all other elements as you wish:
Finally, you can customize all the different colors, as well as the parameters of the table that indicates the Index value and the asset trend.
How it Works
The Index is calculated using the following method:
abs_distance = math.abs(close - base_ma)
bei = (abs_distance - ta.lowest(abs_distance, lookback_norm)) / (ta.highest(abs_distance, lookback_norm) - ta.lowest(abs_distance, lookback_norm)) * 100
Signals are triggered according to the following conditions:
A Long (buy) signal is triggered when the Index falls below 100, when the closing price is lower than 5 periods ago, and when the price is under the moving average.
A Short (sell) signal is triggered when the Index falls below 100, when the closing price is greater than 5 periods ago, and when the price is above the moving average.

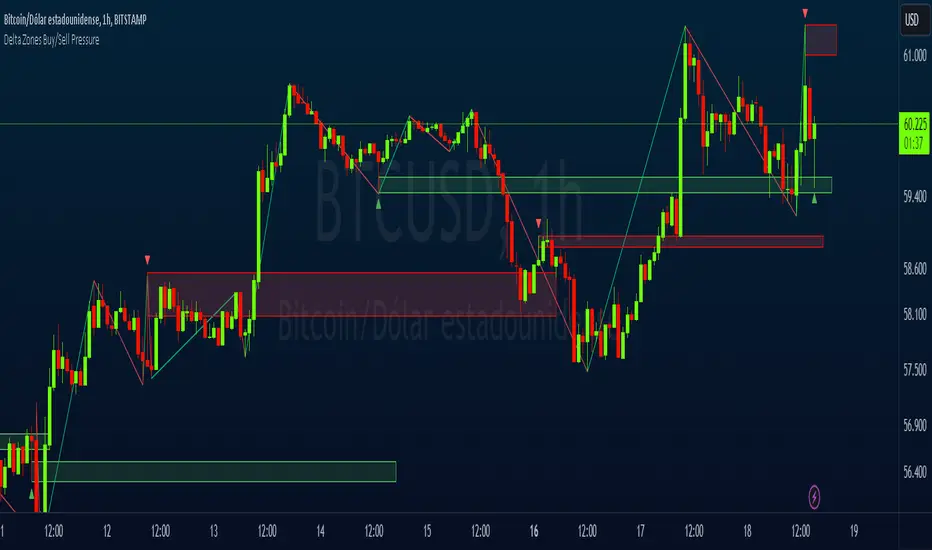
Delta Zones Buy/Sell PressureScript Description:
Delta Zones Buy/Sell Pressure Indicator
Description:
The "Delta Zones Buy/Sell Pressure" indicator, created by the original author "scarf", is a technical tool that unveils key areas of buying and selling pressure in the market. This indicator utilizes the concept of Delta, calculating differences between open, close, high, and low prices. When these differences exceed a threshold determined by the user-defined standard deviation, areas of intense buying (indicated by green boxes) and selling pressure (indicated by red boxes) on the chart are identified.
How It Works:
The indicator calculates Delta using various combinations of candle prices to determine buying and selling pressure. When Delta surpasses a certain level, indicated by the user-defined standard deviation, visual signals in the form of boxes on the chart are generated. These boxes highlight specific areas where buying or selling pressure is particularly strong, aiding traders in identifying potential entry and exit points in the market.
How to Use:
* When a green box is drawn, it indicates strong buying pressure in the market. This can be interpreted as a signal to consider long positions.
* When a red box is drawn, it indicates strong selling pressure in the market. This can be interpreted as a signal to consider short positions.
* Use these signals in combination with your own analysis and risk management strategies to make informed trading decisions.
Originality:
What makes this indicator original is its unique approach to identifying specific areas of buying and selling pressure. By calculating Delta in multiple ways and utilizing standard deviation as a filter, this indicator provides clear and concise visual signals about market activity. The combination of these features distinguishes it as a valuable tool for traders seeking a better understanding of market behavior. This modification differs from the original by displaying the information on the price chart with horizontal bars, below each delta, instead of an oscillator at the bottom similar to the volume indicator.
Final Recommendations:
Consider Market Trends:
Before making any trading decisions using the Delta Zones Buy/Sell Pressure Indicator, it is crucial to analyze the prevailing market trends. Assess the overall direction of the market, whether it's trending upward, downward, or moving sideways. Align your trades with the dominant trend to increase the probability of successful outcomes. The indicator's signals can be more reliable when they align with the broader market trend.
Evaluate Macro-Economic Factors:
Additionally, take into account macro-economic factors that could influence price movements. Factors such as economic indicators, geopolitical events, interest rate decisions, and global market sentiments can significantly impact the financial markets. Stay updated with relevant news and economic reports to anticipate potential market shifts. Understanding the broader economic context can help you interpret the indicator's signals within a more informed framework.
Practice Risk Management:
Regardless of the signals provided by the Delta Zones Buy/Sell Pressure Indicator, always implement effective risk management strategies. This includes setting stop-loss orders, diversifying your portfolio, and only risking a small percentage of your trading capital on each trade. By managing your risk, you can protect your investments and ensure longevity in the market, even during volatile periods.
Continuous Learning and Adaptation:
Financial markets are dynamic and constantly evolving. Continuously educate yourself about new trading strategies, technical analysis tools, and economic developments. Stay open to adapting your trading approach based on changing market conditions. Regularly reviewing your trading strategy and adjusting it according to your experiences and market feedback can significantly enhance your trading performance over the long term.
Seek Professional Advice if Necessary:
If you are uncertain about specific market trends, indicators, or economic factors, don't hesitate to seek guidance from financial advisors or professionals. Their expertise can provide valuable insights and help you make well-informed decisions, especially in complex or uncertain market environments.
By incorporating these recommendations into your trading approach, you can enhance your decision-making process, mitigate risks, and increase your overall chances of successful trading outcomes. Remember, the key to successful trading lies not only in the tools you use but also in your ability to interpret them within the broader market context.