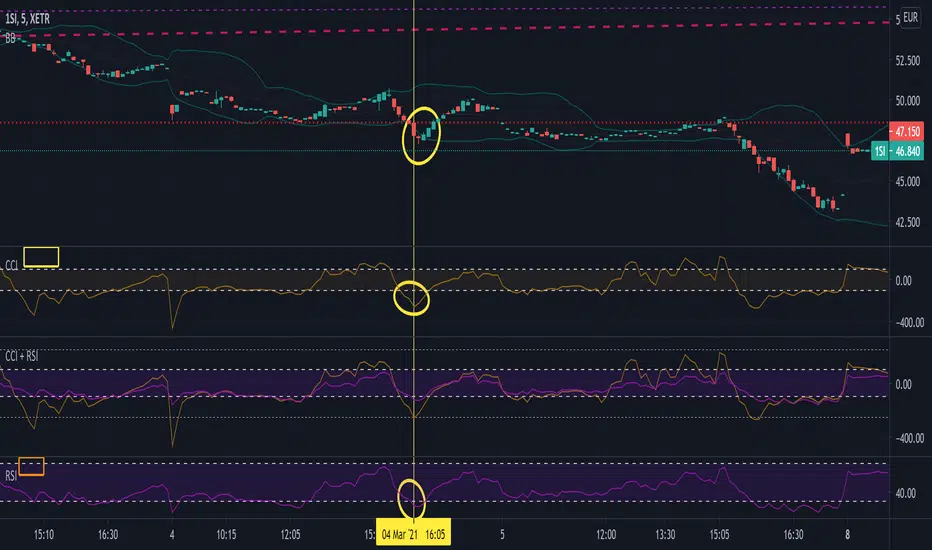
Commodity Channel Index + Relative Strength Index (Same Scale)Mashup, combining (adjusted) RSI and CCI.
These two indicators serve similar functions, but on different scales. I combined the two versions from the TradingView Built-In library into one chart, keeping the default setting for the CCI signal lines and fitting the RSI's default signal lines to them, so that they line up. I therefore adjusted the RSI to match the approximate range of the CCI and added additional lines to represent the maximum and minimum values of the RSI (0 - 100).
I did that by multiplying the RSI with 5, and subtracting 250.
Adjusted RSI = (RSI * 5) - 250
So the upper signal line (default: 70) now matches the line used for the CCI at 100. The lower signal line (default: 30) lines up with -100.
If you want to adjust them, you need to use the formula. I annotated the code if you want to dive deeper.
This indicator uses the original code and styling of the default Built-In RSI and CCI. Credit goes to the appropriate developers. My only intent is to mash up both of these indicators, making it easier to compare them.
Interpreting this indicator is the same as interpreting the underlying indicators. If you find any unexpected correlations, comment.
Cari dalam skrip untuk "“中国联通”股票相对强弱指标RSI走势图,数值在0至100之间上下起伏的变动,"
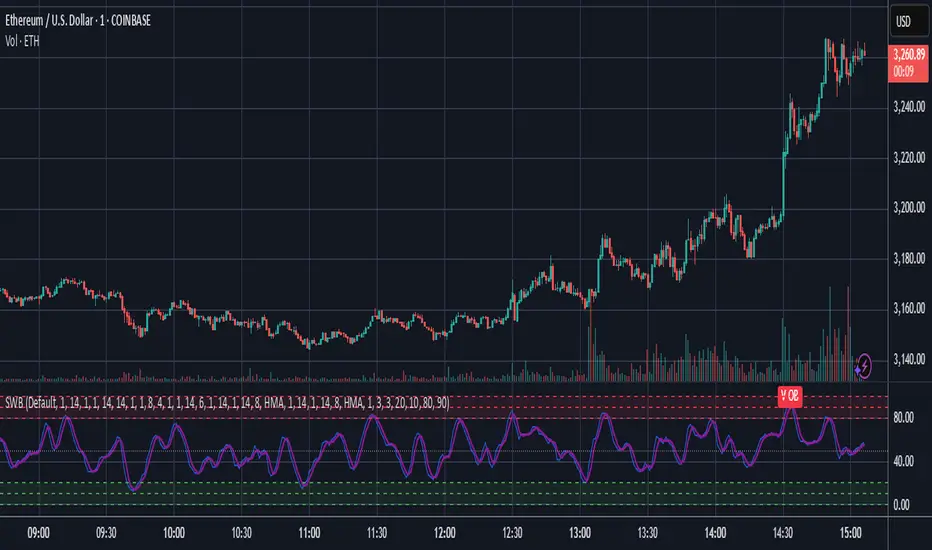
Vix FIX / Stochastic Weights StrategyThis script is based off of Chris Moody's Vix Fix Indicator modified by OskarGallard and BigBitsIO's Stochastic Weights.
This script is a compilation of several different stochastic indicators (and RSI ) where the K value of each indicator is equally weighted. The purpose of the indicator is to combine many indicators together in a fashion that weights them easier. By default, the Stochastic and Stochastic RSI are both enabled - the idea is to speed up the relatively slower Stochastic and to slow down the relatively fast Stochastic RSI . BigBitsIO's Stochastics are also available that can also be added to the weighted calculation. Only the K value is weighted, as the D value is just a moving average of the weighted K.
- Why is this modifed stochastic useful?
- To weight multiple indicators together so that you can attempt to find optimal values shared amongst the indicators. Ex: If Stochastic RSI is 100 and Stochastic is 50, K would be 75 and not particularly high. If you add in a 50 RSI , the K would be 67 in this example. If we weight indicators together that all have a high value they could potentially help find elements that align together to produce a stronger signal.
In this script we have the red "S" triangles which are Exits (overbought stochastic crosses).
Added alerts for stochastic exit signals. Alerts are Pre-Set to only Alert on Bar Close.
The "Williams Vix Fix" is one of the most reliable indicators in history for finding market bottoms. The Vix Fix is simply a code from Larry Williams creating almost identical results for creating the same ability the Vix has to all assets.
The VIX has always been much better at signaling bottoms than tops. Simple reason is when market falls retail traders panic and increase volatility , and professionals come in and capitalize on the situation. At market tops there is no one panicking... just liquidity drying up.
The FE green triangles are "Filtered Entries".
The AE green triangles are "Aggressive Filtered Entries".
Added Alerts to Williams Vix Fix (Aggressive Entry and Filtered Entry). Alerts are Pre-Set to only Alert on Bar Close.
Added "Ehlrers StochCCI" indicator of user @glaz
The Ehlrers StochCCI is a variation of Ehlers Stochastic RSI replaced with CCI.
The John Ehlers' article in August, 2006, "Modeling The Market = Building Trading Strategies," describes a process for extracting trend and cyclic elements from market data, then recombining them for trading purposes. He used the Stochastic RSI denoted the cyclic elements.
Added ability to show Dots when StochCCI Crosses.
Sell: fuchsia dots.
Buy: green dots.
Added alerts for (Buy / Sell) StochCCI. Alerts are Pre-Set to only Alert on Bar Close.
DISCLAIMER: For educational and entertainment purposes only. Nothing in this content should be interpreted as financial advice or a recommendation to buy or sell any sort of security or investment including all types of crypto. DYOR, TYOB.

SPY VXX RSI crisscross// Shows mean of SPY and VXX RSI's. While SPY and VXX often play "tag",
//crisscrossing each other, the game of tag is either 'down' or 'up'
LIME= SPY RSI
AQUA=VXX RSI
BLUE= Average of both
Gray= change of blue
The indicator: is the average above or below 50 (are we going up or down).
Reminder - its an RSI 0-100
// Useful in taking hedged positions in Volatility
//Ex. Short VXX and Long SDS
//Ex. Short XIV and Long SSO

Stochastic Weights - Basic [BigBitsIO]This script is a compilation of several different stochastic indicators (and RSI) where the K value of each indicator is equally weighted. The purpose of the indicator is to combine many indicators together in a fashion that weights them easier. By default, the Stochastic and Stochastic RSI are both enabled - the idea is to speed up the relatively slower Stochastic and to slow down the relatively fast Stochastic RSI. Other Stochastics are also available, including some of my own custom calculations that can also be added to the weighted calculation. Only the K value is weighted, as the D value is just a moving average of the weighted K.
Explained:
- Calculates enabled indicators
- Calculates the weighted value of K for enabled indicators
- Calculates a D value from the weighted K
FAQ:
- Why is this script useful?
- To weight multiple indicators together so that you can attempt to find optimal values shared amongst the indicators. Ex: If Stochastic RSI is 100 and Stochastic is 50, K would be 75 and not particularly high. If you add in a 50 RSI, the K would be 67 in this example. If we weight indicators together that all have a high value they could potentially help find elements that align together to produce a stronger signal.
DISCLAIMER: For educational and entertainment purposes only. Nothing in this content should be interpreted as financial advice or a recommendation to buy or sell any sort of security or investment including all types of crypto. DYOR, TYOB.
CCT StochRSI [LazyBear]CCT StochRSI, proposed by Steve Karnish of Cedar Creek Trading, reconfigures classic StochRSI using custom parameters and smoothing.
There are 6 types supported.
Common formula:
(rsi - lowest(rsi, x)) / (highest(rsi, y) - lowest(rsi, z)) * 100
Smoothed formula:
ema(common formula result, len)
Settings (values for x/y/z/len in the above formulae):
Type 1: RSILength=21, x=8, y=13, z=13, len=N/A
Type 2: RSILength=21, x=21, y=21, z=21, len=N/A
Type 3: RSILength=14, x=14, y=14, z=14, len=N/A
Type 4: RSILength=21, x=13, y=8, z=13, len=8
Type 5: RSILength=5, x=5, y=5, z=5, len=3
Type 6: RSILength=13, x=13, y=13, z=13, len=3
Apart from these default types, this also supports user-specified custom type (select "0" for "Type" option).
All 6 types:
CCT StochRSI compared against normal StochRSI:
List of my public indicators: bit.ly
List of my app-store indicators: blog.tradingview.com

Green Arrow Signal: Close > EMA9 and EMA9 of RSI123 > 100Plot a green arrow below the bar when:
Close price > EMA9
EMA9 of RSI(123) > 100

MFI v1.0 Normal and Dinamic (Totals)The normal MFI script use an RSI in the formula so the quantity of movments are not visible, this script allows you to see how much volume is being trade at the moment, so you can detect unusual levels, but you will no be allowed to see the RSI (0-100)* so I suggest to use this script with a normal MFI
Features:
+ Normal MFI length (14)
+ Green bars show the total of money trade of the bars that are going up
+ Red bars show the total of money trade when of the bars that are going down
+ Dinamic calculation (Optional)(Bellow)
Normal MFI use hlc3 ((high+low+close)/3) * (volume) to calculate each bar
The dinamic MFI: (This is an optional feature, if you dont active it you will use the normal MFI calculation)
(The information bellow is experimental and theorical only, you can use it or not in the script with the Dinamic option)
Dinamic MFI divides the bar and volume in three parts.
Volume is corresponding on each part ex. If the bar has not a top or lower wick the 100% of volume is in the middle... ex 2 If the 50% of the bar is a top wick, the 50% of volume is in the top wick
Top wick: Is calculated this way
If the bar is red (high-open)*volume of top wick
or
If the bar is green (high-close)*volume of top wick
Middle: Is calculated this way
If the bar is green (close-open)*volumemiddle
or
If the bar is red (open-close)*volumemiddle
Lower wick
If the bar is red (close-low)*volume of lower wick
or
If the bar is green (open- low)*volume of lower wick
