B A N K $ - Advanced Session RangesThis is a simple indicator that has been designed to aid intraday trading and has a few components;
Key Features
Session Ranges + Optimal Exit Time
Asia Pip Range
New York Midnight Open Line
Session Ranges + Optimal Exit Time
Information ℹ️
This is a visual depiction of the 3 main sessions in the markets. Asia, London & New York. The default timings are set to perfectly align with each session however the Start & End times for each session can be changed in the settings. (I've added a website on the tooltip to easily convert timezones)
I have also added a 4th session range called "Optimal Exit Time". This is statistically the most probable time window for the opposite High / Low of Day to form is within this window. It helps the trader understand when they should look to take profit.
How It Works 🔑
The indicator automatically maps on two lines for the High & Low of the range between the selected Start & End time, it also colours the background.
The individual lines & background can be toggled & customised to the traders preference.
Asia Pip Range
Information ℹ️
This displays the Asia Range in pips beneath the Asia Session Low.
How It Works 🔑
This calculates the distance between the Asia High - Asia Low in pips. It will automatically recalibrate to the timings the trader sets in the settings if they change the Start / End.
New York Midnight Open Line
Information ℹ️
This helps look for Buys beneath the line for a Bullish Expansion day 📈 & Sells above the line for a Bearish Expansion day 📉
How It Works 🔑
This adds a horizontal line to the chart that is anchored to New York Midnight Open (00:00) by default. It can be changed in the settings in required. You can also toggle on the time being shown above the line.
Cari dalam skrip untuk "如何用wind搜索股票的发行价和份数"

Price and Volume Breakout Buy Strategy [TradeDots]The "Price and Volume Breakout Buy Strategy" is a trading strategy designed to identify buying opportunities by detecting concurrent price and volume breakouts over a specified range of candlesticks.
This strategy is optimized for assets demonstrating high volatility and significant momentum spikes.
HOW IT WORKS
The strategy first takes the specific number of candlesticks as the examination window for both price and volume.
These values are used as benchmarks to identify breakout conditions.
A trade is initiated when both the closing price and the trading volume surpass the maximum values observed within the predetermined window.
Price must be above a designated moving average, serving as the trend indicator, ensuring that all trades align with the prevailing market trend.
APPLICATION
This strategy is particularly effective for highly volatile assets such as Bitcoin and Ethereum, capitalizing on the cues from sudden price and volume breakouts indicative of significant market movement, often driven by market smart money traders.
However, for broader markets like the S&P 500, this strategy may be less effective due to less pronounced volume and price shifts compared to the cryptocurrency markets.
DEFAULT SETUP
Commission: 0.01%
Initial Capital: $10,000
Equity per Trade: 70%
Backtest result sometimes gives fewer than 100 trades under certain higher timeframes, as most trades tend to have a long holding period. Entry conditions are also more stringent, which, combined with the relatively brief history of cryptocurrencies, results in fewer trades on longer timeframes.
Users are advised to adjust and personalize this trading strategy to better match their individual trading preferences and style.
RISK DISCLAIMER
Trading entails substantial risk, and most day traders incur losses. All content, tools, scripts, articles, and education provided by TradeDots serve purely informational and educational purposes. Past performances are not definitive predictors of future results.

dashboard MTF,EMA User Guide: Dashboard MTF EMA
Script Installation:
Copy the script code.
Go to the script window (Pine Editor) on TradingView.
Paste the code into the script window.
Save the script.
Adding the Script to the Chart:
Return to your chart on TradingView.
Look for the script in the list of available scripts.
Add the script to the chart.
Interpreting the Table:
On the right side of the chart, you will see a table labeled "EMA" with arrows.
The rows correspond to different timeframes: 5 minutes (5M), 15 minutes (15M), 1 hour (1H), 4 hours (4H), and 1 day (1D).
Understanding the Arrows:
Each row of the table has two columns: "EMA" and an arrow.
"EMA" indicates the trend of the Exponential Moving Average (EMA) for the specified period.
The arrow indicates the direction of the trend: ▲ for bullish, ▼ for bearish.
Table Colors:
The colors of the table reflect the current trend based on the comparison between fast and slow EMAs.
Blue (▲) indicates a bullish trend.
Red (▼) indicates a bearish trend.
Table Theme:
The table has a dark (Dark) or light (Light) theme according to your preference.
The background, frame, and colors are adjusted based on the selected theme.
Usage:
Use the table as a quick indicator of trends on different timeframes.
The arrows help you quickly identify trends without navigating between different time units.
Designed to simplify analysis and avoid cluttering the chart with multiple indicators.

Captain Backtest Model [TFO]Created by @imjesstwoone and @mickey1984, this trade model attempts to capture the expansion from the 10:00-14:00 EST 4h candle using just 3 simple steps. All of the information presented in this description has been outlined by its creators, all I did was translate it to Pine Script. All core settings of the trade model may be edited so that users can test several variations, however this description will cover its default, intended behavior using NQ 5m as an example.
Step 1 is to identify our Price Range. In this case, we are concerned with the highest high and the lowest low created from 6:00-10:00 EST.
Step 2 is to wait for either the high or low of said range to be taken out. Whichever side gets taken first determines the long/short bias for the remainder of the Trade Window (i.e. if price takes the range high, bias is long, and vice versa). Bias must be determined by 11:15 EST, otherwise no trades will be taken. This filter is intended to weed out "choppy" trading days.
Step 3 is to wait for a retracement and enter with a close through the previous candle's high (if long biased) or low (if short biased). There are a couple toggleable criteria that we use to define a retracement; one is checking for opposite close candles that indicate a pullback; another is checking if price took the previous candle's low (if long biased) or high (if short biased).
This trade model was initially tested for index futures, particularly ES and NQ, using a 5m chart, however this indicator allows us to backtest any symbol on any timeframe. Creators @imjesstwoone and @mickey1984 specified a 5 point stop loss on ES and a 25 point stop loss on NQ with their testing.
I've personally found some success in backtesting NQ 5m using a 25 point stop loss and 75 point profit target (3:1 R). Enabling the Use Fixed R:R parameter will ensure that these stops and targets are utilized, otherwise it will enter and hold the position until the close of the Trade Window.

Dual_MACD_trendingINFO:
This indicator is useful for trending assets, as my preference is for low-frequency trading, thus using BTCUSD on 1D/1W chart
In the current implementation I find two possible use cases for the indicator:
- as a stand-alone indicator on the chart which can also fire alerts that can help to determine if we want to manually enter/exit trades based on the signals from it (1D/1W is good for non-automated trading)
- can be used to connect to the Signal input of the TTS (TempalteTradingStrategy) by jason5480 in order to backtest it, thus effectively turning it into a strategy (instructions below in TTS CONNECTIVITY section)
Trading period can be selected from the indicator itself to limit to more interesting periods.
Arrow indications are drawn on the chart to indicate the trading conditions met in the script - light green for HTF crossover, dark green for LTF crossover and orange for LTF crossunder.
Note that the indicator performs best in trending assets and markets, and it is advisable to use additional indicators to filter the trading conditions when market/asset is expected to move sideways.
DETAILS:
It uses a couple of MACD indicators - one from the current timeframe and one from a higher timeframe, as the crossover/crossunder cases of the MACD line and the signal line indicate the potential entry/exit points.
The strategy has the following flow:
- If the weekly MACD is positive (MACD line is over the signal line) we have a trading window.
- If we have a trading window, we buy when the daily macd line crosses AND closes above the signal line.
- If we are in a position, we await the daily MACD to cross AND close under the signal line, and only then place a stop loss under the wick of that closing candle.
The user can select both the higher (HTF) and lower (LTF) timeframes. Preferably the lower timeframe should be the one that the Chart is on for better visualization.
If one to decide to use the indicator as a strategy, it implements the following buy and sell criterias, which are feed to the TTS, but can be also manually managed via adding alerts from this indicator.
Since usually the LTF is preceeding the crossover compared to the HTF, then my interpretation of the strategy and flow that it follows is allowing two different ways to enter a trade:
- crossover (and bar close) of the macd over the signal line in the HIGH TIMEFRAME (no need to look at the LOWER TIMEFRMAE)
- crossover (and bar close) of the macd over the signal line in the LOW TIMEFRAME, as in this case we need to check also that the macd line is over the signal line for the HIGH TIMEFRAME as well (like a regime filter)
The exit of the trade is based on the lower timeframe MACD only, as we create a stop loss equal to the lower wick of the bar, once the macd line crosses below the signal line on that timeframe
SETTINGS:
All of the indicator's settings are for the vanilla/general case.
User can set all of the MACD parameters for both the higher and lower (current) timeframes, currently left to default of the MACD stand-alone indicator itself.
The start-end date is a time filter that can be extermely usefull when backtesting different time periods.
TTS SETTINGS (NEEDED IF USED TO BACKTEST WITH TTS)
The TempalteTradingStrategy is a strategy script developed in Pine by jason5480, which I recommend for quick turn-around of testing different ideas on a proven and tested framework
I cannot give enough credit to the developer for the efforts put in building of the infrastructure, so I advice everyone that wants to use it first to get familiar with the concept and by checking
by checking jason5480's profile www.tradingview.com
The TTS itself is extremely functional and have a lot of properties, so its functionality is beyond the scope of the current script -
Again, I strongly recommend to be thoroughly epxlored by everyone that plans on using it.
In the nutshell it is a script that can be feed with buy/sell signals from an external indicator script and based on many configuration options it can determine how to execute the trades.
The TTS has many settings that can be applied, so below I will cover only the ones that differ from the default ones, at least according to my testing - do your own research, you may find something even better :)
The current/latest version that I've been using as of writing and testing this script is TTSv48
Settings which differ from the default ones:
- from - False (time filter is from the indicator script itself)
- Deal Conditions Mode - External (take enter/exit conditions from an external script)
- 🔌Signal 🛈➡ - Dual_MACD: 🔌Signal to TTSv48 (this is the output from the indicator script, according to the TTS convention)
- Sat/Sun - true (for crypto, in order to trade 24/7)
- Order Type - STOP (perform stop order)
- Distance Method - HHLL (HigherHighLowerLow - in order to set the SL according to the strategy definition from above)
The next are just personal preferenes, you can feel free to experiment according to your trading style
- Take Profit Targets - 0 (either 100% in or out, no incremental stepping in or out of positions)
- Dist Mul|Len Long/Short- 10 (make sure that we don't close on profitable trades by any reason)
- Quantity Method - EQUITY (personal backtesting preference is to consider each backtest as a separate portfolio, so determine the position size by 100% of the allocated equity size)
- Equity % - 100 (note above)
EXAMPLES:
If used as a stand-alone indicator, the green arrows on the bottom will represent:
- light green - MACD line crossover signal line in the HTF
- darker green - MACD line crossover signal line in the LTF
- orange - MACD line crossunder signal line in the LTF
I recommend enabling the alerts from the script to cover those cases.
If used as an input to the TTS, we'll get more decorations on the chart from the TTS itself.
In the example below we open a trade on the next day of LTF crossover, then a few days later a crossunder in the LTF occurs, so we set a SL at the low of the wick of this day. Few days later the price doesn't recover and hits that SL, so the position is closed.

ICT Silver Bullet with signals
The "ICT Silver Bullet with signals" indicator (inspired from the lectures of "The Inner Circle Trader" (ICT)),
goes a step further than the ICT Silver Bullet publication, which I made for LuxAlgo :
• uses HTF candles
• instant drawing of Support & Resistance (S/R) lines when price retraces into FVG
• NWOG - NDOG S/R lines
• signals
The Silver Bullet (SB) window which is a specific 1-hour interval where a Fair Value Gap (FVG) pattern can be formed.
When price goes back to the FVG, without breaking it, Support & Resistance lines will be drawn immediately.
There are 3 different Silver Bullet windows (New York local time):
The London Open Silver Bullet (03 AM — 04 AM ~ 03:00 — 04:00)
The AM Session Silver Bullet (10 AM — 11 AM ~ 10:00 — 11:00)
The PM Session Silver Bullet (02 PM — 03 PM ~ 14:00 — 15:00)
🔶 USAGE
This technique can visualise potential support/resistance lines, which can be used as targets.
The script contains 2 main components:
• forming of a Fair Value Gap (FVG)
• drawing support/resistance (S/R) lines
🔹 Forming of FVG
When HTF candles forms an FVG, the FVG will be drawn at the end (close) of the last HTF candle.
To make it easier to visualise the 2 HTF candles that form the FVG, you can enable
• SHOW -> HTF candles
During the SB session, when a FVG is broken, the FVG will be removed, together with its S/R lines.
The same goes if price did not retrace into FVG at the last bar of the SB session
Only exception is when "Remove broken FVG's" is disabled.
In this case a FVG can be broken, as long as price bounces back before the end of the SB session, it will remain to be visible:
🔹 Drawing support/resistance lines
S/R target lines are drawn immediately when price retraces into the FVG.
They will remain updated until they are broken (target hit)
Potential S/R lines are formed by:
• previous swings (swing settings (left-right)
• New Week Opening Gap (NWOG): close on Friday - weekly open
• New Day Opening Gap (NWOG): close previous day - current daily open
Only non-broken lines are included.
Broken =
• minimum of open and close below potential S/R line
• maximum of open and close above potential S/R line
NDOG lines are coloured fuchsia (as in the ICT lectures), NWOG are coloured white (darkmode) or black (lightmode ~ ICT lectures)
Swing line colour can be set as desired.
Here S/R includes NDOG lines:
The same situation, with "Extend Target-lines to their source" enabled:
Here with NWOG lines:
This publication contains a "Minimum Trade Framework (mTFW)", which represents the best-case expected price delivery, this is not your actual trade entry - exit range.
• 40 ticks for index futures or indices
• 15 pips for Forex pairs
The minimum distance (if applicable) can be shown by enabling "Show" - "Minimum Trade Framework" -> blue arrow from close to mTFW
Potential S/R lines needs to be higher (bullish) or lower (bearish) than mTFW.
🔶 SETTINGS
(check USAGE for deeper insights and explanation)
🔹 Only last x bars: when enabled, the script will do most of the calculations at these last x candles, potentially this can speeds calculations.
🔹 Swing settings (left-right): Sets the length, which will set the lookback period/sensitivity of the ZigZag patterns (which directs the trend and points for S/R lines)
🔹 FVG
HTF (minutes): 1-15 minutes.
• When the chart TF is equal of higher, calculations are based on current TF.
• Chart TF > 15 minutes will give the warning: "Please use a timeframe <= 15 minutes".
Remove broken FVG's: when enabled the script will remove FVG (+ associated S/R lines) immediately when FVG is broken at opposite direction.
FVG's still will be automatically removed at the end of the SB session, when there is no retrace, together with associated S/R lines,...
~ trend: Only include FVG in the same direction as the current trend
Note -> when set 'right' (swing setting) rather high ( > 3), he trend change will be delayed as well (default 'right' max 5)
Extend: extend FVG to max right side of SB session
🔹 Targets – support/resistance
Extend Target-lines to their source: extend lines to their origin
Colours (Swing S/R lines)
🔹 Show
SB session: show lines and labels of SB session (+ colour)
• Labels can be disabled separately in the 'Style' section, colour is set at the 'Inputs' section
Trend : Show trend (ZigZag, coloured ~ trend)
HTF candles: Show the 2 HTF candles that form the FVG
Minimum Trade Framework: blue arrow (if applicable)
🔶 ALERTS
There are 4 signals provided (bullish/bearish):
FVG Formed
FVG Retrace
Target reached
FVG cancelled
You can choose between dynamic alerts - only 1 alert needs to be set for all signals, or you can set specific alerts as desired.
💜 PURPLE BARS 😈
• Since TradingView has chosen to give away our precious Purple coloured Wizard Badge, bars are coloured purple 😊😉

Adjustable Bull Bear Candle Indicator (V1.2)Indicator Description: Adjustable Bull Bear Candle Indicator
This indicator, named "Adjustable Bull Bear Candle Indicator ," is designed to assist traders in identifying potential bullish and bearish signals within price charts. It combines candlestick pattern analysis, moving average crossovers, and RSI (Relative Strength Index) conditions to offer insights into potential trading opportunities.
Disclaimer:
Trading involves substantial risk and is not suitable for every investor. This indicator is a tool designed to aid in technical analysis, but it does not guarantee successful trades. Always exercise your own judgment and seek professional advice before making any trading decisions.
Key Features:
Preceding Candles Analysis:
The indicator examines the behavior of the previous 'n' candles to identify specific patterns that indicate bearish or bullish momentum.
Candlestick Pattern and Momentum:
It considers the relationship between the opening and closing prices of the current candle to determine if it's bullish or bearish. The indicator then assesses the absolute price difference and compares it to the cumulative absolute differences of preceding candles.
Moving Averages:
The indicator calculates two Simple Moving Averages (SMAs) – Close SMA and Far SMA – to help identify trends and crossovers in price movement.
Relative Strength Index (RSI):
RSI is used as an additional measure to gauge momentum. It analyzes the current price's magnitude of recent gains and losses and compares it to past data.
Time Constraint:
If enabled, the indicator operates within a specific time window defined by the user. This feature can help traders focus on specific market hours.
Customizable Alerts:
The indicator includes an alert system that can be enabled or disabled. You can also adjust the specific alert conditions to align with your trading strategy.
How to Use:
This indicator generates buy signals when specific conditions are met, including a bullish candlestick pattern, positive price difference, closing price above the SMAs, RSI above a threshold, preceding bearish candles, and optionally within a specified time window. Conversely, short signals are generated under conditions opposite to those of the buy signal.
Disclosure and Risk Warning:
Educational Tool: This indicator is meant for educational purposes and to aid traders in their technical analysis. It's not a trading strategy in itself.
Risk of Loss: Trading carries inherent risks, including the potential for substantial loss. Always manage risk and consider using proper risk management techniques.
Diversification: Do not rely solely on this indicator. A well-rounded trading approach includes fundamental analysis, risk management, and proper diversification.
Consultation: It's strongly advised to consult with a financial professional before making any trading decisions.
Conclusion:
The "Bullish Candle after Bearish Candles with Momentum Indicator" can be a valuable tool in your technical analysis toolkit. However, successful trading requires a deep understanding of market dynamics, risk management, and continual learning. Use this indicator in conjunction with other tools and strategies to enhance your trading decisions.
Remember that past performance is not indicative of future results. Always be cautious and informed when participating in the financial markets.

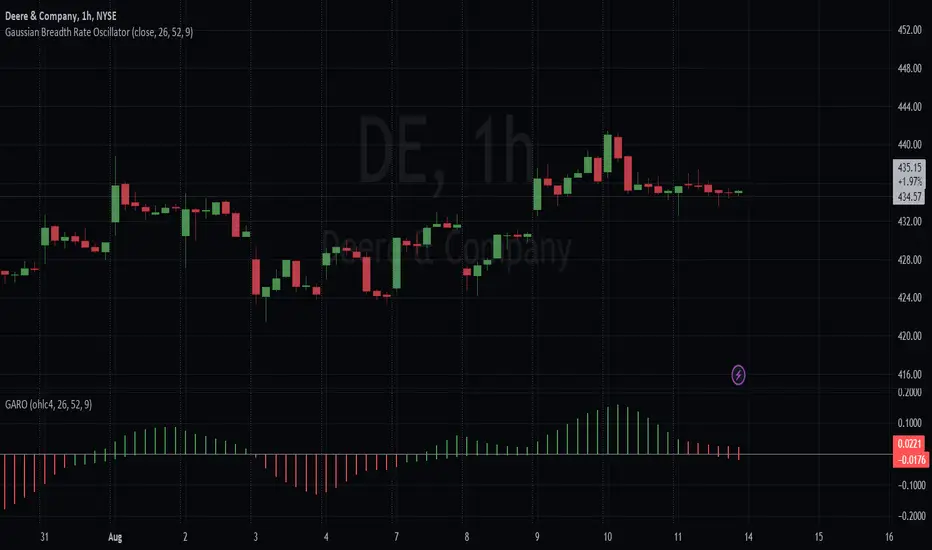
Gaussian Average Rate Oscillator
Within the ALMA calculation, the Gaussian function is applied to each price data point within the specified window. The idea is to give more weight to data points that are closer to the center and reduce the weight for points that are farther away.
The strategy calculates and compares two different Rate of Change (ROC) indicators: one based on the Arnaud Legoux Moving Average (ALMA) and the other based on a smoothed Exponential Moving Average (EMA). The primary goal of this strategy is to identify potential buy and sell signals based on the relationship between these ROC indicators.
Here's how the strategy logic works
Calculating the ROC Indicators:
The script first calculates the ROC (Rate of Change) of the smoothed ALMA and the smoothed EMA. The smoothed ALMA is calculated using a specified window size and is then smoothed further with a specified smoothing period. The smoothed EMA is calculated using a specified EMA length and is also smoothed with the same smoothing period.
Comparing ROCs:
The script compares the calculated ROC values of the smoothed ALMA and smoothed EMA.
The color of the histogram bars representing the ROC of the smoothed ALMA depends on its relationship with the ROC of the smoothed EMA. Green indicates that the ROC of ALMA is higher, red indicates that it's lower, and black indicates equality.
Similarly, the color of the histogram bars representing the ROC of the smoothed EMA is determined based on its relationship with the ROC of the smoothed ALMA, they are simply inversed so that they match.
With the default color scheme, green bars indicate the Gaussian average is outperforming the EMA within the breadth and red bars mean it's underperforming. This is regardless of the rate of average price changes.
Generating Trade Signals:
Based on the comparison of the ROC values, the strategy identifies potential crossover points and trends. Buy signals could occur when the ROC of the smoothed ALMA crosses above the ROC of the smoothed EMA. Sell signals could occur when the ROC of the smoothed ALMA crosses below the ROC of the smoothed EMA.
Additional Information:
The script also plots a zero rate line at the zero level to provide a reference point for interpreting the ROC values.
In summary, the strategy attempts to capture potential buy and sell signals by analyzing the relationships between the ROC values of the smoothed ALMA and the smoothed EMA. These signals can provide insights into potential trends and momentum shifts in the price data.
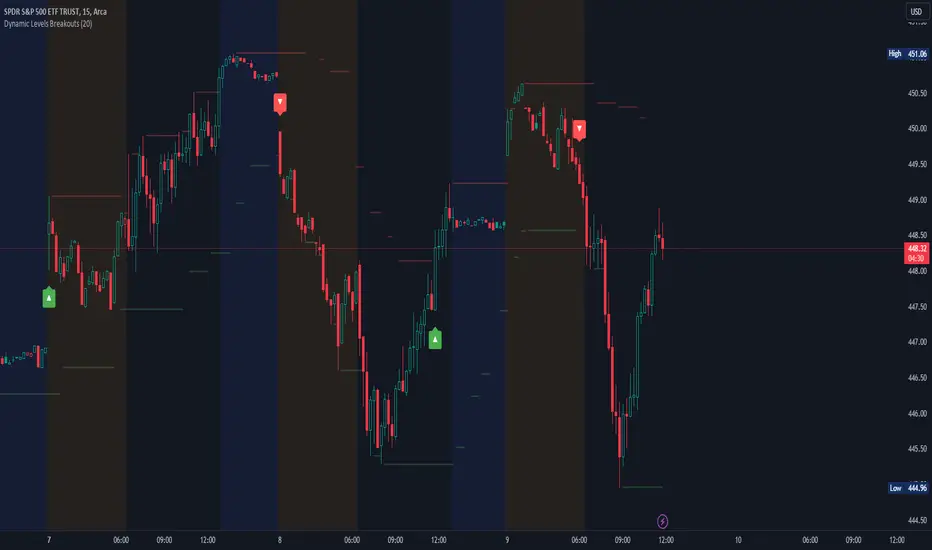
Dynamic Levels Breakouts [Angel Algo]INTRODUCTION
The Dynamic Levels Breakouts indicator is a powerful tool designed to identify dynamic support and resistance levels in the price action. It plots these levels on the chart and provides visual signals for bullish and bearish breakouts.
FEATURES
1. Dynamic Support and Resistance Levels.
The indicator calculates the maximum (resistance) and minimum (support) price levels within the defined rolling window. The highest high and lowest low are used to identify dynamic resistance and support levels, respectively.
2. Coloring Conditions
The indicator uses conditional coloring to highlight potential support and resistance levels. When a significant level is detected, it will be colored with a transparent overlay. Red color indicates potential resistance (max_level), and green color indicates potential support (min_level).
3. Bullish and Bearish Breakouts
The indicator also identifies potential bullish and bearish breakouts from the dynamic levels. A bullish breakout occurs when the closing price crosses above the dynamic resistance level (max_level). A bearish breakout occurs when the closing price crosses below the dynamic support level (min_level). The breakout signals are marked with arrow symbols (▲ for bullish and ▼ for bearish) below and above the respective bars.
4. Market Regime
To prevent multiple signals within a short period, the indicator considers the current market regime. If a bullish breakout has occurred recently, it will not generate a new bullish signal until a bearish breakout occurs, and vice versa.
HOW TO USE
The Dynamic Levels Breakouts indicator can be used to identify potential breakout trading opportunities. A bullish breakout signal (▲) suggests a potential long entry or an increase in buying pressure. A bearish breakout signal (▼) indicates a potential short entry or an increase in selling pressure. Traders can use these signals as a reference and combine them with other technical analysis tools and strategies for confirmation.
SETTINGS
Period (length): The user can adjust the "Period" input to define the rolling window for calculating the maximum and minimum price levels. The default value is 20, but it can be set anywhere between 2 and 30. A higher value may yield more significant levels but can also result in delayed signals
Ema Short Long Indicator[CHE]█ CONCEPTS
This Pine Script is an EMA Short Long indicator that displays the crossing EMA lines on the chart. The indicator uses three exponential moving averages (EMAs) to generate the buy and sell signals. The EMA lines are plotted as green (uptrend) and red (downtrend) lines. When the green line is above the white signal line, the indicator generates a buy signal, when the green line is below the white signal line, the indicator generates a sell signal. Arrows are also displayed marking the buy and sell signals. There is also an option to allow indicator repainting or not. Finally, users can also set alerts to be alerted to potential trading opportunities.
Note: please do not disable "time frame gaps". Allows to calculate the indicator on a Timeframe (TF) different from that of the chart Time window. The TF should ideally be higher than the charts to provide a broader perspective than
the TF of the chart. Using TFs lower than the chart's will deliver fragmentary results, since only the last value of intrabar is displayed (multiple values cannot be displayed for a single chart bar). The Gaps setting determines the behavior when the TF is higher than the TF of the chart. If 'gaps' is checked, higher TF values only come in and are interconnected on the diagram when the higher TF completed. This has the advantage of avoidance Real-time epainting. If Gaps is not enabled, Gaps are filled with the last higher TF value calculated, which will not produce a repaint Values on historical bars but repaint values realtime.
█ HOW TO USE IT
Load the indicator on an active chart (see the Help Center if you don't know how).
Time period
By default, the script uses an auto-stepping mechanism to adjust the time period of its moving window to the chart's timeframe. The following table shows chart timeframes and the corresponding time period used by the script. When the chart's timeframe is less than or equal to the timeframe in the first column, the second column's time period is used to calculate the Ema Short Long Indicator :
Chart Time
timeframe period
1min 🠆 1H
5min 🠆 4H
1H 🠆 1D
4H 🠆 3D
12H 🠆 1W
1D 🠆 1M
1W 🠆 3M
█ DESCRIPTION
The script begins by setting up the chart indicator with a short title, "ESLI", and enabling it as an overlay. It then initializes several variables for time conversions, to be used later in the script.
The timeStep_translate() function converts the timeframe of the chart into a string representing a larger time interval, based on the number of seconds in the timeframe. The resulting string is used to label the horizontal axis of the chart.
Next, the script defines several input variables that can be modified by the user. These include the colors of the EMA lines and the signals, whether or not the indicator is allowed to repaint (i.e. update past values based on future data), and the number of periods used to calculate the EMA and signal lines.
The f_security() function calls the request.security() function to fetch data from the specified security and timeframe, and is used to calculate the EMA and signal lines using the ta.ema() function. The clo variable is assigned the closing price data, adjusted for repainting and timeframe.
The EMA line is calculated using a weighted average of the EMA over the specified period and two times that period, as well as three times that period, divided by six. The signal line is calculated as the EMA of the EMA line over the specified period.
The col_css variable sets the color of the EMA line based on whether it is currently above or below the signal line. The script then plots the EMA and signal lines, and uses the plotshape() function to indicate long and short signals based on the crossovers and crossunders of the EMA and signal lines.
Finally, the script sets up alert conditions using the alertcondition() function to notify the user when a long or short signal is generated, including information about the symbol and closing price.
█ SPECIAL THANKS
Special thanks to LOXX, I wanted to take a moment to express my gratitude for his valuable input in the EMA calculation. His insights and expertise have greatly helped me in improving my Pine Script coding skills. Thanks to his suggestion, I was able to better understand the EMA formula and implement it effectively in my script.
Your generosity in sharing your knowledge and experience is truly appreciated. It is through collaboration and exchanging ideas that we can all grow and become better in our craft.
This script provides exact signals that, with suitable additional indicators, provide very good results.
Best regards
Chervolino
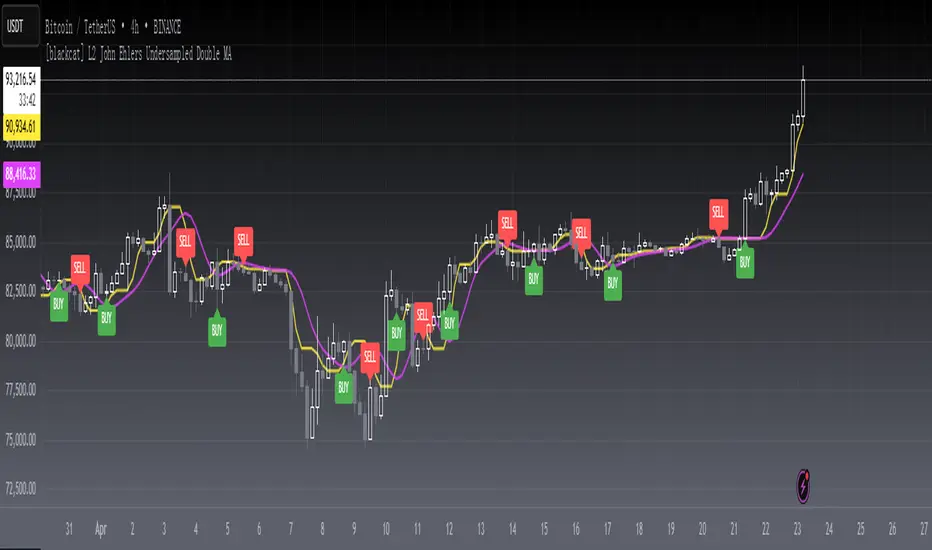
[blackcat] L2 John Ehlers Undersampled Double MALevel2
Background
This is a novel "undersampling data" processing trick proposed by John F. Ehlers in his April 2023 article "Just Ignore Them".
Function
In signal processing, undersampling, or bandpass sampling, is a technique whereby a bandpass-filtered signal is sampled at a sample rate below its Nyquist rate (twice the upper cut-off frequency), but the signal can still be reconstructed. When undersampling a bandpass signal, the samples are indistinguishable from samples of a low-frequency alias of the high-frequency signal.
John Ehlers notes that data smoothing is often used to avoid trading spikes. While this can result in fewer trading signals, it can also result in a delay in those trading signals. He describes how undersampling can be used in conjunction with Hann window finite impulse response (FIR) filters to remove high-frequency components in price data, resulting in less delay than traditional smoothing filters.
In this indicator, Hann windowing is applied a a pair of fast/slow moving averages which is used to improve their response perfomrnace. Yellow line is the fast line while fuchsia line is the slow line. You can judge bull bear stattus by checking the status it is in golden cross or in dead cross status.
Remarks
Feedbacks are appreciated.
Hurst Exponent (Dubuc's variation method)Library "Hurst"
hurst(length, samples, hi, lo)
Estimate the Hurst Exponent using Dubuc's variation method
Parameters:
length : The length of the history window to use. Large values do not cause lag.
samples : The number of scale samples to take within the window. These samples are then used for regression. The minimum value is 2 but 3+ is recommended. Large values give more accurate results but suffer from a performance penalty.
hi : The high value of the series to analyze.
lo : The low value of the series to analyze.
The Hurst Exponent is a measure of fractal dimension, and in the context of time series it may be interpreted as indicating a mean-reverting market if the value is below 0.5 or a trending market if the value is above 0.5. A value of exactly 0.5 corresponds to a random walk.
There are many definitions of fractal dimension and many methods for its estimation. Approaches relying on calculation of an area, such as the Box Counting Method, are inappropriate for time series data, because the units of the x-axis (time) do match the units of the y-axis (price). Other approaches such as Detrended Fluctuation Analysis are useful for nonstationary time series but are not exactly equivalent to the Hurst Exponent.
This library implements Dubuc's variation method for estimating the Hurst Exponent. The technique is insensitive to x-axis units and is therefore useful for time series. It will give slightly different results to DFA, and the two methods should be compared to see which estimator fits your trading objectives best.
Original Paper:
Dubuc B, Quiniou JF, Roques-Carmes C, Tricot C. Evaluating the fractal dimension of profiles. Physical Review A. 1989;39(3):1500-1512. DOI: 10.1103/PhysRevA.39.1500
Review of various Hurst Exponent estimators for time-series data, including Dubuc's method:
www.intechopen.com

Nadaraya-Watson: Envelope (Non-Repainting)Due to popular request, this is an envelope implementation of my non-repainting Nadaraya-Watson indicator using the Rational Quadratic Kernel. For more information on this implementation, please refer to the original indicator located here:
What is an Envelope?
In technical analysis, an "envelope" typically refers to a pair of upper and lower bounds that surrounds price action to help characterize extreme overbought and oversold conditions. Envelopes are often derived from a simple moving average (SMA) and are placed at a predefined distance above and below the SMA from which they were generated. However, envelopes do not necessarily need to be derived from a moving average; they can be derived from any estimator, including a kernel estimator such as Nadaraya-Watson.
How to use this indicator?
Overall, this indicator offers a high degree of flexibility, and the location of the envelope's bands can be adjusted by (1) tweaking the parameters for the Rational Quadratic Kernel and (2) adjusting the lookback window for the custom ATR calculation. In a trending market, it is often helpful to use the Nadaraya-Watson estimate line as a floating SR and/or reversal zone. In a ranging market, it is often more convenient to use the two Upper Bands and two Lower Bands as reversal zones.
How are the Upper and Lower bounds calculated?
In this indicator, the Rational Quadratic (RQ) Kernel estimates the price value at each bar in a user-defined lookback window. From this estimation, the upper and lower bounds of the envelope are calculated based on a custom ATR calculated from the kernel estimations for the high, low, and close series, respectively. These calculations are then scaled against a user-defined multiplier, which can be used to further customize the Upper and Lower bounds for a given chart.
How to use Kernel Estimations like this for other indicators?
Kernel Functions are highly underrated, and when calibrated correctly, they have the potential to provide more value than any mundane moving average. For those interested in using non-repainting Kernel Estimations for technical analysis, I have written a Kernel Functions library that makes it easy to access various well-known kernel functions quickly. The Rational Quadratic Kernel is used in this implementation, but one can conveniently swap out other kernels from the library by modifying only a single line of code. For more details and usage examples, please refer to the Kernel Functions library located here:

Oscillator Workbench — Chart [LucF]█ OVERVIEW
This indicator uses an on-chart visual framework to help traders with the interpretation of any oscillator's behavior. The advantage of using this tool is that you do not need to know all the ins and outs of a particular oscillator such as RSI, CCI, Stochastic, etc. Your choice of oscillator and settings in this indicator will change its visuals, which allows you to evaluate different configurations in the context of how the workbench models oscillator behavior. My hope is that by using the workbench, you may come up with an oscillator selection and settings that produce visual cues you find useful in your trading.
The workbench works on any symbol and timeframe. It uses the same presentation engine as my Delta Volume Channels indicator; those already familiar with it will feel right at home here.
█ CONCEPTS
Oscillators
An oscillator is any signal that moves up and down a centerline. The centerline value is often zero or 50. Because the range of oscillator values is different than that of the symbol prices we look at on our charts, it is usually impossible to display an oscillator on the chart, so we typically put oscillators in a separate pane where they live in their own space. Each oscillator has its own profile and properties that dictate its behavior and interpretation. Oscillators can be bounded , meaning their values oscillate between fixed values such as 0 to 100 or +1 to -1, or unbounded when their maximum and minimum values are undefined.
Oscillator weight
How do you display an oscillator's value on a chart showing prices when both values are not on the same scale? The method I use here converts the oscillator's value into a percentage that is used to weigh a reference line. The weight of the oscillator is calculated by maintaining its highest and lowest value above and below its centerline since the beginning of the chart's history. The oscillator's relative position in either of those spaces is then converted to a percentage, yielding a positive or negative value depending on whether the oscillator is above or below its centerline. This method works equally well with bounded and unbounded oscillators.
Oscillator Channel
The oscillator channel is the space between two moving averages: the reference line and a weighted version of that line. The reference line is a moving average of a type, source and length which you select. The weighted line uses the same settings, but it averages the oscillator-weighted price source.
The weight applied to the source of the reference line can also include the relative size of the bar's volume in relation to previous bars. The effect of this is that the oscillator's weight on bars with higher total volume will carry greater weight than those with lesser volume.
The oscillator channel can be in one of four states, each having its corresponding color:
• Bull (teal): The weighted line is above the reference line.
• Strong bull (lime): The bull condition is fulfilled and the bar's close is above the reference line and both the reference and the weighted lines are rising.
• Bear (maroon): The weighted line is below the reference line.
• Strong bear (pink): The bear condition is fulfilled and the bar's close is below the reference line and both the reference and the weighted lines are falling.
Divergences
In the context of this indicator, a divergence is any bar where the slope of the reference line does not match that of the weighted line. No directional bias is assigned to divergences when they occur. You can also choose to define divergences as differences in polarity between the oscillator's slope and the polarity of close-to-close values. This indicator's divergences are designed to identify transition levels. They have no polarity; their bullish/bearish bias is determined by the behavior of price relative to the divergence channel after the divergence channel is built.
Divergence Channel
The divergence channel is the space between two levels (by default, the bar's low and high ) saved when divergences occur. When price has breached a channel and a new divergence occurs, a new channel is created. Until that new channel is breached, bars where additional divergences occur will expand the channel's levels if the bar's price points are outside the channel.
Price breaches of the divergence channel will change its state. Divergence channels can be in one of five different states:
• Bull (teal): Price has breached the channel to the upside.
• Strong bull (lime): The bull condition is fulfilled and the oscillator channel is in the strong bull state.
• Bear (maroon): Price has breached the channel to the downside.
• Strong bear (pink): The bear condition is fulfilled and the oscillator channel is in the strong bear state.
• Neutral (gray): The channel has not been breached.
█ HOW TO USE THE INDICATOR
Load the indicator on an active chart (see here if you don't know how).
The default configuration displays:
• The Divergence channel's levels.
• Bar colors using the state of the oscillator channel.
The default settings use:
• RSI as the oscillator, using the close source and a length of 20 bars.
• An Arnaud-Legoux moving average on the close and a length of 20 bars as the reference line.
• The weighted version of the reference line uses only the oscillator's weight, i.e., without the relative volume's weight.
The weighted line is capped to three standard deviations of the reference.
• The divergence channel's levels are determined using the high and low of the bars where divergences occur.
Breaches of the channel require a bar's low to move above the top of the channel, and the bar's high to move below the channel's bottom.
No markers appear on the chart; if you want to create alerts from this script, you will need first to define the conditions that will trigger the markers, then create the alert, which will trigger on those same conditions.
To learn more about how to use this indicator, you must understand the concepts it uses and the information it displays, which requires reading this description. There are no videos to explain it.
█ FEATURES
The script's inputs are divided in five sections: "Oscillator", "Oscillator channel", "Divergence channel", "Bar Coloring" and "Marker/Alert Conditions".
Oscillator
This is where you configure the oscillator you want to study. Thirty oscillators are available to choose from, but you can also use an oscillator from another indicator that is on your chart, if you want. When you select an external indicator's plot as the oscillator, you must also specify the value of its centerline.
Oscillator Channel
Here, you control the visibility and colors of the reference line, its weighted version, and the oscillator channel between them.
You also specify what type of moving average you want to use as a reference line, its source and its length. This acts as the oscillator channel's baseline. The weighted line is also a moving average of the same type and length as the reference line, except that it will be calculated from the weighted version of the source used in the reference line. By default, the weighted line is capped to three standard deviations of the reference line. You can change that value, and also elect to cap using a multiple of ATR instead. The cap provides a mechanism to control how far the weighted line swings from the reference line. This section is also where you can enable the relative volume component of the weight.
Divergence Channel
This is where you control the appearance of the divergence channel and the key price values used in determining the channel's levels and breaching conditions. These choices have an impact on the behavior of the channel. More generous level prices like the default low and high selection will produce more conservative channels, as will the default choice for breach prices.
In this section, you can also enable a mode where an attempt is made to estimate the channel's bias before price breaches the channel. When it is enabled, successive increases/decreases of the channel's top and bottom levels are counted as new divergences occur. When one count is greater than the other, a bull/bear bias is inferred from it. You can also change the detection mode of divergences, and choose to display a mark above or below bars where divergences occur.
Bar Coloring
You specify here:
• The method used to color chart bars, if you choose to do so.
• If you want to hollow out the bodies of bars where volume has not increased since the last bar.
Marker/Alert Conditions
Here, you specify the conditions that will trigger up or down markers. The trigger conditions can include a combination of state transitions of the oscillator and the divergence channels. The triggering conditions can be filtered using a variety of conditions.
Configuring the marker conditions is necessary before creating an alert from this script, as the alert will use the marker conditions to trigger.
Realtime values will repaint, as is usually the case with oscillators, but markers only appear on bar closes, so they will not repaint. Keep in mind, when looking at markers on historical bars, that they are positioned on the bar when it closes — NOT when it opens.
Raw values
The raw values calculated by this script can be inspected using the Data Window, including the oscillator's value and the weights.
█ INTERPRETATION
Except when mentioned otherwise, this section's charts use the indicator's default settings, with different visual components turned on or off.
The aim of the oscillator channel is to provide a visual representation of an oscillator's general behavior. The simplest characteristic of the channel is its bull/bear state, determined by whether the weighted line is above or below the reference line. One can then distinguish between its bull and strong bull states, as transitions from strong bull to bull states will generally happen when trends are losing steam. While one should not infer a reversal from such transitions, they can be a good place to tighten stops. Only time will tell if a reversal will occur. One or more divergences will often occur before reversals. This shows the oscillator channel, with the reference line and the thicker, weighted line:
The nature of the divergence channel 's design makes it particularly adept at identifying consolidation areas if its settings are kept on the conservative side. The divergence channel will also reveal transition areas. A gray divergence channel should usually be considered a no-trade zone. More adventurous traders can use the oscillator channel to orient their trade entries if they accept the risk of trading in a neutral divergence channel, which by definition will not have been breached by price. This show only the divergence channels:
This chart shows divergence channels and their levels, and colors bars on divergences and on the state of the oscillator channel, which is not visible on the chart:
If your charts are already busy with other stuff you want to hold on to, you could consider using only the chart bar coloring component of this indicator. Here we only color bars using the combined state of the oscillator and divergence channel, and we do not color the bodies of bars where volume has not increased. Note that my chart's settings do not color the candle bodies:
At its simplest, one way to use this indicator would be to look for overlaps of the strong bull/bear colors in both the oscillator channel and a divergence channel, as these identify points where price is breaching the divergence channel when the oscillator's state is consistent with the direction of the breach.
Tip
One way to use the Workbench is to combine it with my Delta Volume Channels indicator. If both indicators use the same MA as a reference line, you can display its delta volume channel instead of the oscillator channel.
This chart shows such a setup. The Workbench displays its divergence levels, the weighted reference line using the default RSI oscillator, and colors bars on divergences. The DV Channels indicator only displays its delta volume channel, which uses the same MA as the workbench for its baseline. This way you can ascertain the volume delta situation in contrast with the visuals of the Workbench:
█ LIMITATIONS
• For some of the oscillators, assumptions are made concerning their different parameters when they are more complex than just a source and length.
See the `oscCalc()` function in this indicator's code for all the details, and ask me in a comment if you can't find the information you need.
• When an oscillator using volume is selected and no volume information is available for the chart's symbol, an error will occur.
• The method I use to convert an oscillator's value into a percentage is fragile in the early history of datasets
because of the nascent expression of the oscillator's range during those early bars.
█ NOTES
Working with this workbench
This indicator is called a workbench for a reason; it is designed for traders interested in exploring its behavior with different oscillators and settings, in the hope they can come up with a setup that suits their trading methodology. I cannot tell you which setup is the best because its setup should be compatible with your trading methodology, which may require faster or slower transitions, thus different configurations of the settings affecting the calculations of the divergence channels.
For Pine Script™ Coders
• This script uses the new overload of the fill() function which now makes it possible to do vertical gradients in Pine. I use it for both channels displayed by this script.
• I use the new arguments for plot() 's `display` parameter to control where the script plots some of its values,
namely those I only want to appear in the script's status line and in the Data Window.
• I used my ta library for some of the oscillator calculations and helper functions.
• I also used TradingView's ta library for other oscillator calculations.
• I wrote my script using the revised recommendations in the Style Guide from the Pine v5 User Manual.

Nadaraya-Watson: Rational Quadratic Kernel (Non-Repainting)What is Nadaraya–Watson Regression?
Nadaraya–Watson Regression is a type of Kernel Regression, which is a non-parametric method for estimating the curve of best fit for a dataset. Unlike Linear Regression or Polynomial Regression, Kernel Regression does not assume any underlying distribution of the data. For estimation, it uses a kernel function, which is a weighting function that assigns a weight to each data point based on how close it is to the current point. The computed weights are then used to calculate the weighted average of the data points.
How is this different from using a Moving Average?
A Simple Moving Average is actually a special type of Kernel Regression that uses a Uniform (Retangular) Kernel function. This means that all data points in the specified lookback window are weighted equally. In contrast, the Rational Quadratic Kernel function used in this indicator assigns a higher weight to data points that are closer to the current point. This means that the indicator will react more quickly to changes in the data.
Why use the Rational Quadratic Kernel over the Gaussian Kernel?
The Gaussian Kernel is one of the most commonly used Kernel functions and is used extensively in many Machine Learning algorithms due to its general applicability across a wide variety of datasets. The Rational Quadratic Kernel can be thought of as a Gaussian Kernel on steroids; it is equivalent to adding together many Gaussian Kernels of differing length scales. This allows the user even more freedom to tune the indicator to their specific needs.
The formula for the Rational Quadratic function is:
K(x, x') = (1 + ||x - x'||^2 / (2 * alpha * h^2))^(-alpha)
where x and x' data are points, alpha is a hyperparameter that controls the smoothness (i.e. overall "wiggle") of the curve, and h is the band length of the kernel.
Does this Indicator Repaint?
No, this indicator has been intentionally designed to NOT repaint. This means that once a bar has closed, the indicator will never change the values in its plot. This is useful for backtesting and for trading strategies that require a non-repainting indicator.
Settings:
Bandwidth. This is the number of bars that the indicator will use as a lookback window.
Relative Weighting Parameter. The alpha parameter for the Rational Quadratic Kernel function. This is a hyperparameter that controls the smoothness of the curve. A lower value of alpha will result in a smoother, more stretched-out curve, while a lower value will result in a more wiggly curve with a tighter fit to the data. As this parameter approaches 0, the longer time frames will exert more influence on the estimation, and as it approaches infinity, the curve will become identical to the one produced by the Gaussian Kernel.
Color Smoothing. Toggles the mechanism for coloring the estimation plot between rate of change and cross over modes.

Ehlers Two-Pole Predictor [Loxx]Ehlers Two-Pole Predictor is a new indicator by John Ehlers . The translation of this indicator into PineScript™ is a collaborative effort between @cheatcountry and I.
The following is an excerpt from "PREDICTION" , by John Ehlers
Niels Bohr said “Prediction is very difficult, especially if it’s about the future.”. Actually, prediction is pretty easy in the context of technical analysis . All you have to do is to assume the market will behave in the immediate future just as it has behaved in the immediate past. In this article we will explore several different techniques that put the philosophy into practice.
LINEAR EXTRAPOLATION
Linear extrapolation takes the philosophical approach quite literally. Linear extrapolation simply takes the difference of the last two bars and adds that difference to the value of the last bar to form the prediction for the next bar. The prediction is extended further into the future by taking the last predicted value as real data and repeating the process of adding the most recent difference to it. The process can be repeated over and over to extend the prediction even further.
Linear extrapolation is an FIR filter, meaning it depends only on the data input rather than on a previously computed value. Since the output of an FIR filter depends only on delayed input data, the resulting lag is somewhat like the delay of water coming out the end of a hose after it supplied at the input. Linear extrapolation has a negative group delay at the longer cycle periods of the spectrum, which means water comes out the end of the hose before it is applied at the input. Of course the analogy breaks down, but it is fun to think of it that way. As shown in Figure 1, the actual group delay varies across the spectrum. For frequency components less than .167 (i.e. a period of 6 bars) the group delay is negative, meaning the filter is predictive. However, the filter has a positive group delay for cycle components whose periods are shorter than 6 bars.
Figure 1
Here’s the practical ramification of the group delay: Suppose we are projecting the prediction 5 bars into the future. This is fine as long as the market is continued to trend up in the same direction. But, when we get a reversal, the prediction continues upward for 5 bars after the reversal. That is, the prediction fails just when you need it the most. An interesting phenomenon is that, regardless of how far the extrapolation extends into the future, the prediction will always cross the signal at the same spot along the time axis. The result is that the prediction will have an overshoot. The amplitude of the overshoot is a function of how far the extrapolation has been carried into the future.
But the overshoot gives us an opportunity to make a useful prediction at the cyclic turning point of band limited signals (i.e. oscillators having a zero mean). If we reduce the overshoot by reducing the gain of the prediction, we then also move the crossing of the prediction and the original signal into the future. Since the group delay varies across the spectrum, the effect will be less effective for the shorter cycles in the data. Nonetheless, the technique is effective for both discretionary trading and automated trading in the majority of cases.
EXPLORING THE CODE
Before we predict, we need to create a band limited indicator from which to make the prediction. I have selected a “roofing filter” consisting of a High Pass Filter followed by a Low Pass Filter. The tunable parameter of the High Pass Filter is HPPeriod. Think of it as a “stone wall filter” where cycle period components longer than HPPeriod are completely rejected and cycle period components shorter than HPPeriod are passed without attenuation. If HPPeriod is set to be a large number (e.g. 250) the indicator will tend to look more like a trending indicator. If HPPeriod is set to be a smaller number (e.g. 20) the indicator will look more like a cycling indicator. The Low Pass Filter is a Hann Windowed FIR filter whose tunable parameter is LPPeriod. Think of it as a “stone wall filter” where cycle period components shorter than LPPeriod are completely rejected and cycle period components longer than LPPeriod are passed without attenuation. The purpose of the Low Pass filter is to smooth the signal. Thus, the combination of these two filters forms a “roofing filter”, named Filt, that passes spectrum components between LPPeriod and HPPeriod.
Since working into the future is not allowed in EasyLanguage variables, we need to convert the Filt variable to the data array XX. The data array is first filled with real data out to “Length”. I selected Length = 10 simply to have a convenient starting point for the prediction. The next block of code is the prediction into the future. It is easiest to understand if we consider the case where count = 0. Then, in English, the next value of the data array is equal to the current value of the data array plus the difference between the current value and the previous value. That makes the prediction one bar into the future. The process is repeated for each value of count until predictions up to 10 bars in the future are contained in the data array. Next, the selected prediction is converted from the data array to the variable “Prediction”. Filt is plotted in Red and Prediction is plotted in yellow.
The Predict Extrapolation indicator is shown below for the Emini S&P Futures contract using the default input parameters. Filt is plotted in red and Predict is plotted in yellow. The crossings of the Predict and Filt lines provide reliable buy and sell timing signals. There is some overshoot for the shorter cycle periods, for example in February and March 2021, but the only effect is a late timing signal. Further reducing the gain and/or reducing the BarsFwd inputs would provide better timing signals during this period.
Figure 2. Predict Extrapolation Provides Reliable Timing Signals
I have experimented with other FIR filters for predictions, but found none that had a significant advantage over linear extrapolation.
MESA
MESA is an acronym for Maximum Entropy Spectral Analysis. Conceptually, it removes spectral components until the residual is left with maximum entropy. It does this by forming an all-pole filter whose order is determined by the selected number of coefficients. It maximally addresses the data within the selected window and ignores all other data. Its resolution is determined only by the number of filter coefficients selected. Since the resulting filter is an IIR filter, a prediction can be formed simply by convolving the filter coefficients with the data. MESA is one of the few, if not the only way to practically determine the coefficients of a higher order IIR filter. Discussion of MESA is beyond the scope of this article.
TWO POLE IIR FILTER
While the coefficients of a higher order IIR filter are difficult to compute without MESA, it is a relatively simple matter to compute the coefficients of a two pole IIR filter.
(Skip this paragraph if you don’t care about DSP) We can locate the conjugate pole positions parametrically in the Z plane in polar coordinates. Let the radius be QQ and the principal angle be 360 / P2Period. The first order component is 2*QQ*Cosine(360 / P2Period) and the second order component is just QQ2. Therefore, the transfer response becomes:
H(z) = 1 / (1 - 2*QQ*Cosine(360 / P2Period)*Z-1 + QQ2*Z-2)
By mixing notation we can easily convert the transfer response to code.
Output / Input = 1 / (1 - 2*QQ*Cosine(360 / P2Period)* + QQ2* )
Output - 2*QQ*Cosine(360 / P2Period)*Output + QQ2*Output = Input
Output = Input + 2*QQ*Cosine(360 / P2Period)*Output - QQ2*Output
The Two Pole Predictor starts by computing the same “roofing filter” design as described for the Linear Extrapolation Predictor. The HPPeriod and LPPeriod inputs adjust the roofing filter to obtain the desired appearance of an indicator. Since EasyLanguage variables cannot be extended into the future, the prediction process starts by loading the XX data array with indicator data up to the value of Length. I selected Length = 10 simply to have a convenient place from which to start the prediction. The coefficients are computed parametrically from the conjugate pole positions and are normalized to their sum so the IIR filter will have unity gain at zero frequency.
The prediction is formed by convolving the IIR filter coefficients with the historical data. It is easiest to see for the case where count = 0. This is the initial prediction. In this case the new value of the XX array is formed by successively summing the product of each filter coefficient with its respective historical data sample. This process is significantly different from linear extrapolation because second order curvature is introduced into the prediction rather than being strictly linear. Further, the prediction is adaptive to market conditions because the degree of curvature depends on recent historical data. The prediction in the data array is converted to a variable by selecting the BarsFwd value. The prediction is then plotted in yellow, and is compared to the indicator plotted in red.
The Predict 2 Pole indicator is shown above being applied to the Emini S&P Futures contract for most of 2021. The default parameters for the roofing filter and predictor were used. By comparison to the Linear Extrapolation prediction of Figure 2, the Predict 2 Pole indicator has a more consistent prediction. For example, there is little or no overshoot in February or March while still giving good predictions in April and May.
Input parameters can be varied to adjust the appearance of the prediction. You will find that the indicator is relatively insensitive to the BarsFwd input. The P2Period parameter primarily controls the gain of the prediction and the QQ parameter primarily controls the amount of prediction lead during trending sections of the indicator.
TAKEAWAYS
1. A more or less universal band limited “roofing filter” indicator was used to demonstrate the predictors. The HPPeriod input parameter is used to control whether the indicator looks more like a trend indicator or more like a cycle indicator. The LPPeriod input parameter is used to control the smoothness of the indicator.
2. A linear extrapolation predictor is formed by adding the difference of the two most recent data bars to the value of the last data bar. The result is considered to be a real data point and the process is repeated to extend the prediction into the future. This is an FIR filter having a one bar negative group delay at zero frequency, but the group delay is not constant across the spectrum. This variable group delay causes the linear extrapolation prediction to be inconsistent across a range of market conditions.
3. The degree of prediction by linear extrapolation can be controlled by varying the gain of the prediction to reduce the overshoot to be about the same amplitude as the peak swing of the indicator.
4. I was unable to experimentally derive a higher order FIR filter predictor that had advantages over the simple linear extrapolation predictor.
5. A Two Pole IIR predictor can be created by parametrically locating the conjugate pole positions.
6. The Two Pole predictor is a second order filter, which allows curvature into the prediction, thus mitigating overshoot. Further, the curvature is adaptive because the prediction depends on previously computed prediction values.
7. The Two Pole predictor is more consistent over a range of market conditions.
ADDITIONS
Loxx's Expanded source types:
Library for expanded source types:
Explanation for expanded source types:
Three different signal types: 1) Prediction/Filter crosses; 2) Prediction middle crosses; and, 3) Filter middle crosses.
Bar coloring to color trend.
Signals, both Long and Short.
Alerts, both Long and Short.

Normalized, Variety, Fast Fourier Transform Explorer [Loxx]Normalized, Variety, Fast Fourier Transform Explorer demonstrates Real, Cosine, and Sine Fast Fourier Transform algorithms. This indicator can be used as a rule of thumb but shouldn't be used in trading.
What is the Discrete Fourier Transform?
In mathematics, the discrete Fourier transform (DFT) converts a finite sequence of equally-spaced samples of a function into a same-length sequence of equally-spaced samples of the discrete-time Fourier transform (DTFT), which is a complex-valued function of frequency. The interval at which the DTFT is sampled is the reciprocal of the duration of the input sequence. An inverse DFT is a Fourier series, using the DTFT samples as coefficients of complex sinusoids at the corresponding DTFT frequencies. It has the same sample-values as the original input sequence. The DFT is therefore said to be a frequency domain representation of the original input sequence. If the original sequence spans all the non-zero values of a function, its DTFT is continuous (and periodic), and the DFT provides discrete samples of one cycle. If the original sequence is one cycle of a periodic function, the DFT provides all the non-zero values of one DTFT cycle.
What is the Complex Fast Fourier Transform?
The complex Fast Fourier Transform algorithm transforms N real or complex numbers into another N complex numbers. The complex FFT transforms a real or complex signal x in the time domain into a complex two-sided spectrum X in the frequency domain. You must remember that zero frequency corresponds to n = 0, positive frequencies 0 < f < f_c correspond to values 1 ≤ n ≤ N/2 −1, while negative frequencies −fc < f < 0 correspond to N/2 +1 ≤ n ≤ N −1. The value n = N/2 corresponds to both f = f_c and f = −f_c. f_c is the critical or Nyquist frequency with f_c = 1/(2*T) or half the sampling frequency. The first harmonic X corresponds to the frequency 1/(N*T).
The complex FFT requires the list of values (resolution, or N) to be a power 2. If the input size if not a power of 2, then the input data will be padded with zeros to fit the size of the closest power of 2 upward.
What is Real-Fast Fourier Transform?
Has conditions similar to the complex Fast Fourier Transform value, except that the input data must be purely real. If the time series data has the basic type complex64, only the real parts of the complex numbers are used for the calculation. The imaginary parts are silently discarded.
What is the Real-Fast Fourier Transform?
In many applications, the input data for the DFT are purely real, in which case the outputs satisfy the symmetry
X(N-k)=X(k)
and efficient FFT algorithms have been designed for this situation (see e.g. Sorensen, 1987). One approach consists of taking an ordinary algorithm (e.g. Cooley–Tukey) and removing the redundant parts of the computation, saving roughly a factor of two in time and memory. Alternatively, it is possible to express an even-length real-input DFT as a complex DFT of half the length (whose real and imaginary parts are the even/odd elements of the original real data), followed by O(N) post-processing operations.
It was once believed that real-input DFTs could be more efficiently computed by means of the discrete Hartley transform (DHT), but it was subsequently argued that a specialized real-input DFT algorithm (FFT) can typically be found that requires fewer operations than the corresponding DHT algorithm (FHT) for the same number of inputs. Bruun's algorithm (above) is another method that was initially proposed to take advantage of real inputs, but it has not proved popular.
There are further FFT specializations for the cases of real data that have even/odd symmetry, in which case one can gain another factor of roughly two in time and memory and the DFT becomes the discrete cosine/sine transform(s) (DCT/DST). Instead of directly modifying an FFT algorithm for these cases, DCTs/DSTs can also be computed via FFTs of real data combined with O(N) pre- and post-processing.
What is the Discrete Cosine Transform?
A discrete cosine transform ( DCT ) expresses a finite sequence of data points in terms of a sum of cosine functions oscillating at different frequencies. The DCT , first proposed by Nasir Ahmed in 1972, is a widely used transformation technique in signal processing and data compression. It is used in most digital media, including digital images (such as JPEG and HEIF, where small high-frequency components can be discarded), digital video (such as MPEG and H.26x), digital audio (such as Dolby Digital, MP3 and AAC ), digital television (such as SDTV, HDTV and VOD ), digital radio (such as AAC+ and DAB+), and speech coding (such as AAC-LD, Siren and Opus). DCTs are also important to numerous other applications in science and engineering, such as digital signal processing, telecommunication devices, reducing network bandwidth usage, and spectral methods for the numerical solution of partial differential equations.
The use of cosine rather than sine functions is critical for compression, since it turns out (as described below) that fewer cosine functions are needed to approximate a typical signal, whereas for differential equations the cosines express a particular choice of boundary conditions. In particular, a DCT is a Fourier-related transform similar to the discrete Fourier transform (DFT), but using only real numbers. The DCTs are generally related to Fourier Series coefficients of a periodically and symmetrically extended sequence whereas DFTs are related to Fourier Series coefficients of only periodically extended sequences. DCTs are equivalent to DFTs of roughly twice the length, operating on real data with even symmetry (since the Fourier transform of a real and even function is real and even), whereas in some variants the input and/or output data are shifted by half a sample. There are eight standard DCT variants, of which four are common.
The most common variant of discrete cosine transform is the type-II DCT , which is often called simply "the DCT". This was the original DCT as first proposed by Ahmed. Its inverse, the type-III DCT , is correspondingly often called simply "the inverse DCT" or "the IDCT". Two related transforms are the discrete sine transform ( DST ), which is equivalent to a DFT of real and odd functions, and the modified discrete cosine transform (MDCT), which is based on a DCT of overlapping data. Multidimensional DCTs ( MD DCTs) are developed to extend the concept of DCT to MD signals. There are several algorithms to compute MD DCT . A variety of fast algorithms have been developed to reduce the computational complexity of implementing DCT . One of these is the integer DCT (IntDCT), an integer approximation of the standard DCT ,: ix, xiii, 1, 141–304 used in several ISO /IEC and ITU-T international standards.
What is the Discrete Sine Transform?
In mathematics, the discrete sine transform (DST) is a Fourier-related transform similar to the discrete Fourier transform (DFT), but using a purely real matrix. It is equivalent to the imaginary parts of a DFT of roughly twice the length, operating on real data with odd symmetry (since the Fourier transform of a real and odd function is imaginary and odd), where in some variants the input and/or output data are shifted by half a sample.
A family of transforms composed of sine and sine hyperbolic functions exists. These transforms are made based on the natural vibration of thin square plates with different boundary conditions.
The DST is related to the discrete cosine transform (DCT), which is equivalent to a DFT of real and even functions. See the DCT article for a general discussion of how the boundary conditions relate the various DCT and DST types. Generally, the DST is derived from the DCT by replacing the Neumann condition at x=0 with a Dirichlet condition. Both the DCT and the DST were described by Nasir Ahmed T. Natarajan and K.R. Rao in 1974. The type-I DST (DST-I) was later described by Anil K. Jain in 1976, and the type-II DST (DST-II) was then described by H.B. Kekra and J.K. Solanka in 1978.
Notable settings
windowper = period for calculation, restricted to powers of 2: "16", "32", "64", "128", "256", "512", "1024", "2048", this reason for this is FFT is an algorithm that computes DFT (Discrete Fourier Transform) in a fast way, generally in 𝑂(𝑁⋅log2(𝑁)) instead of 𝑂(𝑁2). To achieve this the input matrix has to be a power of 2 but many FFT algorithm can handle any size of input since the matrix can be zero-padded. For our purposes here, we stick to powers of 2 to keep this fast and neat. read more about this here: Cooley–Tukey FFT algorithm
SS = smoothing count, this smoothing happens after the first FCT regular pass. this zeros out frequencies from the previously calculated values above SS count. the lower this number, the smoother the output, it works opposite from other smoothing periods
Fmin1 = zeroes out frequencies not passing this test for min value
Fmax1 = zeroes out frequencies not passing this test for max value
barsback = moves the window backward
Inverse = whether or not you wish to invert the FFT after first pass calculation
Related indicators
Real-Fast Fourier Transform of Price Oscillator
STD-Stepped Fast Cosine Transform Moving Average
Real-Fast Fourier Transform of Price w/ Linear Regression
Variety RSI of Fast Discrete Cosine Transform
Additional reading
A Fast Computational Algorithm for the Discrete Cosine Transform by Chen et al.
Practical Fast 1-D DCT Algorithms With 11 Multiplications by Loeffler et al.
Cooley–Tukey FFT algorithm
Ahmed, Nasir (January 1991). "How I Came Up With the Discrete Cosine Transform". Digital Signal Processing. 1 (1): 4–5. doi:10.1016/1051-2004(91)90086-Z.
DCT-History - How I Came Up With The Discrete Cosine Transform
Comparative Analysis for Discrete Sine Transform as a suitable method for noise estimation

Levinson-Durbin Autocorrelation Extrapolation of Price [Loxx]Levinson-Durbin Autocorrelation Extrapolation of Price is an indicator that uses the Levinson recursion or Levinson–Durbin recursion algorithm to predict price moves. This method is commonly used in speech modeling and prediction engines.
What is Levinson recursion or Levinson–Durbin recursion?
Is a linear algebra prediction analysis that is performed once per bar using the autocorrelation method with a within a specified asymmetric window. The autocorrelation coefficients of the window are computed and converted to LP coefficients using the Levinson algorithm. The LP coefficients are then transformed to line spectrum pairs for quantization and interpolation. The interpolated quantized and unquantized filters are converted back to the LP filter coefficients to construct the synthesis and weighting filters for each bar.
Data inputs
Source Settings: -Loxx's Expanded Source Types. You typically use "open" since open has already closed on the current active bar
LastBar - bar where to start the prediction
PastBars - how many bars back to model
LPOrder - order of linear prediction model; 0 to 1
FutBars - how many bars you want to forward predict
Things to know
Normally, a simple moving average is caculated on source data. I've expanded this to 38 different averaging methods using Loxx's Moving Avreages.
This indicator repaints
Included
Bar color muting
Further reading
Implementing the Levinson-Durbin Algorithm on the StarCore™ SC140/SC1400 Cores
LevinsonDurbin_G729 Algorithm, Calculates LP coefficients from the autocorrelation coefficients. Intel® Integrated Performance Primitives for Intel® Architecture Reference Manual

Lower TimeFrame Mini Candle[rsu]Lower Timeframe mini Candle
It is used to display the candle chart status of the small period 30m and 5m period through One Chart in the large period (day, or 8h, Week),
The period and window offset of the left and right windows can be set to suit your desktop resolution requirements.
Alert
Alert can be added to trigger when the stock price touches 200ma, please set the alert in the Day period.
It will trigger the alert at both 5m and 30m period.

DVD ScreensaverWatch it go! When will it hit the corner?
Get a breath of nostalgia with this fun little addition to your chart.
This is not indicative of any market movements, this is just something to look at while you wait.
This includes capabilities such as changing the size of the window, and background color of the window.

Weighted Standard Deviation BandsLinearly weighted standard deviations over linearly weighted mean.
The rationale of the study can be deduced from my latest publications where I go deeper into explaining the benefits of linear weighting, but in short, I can remind that by using linear weighting we are able to increase the information gain by communicating the sequential nature of time series to the calculations via linear weighting.
Note, that multiplier parameters can take both negative and positive values resulting in ability to have, for example, 1st and 6th weighted standard deviations higher than the weighted mean.
Despite the modification of the classic standard deviation formula, I assume that mathematical qualities of standard deviation will hold due to the fact we can alternately weight the window itself, and then apply the classic standard deviation over the weighted window. In both cases, the results will be the same.
Aight that was too formal, but your short strangles should be happy
Here is it, for you

Trapezoidal Weighted Moving Average and Bollinger BandsThis weighting method linearly weights a percentage of values from both the beginning and the end of the rolling window in order to minimize the effect of outliers entering and leaving the window.
Volatility Percentile🎲 Volatility is an important measure to be included in trading plan and strategy. Strategies have varied outcome based on volatility of the instruments in hand.
For example,
🚩 Trend following strategies work better on low volatility instruments and reversal patterns work better in high volatility instruments. It is also important for us to understand the median volatility of an instrument before applying particular strategy strategy on them.
🚩 Different instrument will have different volatility range. For instance crypto currencies have higher volatility whereas major currency pairs have lower volatility with respect to their price. It is also important for us to understand if the current volatility of the instrument is relatively higher or lower based on the historical values.
This indicator is created to study and understand more about volatility of the instruments.
⬜ Process
▶ Volatility metric used here is ATR as percentage of price. Other things such as bollinger bandwidth etc can also be used with few changes.
▶ We use array based counters to count ATR values in different range. For example, if we are measuring ATR range based on precision 2, we will use array containing 10000 values all initially set to 0 which act as 10000 buckets to hold counters of different range. But, based on the ATR percentage range, they will be incremented. Let's say, if atr percent is 2, then 200th element of the array is increased by 1.
▶ When we do this for every bar, we have array of counters which has the division on how many bars had what range of atr percent.
▶ Using this array, we can calculate how many bars had atr percent more than current value, how many had less than current value, and how many bars in history has same atr percent as current value.
▶ With these information, we can calculate the percentile of atr percentage value. We can also plot a detailed table mentioning what percentile each range map to.
⬜ Settings
▶ ATR Parameters - this include Moving average type and Length for atr calculation.
▶ Rounding type refers to rounding ATR percentage value before we put into certain bucket. For example, if ATR percentage 2.7, round or ceil will make it 3, whereas floor will make it 2 which may fall into different buckets based on the precision selected.
▶ Precision refers to how much detailed the range should be. If precision set to 0, then we get array of 100 to collect the range where each value will represent a range of 1%. Similarly precision of 1 will lead to array of 1000 with each item representing range of 0.1. Default value used is 2 which is also the max precision possible in this script. This means, we use array of 10000 to track the range and percentile of the ATR.
▶ Display Settings - Inverse when applied track percentile with respect to lowest value of ATR instead of high. By default this is set to false. Other two options allow users to enable stats table. When detailed stats are enabled, ATR Percentile as plot is hidden.
▶ Table Settings - Allows users to select set size and coloring options.
▶ Indicator Time Window - Allow users to select particular timeframe instead of all available bars to run the study. By default windows are disabled. Users can chose start and end time individually.
Indicator display components can be described as below:
