Multi Timeframe Bull Market Support BandsMulti Timeframe Bull Market Support Bands (BMSB) Indicator
Concept and Functionality:
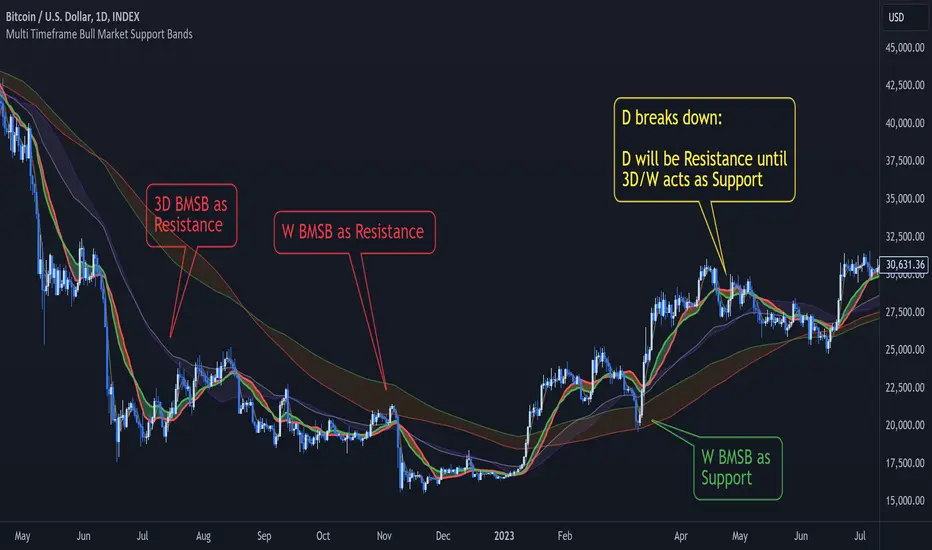
The Multi Timeframe Bull Market Support Bands (BMSB) indicator is a powerful tool designed to identify and visualize support levels across multiple timeframes simultaneously. The primary concept behind BMSB is to plot dynamic support bands derived from moving averages (MAs) that adapt to the prevailing bullish conditions across different timeframes. These bands act as support and resistance (S/R) levels, providing traders with critical insights into potential price bounce areas and market direction.
Key Features:
Multi Timeframe Analysis:
- The indicator plots bull market support bands for the following timeframes concurrently: Chart (with price prediction), 5 minutes (5m), 15 minutes (15m), 1 hour (1h or 60), 4 hours (4h or 240), Daily (D), 3 Days (3D), and Weekly (W).
- These bands allow traders to see how the price interacts with different support levels, potentially bouncing between them as it moves across timeframes.
Dynamic Band Visibility:
- Bands from shorter timeframes are only displayed in relevant higher timeframes:
- 5m is shown only in timeframes ≤ 15m.
- 15m is shown only in timeframes ≤ 1h.
- 1h is shown only in timeframes ≤ 4h.
- 4h is shown only in timeframes ≤ D.
- D and 3D are shown only in timeframes ≤ W.
- W is always shown.
Customizable Moving Averages:
- The period of the moving averages used to calculate the support bands can be adjusted. Any changes made will be applied across all bands to maintain consistency.
Future Band Prediction:
- If the current timeframe lacks sufficient bars to calculate a moving average, the indicator shows a blue line on the bar where the band will appear. When a new band appears on the current bar, it is highlighted in purple, allowing traders to notice the first value of the new band.
- These new bands can act as magnets, attracting price action. Knowing when a new band will appear helps traders anticipate whether the price will be drawn to the upcoming band or potentially break through it.
Benefits:
- Enhanced Market Insight: By layering support bands from multiple timeframes, traders gain a comprehensive view of market dynamics and potential bounce areas.
- Improved Decision-Making: The ability to see upcoming support bands and how the price interacts with them aids in making more informed trading decisions.
- Customization and Flexibility: Adjustable moving average periods ensure that the indicator can be tailored to fit various trading strategies and market conditions.
The Multi Timeframe Bull Market Support Bands indicator is a versatile and insightful tool for traders aiming to leverage multi-timeframe analysis to enhance their trading strategies and better understand market behavior.
Cari dalam skrip untuk "市值60亿的股票"
VWMA Multiple TimeframesVWMA Multiple Timeframes Indicator
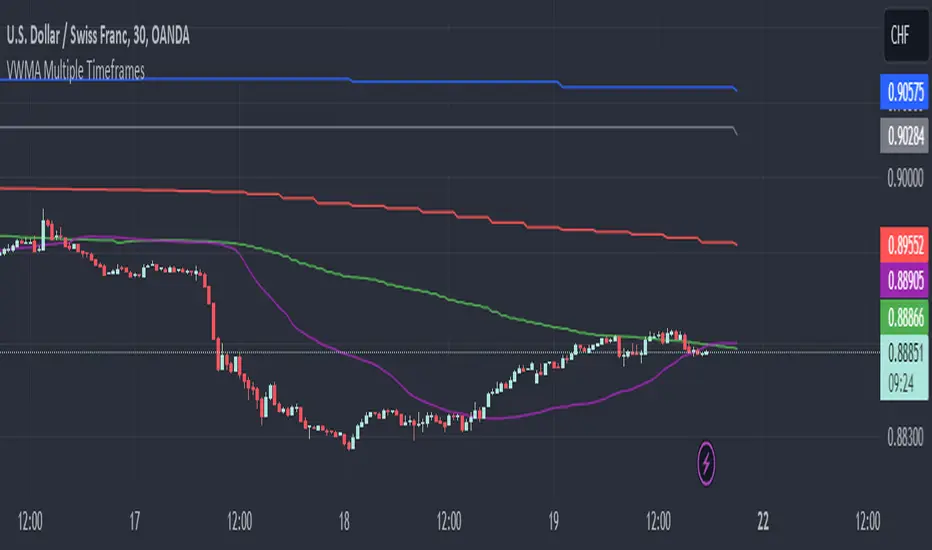
This TradingView indicator plots the Volume Weighted Moving Average (VWMA) across multiple timeframes on your chart. The VWMA is a type of moving average that gives more weight to periods with higher volume, making it a valuable tool for traders who want to incorporate volume into their technical analysis.
Features:
Multi-timeframe Analysis: This indicator calculates and plots the VWMA on five different timeframes:
Weekly (W)
Daily (D)
4 Hours (240 minutes)
1 Hour (60 minutes)
15 Minutes
Visual Representation: Each timeframe's VWMA is plotted with a different color, making it easy to distinguish between them on the chart:
Weekly VWMA: Gray
Daily VWMA: Blue
4 Hours VWMA: Red
1 Hour VWMA: Green
15 Minutes VWMA: Purple
How to Use:
Trend Identification: Use the VWMA to identify the direction of the trend on different timeframes. For example, if the VWMA is trending upwards on multiple timeframes, it indicates a strong upward trend.
Support and Resistance: The VWMA can act as dynamic support or resistance levels. Price bouncing off a VWMA line might indicate a continuation of the trend.
Volume Confirmation: The VWMA considers volume, making it useful for confirming the strength of price movements. High volume moves that cause the VWMA to change direction can be more significant than low volume moves.
This indicator is ideal for traders who use multi-timeframe analysis and want to incorporate volume into their trend and support/resistance identification. Feel free to customize the periods and timeframes to suit your trading style.
Six PillarsGeneral Overview
The "Six Pillars" indicator is a comprehensive trading tool that combines six different technical analysis methods to provide a holistic view of market conditions.
These six pillars are:
Trend
Momentum
Directional Movement (DM)
Stochastic
Fractal
On-Balance Volume (OBV)
The indicator calculates the state of each pillar and presents them in an easy-to-read table format. It also compares the current timeframe with a user-defined comparison timeframe to offer a multi-timeframe analysis.
A key feature of this indicator is the Confluence Strength meter. This unique metric quantifies the overall agreement between the six pillars across both timeframes, providing a score out of 100. A higher score indicates stronger agreement among the pillars, suggesting a more reliable trading signal.
I also included a visual cue in the form of candle coloring. When all six pillars agree on a bullish or bearish direction, the candle is colored green or red, respectively. This feature allows traders to quickly identify potential high-probability trade setups.
The Six Pillars indicator is designed to work across multiple timeframes, offering a comparison between the current timeframe and a user-defined comparison timeframe. This multi-timeframe analysis provides traders with a more comprehensive understanding of market dynamics.
Origin and Inspiration
The Six Pillars indicator was inspired by the work of Dr. Barry Burns, author of "Trend Trading for Dummies" and his concept of "5 energies." (Trend, Momentum, Cycle, Support/Resistance, Scale) I was intrigued by Dr. Burns' approach to analyzing market dynamics and decided to put my own twist upon his ideas.
Comparing the Six Pillars to Dr. Burns' 5 energies, you'll notice I kept Trend and Momentum, but I swapped out Cycle, Support/Resistance, and Scale for Directional Movement, Stochastic, Fractal, and On-Balance Volume. These changes give you a more dynamic view of market strength, potential reversals, and volume confirmation all in one package.
What Makes This Indicator Unique
The standout feature of the Six Pillars indicator is its Confluence Strength meter. This feature calculates the overall agreement between the six pillars, providing traders with a clear, numerical representation of signal strength.
The strength is calculated by considering the state of each pillar in both the current and comparison timeframes, resulting in a score out of 100.
Here's how it calculates the strength:
It considers the state of each pillar in both the current timeframe and the comparison timeframe.
For each pillar, the absolute value of its state is taken. This means that both strongly bullish (2) and strongly bearish (-2) states contribute equally to the strength.
The absolute values for all six pillars are summed up for both timeframes, resulting in two sums: current_sum and alternate_sum.
These sums are then added together to get a total_sum.
The total_sum is divided by 24 (the maximum possible sum if all pillars were at their strongest states in both timeframes) and multiplied by 100 to get a percentage.
The result is rounded to the nearest integer and capped at a minimum of 1.
This calculation method ensures that the Confluence Strength meter takes into account not only the current timeframe but also the comparison timeframe, providing a more robust measure of overall market sentiment. The resulting score, ranging from 1 to 100, gives traders a clear and intuitive measure of how strongly the pillars agree, with higher scores indicating stronger potential signals.
This approach to measuring signal strength is unique in that it doesn't just rely on a single aspect of price action or volume. Instead, it takes into account multiple factors, providing a more robust and reliable indication of potential market moves. The higher the Confluence Strength score, the more confident traders can be in the signal.
The Confluence Strength meter helps traders in several ways:
It provides a quick and easy way to gauge the overall market sentiment.
It helps prioritize potential trades by identifying the strongest signals.
It can be used as a filter to avoid weaker setups and focus on high-probability trades.
It offers an additional layer of confirmation for other trading strategies or indicators.
By combining the Six Pillars analysis with the Confluence Strength meter, I've created a powerful tool that not only identifies potential trading opportunities but also quantifies their strength, giving traders a significant edge in their decision-making process.
How the Pillars Work (What Determines Bullish or Bearish)
While developing this indicator, I selected and configured six key components that work together to provide a comprehensive view of market conditions. Each pillar is set up to complement the others, creating a synergistic effect that offers traders a more nuanced understanding of price action and volume.
Trend Pillar: Based on two Exponential Moving Averages (EMAs) - a fast EMA (8 period) and a slow EMA (21 period). It determines the trend by comparing these EMAs, with stronger trends indicated when the fast EMA is significantly above or below the slow EMA.
Directional Movement (DM) Pillar: Utilizes the Average Directional Index (ADX) with a default period of 14. It measures trend strength, with values above 25 indicating a strong trend. It also considers the Positive and Negative Directional Indicators (DI+ and DI-) to determine trend direction.
Momentum Pillar: Uses the Moving Average Convergence Divergence (MACD) with customizable fast (12), slow (26), and signal (9) lengths. It compares the MACD line to the signal line to determine momentum strength and direction.
Stochastic Pillar: Employs the Stochastic oscillator with a default period of 13. It identifies overbought conditions (above 80) and oversold conditions (below 20), with intermediate zones between 60-80 and 20-40.
Fractal Pillar: Uses Williams' Fractal indicator with a default period of 3. It identifies potential reversal points by looking for specific high and low patterns over the given period.
On-Balance Volume (OBV) Pillar: Incorporates On-Balance Volume with three EMAs - short (3), medium (13), and long (21) periods. It assesses volume trends by comparing these EMAs.
Each pillar outputs a state ranging from -2 (strongly bearish) to 2 (strongly bullish), with 0 indicating a neutral state. This standardized output allows for easy comparison and aggregation of signals across all pillars.
Users can customize various parameters for each pillar, allowing them to fine-tune the indicator to their specific trading style and market conditions. The multi-timeframe comparison feature also allows users to compare pillar states between the current timeframe and a user-defined comparison timeframe, providing additional context for decision-making.
Design
From a design standpoint, I've put considerable effort into making the Six Pillars indicator visually appealing and user-friendly. The clean and minimalistic design is a key feature that sets this indicator apart.
I've implemented a sleek table layout that displays all the essential information in a compact and organized manner. The use of a dark background (#030712) for the table creates a sleek look that's easy on the eyes, especially during extended trading sessions.
The overall design philosophy focuses on presenting complex information in a simple, intuitive format, allowing traders to make informed decisions quickly and efficiently.
The color scheme is carefully chosen to provide clear visual cues:
White text for headers ensures readability
Green (#22C55E) for bullish signals
Blue (#3B82F6) for neutral states
Red (#EF4444) for bearish signals
This color coding extends to the candle coloring, making it easy to spot when all pillars agree on a bullish or bearish outlook.
I've also incorporated intuitive symbols (↑↑, ↑, →, ↓, ↓↓) to represent the different states of each pillar, allowing for quick interpretation at a glance.
The table layout is thoughtfully organized, with clear sections for the current and comparison timeframes. The Confluence Strength meter is prominently displayed, providing traders with an immediate sense of signal strength.
To enhance usability, I've added tooltips to various elements, offering additional information and explanations when users hover over different parts of the indicator.
How to Use This Indicator
The Six Pillars indicator is a versatile tool that can be used for various trading strategies. Here are some general usage guidelines and specific scenarios:
General Usage Guidelines:
Pay attention to the Confluence Strength meter. Higher values indicate stronger agreement among the pillars and potentially more reliable signals.
Use the multi-timeframe comparison to confirm signals across different time horizons.
Look for alignment between the current timeframe and comparison timeframe pillars for stronger signals.
One of the strengths of this indicator is it can let you know when markets are sideways – so in general you can know to avoid entering when the Confluence Strength is low, indicating disagreement among the pillars.
Customization Options
The Six Pillars indicator offers a wide range of customization options, allowing traders to tailor the tool to their specific needs and trading style. Here are the key customizable elements:
Comparison Timeframe:
Users can select any timeframe for comparison with the current timeframe, providing flexibility in multi-timeframe analysis.
Trend Pillar:
Fast EMA Period: Adjustable for quicker or slower trend identification
Slow EMA Period: Can be modified to capture longer-term trends
Momentum Pillar:
MACD Fast Length
MACD Slow Length
MACD Signal Length These can be adjusted to fine-tune momentum sensitivity
DM Pillar:
ADX Period: Customizable to change the lookback period for trend strength measurement
ADX Threshold: Adjustable to define what constitutes a strong trend
Stochastic Pillar:
Stochastic Period: Can be modified to change the sensitivity of overbought/oversold readings
Fractal Pillar:
Fractal Period: Adjustable to identify potential reversal points over different timeframes
OBV Pillar:
Short OBV EMA
Medium OBV EMA
Long OBV EMA These periods can be customized to analyze volume trends over different timeframes
These customization options allow traders to experiment with different settings to find the optimal configuration for their trading strategy and market conditions. The flexibility of the Six Pillars indicator makes it adaptable to various trading styles and market environments.

Consistent ATR Trailing Stop (ATR, 1m based) [nn1]This indicator implements a Consistent ATR (Average True Range) Trailing Stop that maintains uniform behavior across various chart timeframes. It's designed to provide traders with a reliable tool for setting dynamic stop-loss levels that adapt to market volatility while remaining consistent regardless of the chosen chart interval.
Key Features:
1. Consistent ATR Calculation: The indicator calculates the ATR based on 1-minute data, regardless of the current chart timeframe. This ensures that the ATR value remains consistent across different intervals (e.g., 10s, 15s, 30s, 60s), providing a stable base for the trailing stop.
2. Dynamic Trailing Stop: The trailing stop adjusts based on the ATR, moving up in uptrends and down in downtrends to protect profits while allowing room for price fluctuations.
3. Trend Detection: The indicator determines the trend based on the price's relationship to the trailing stop, switching between long and short modes as the trend changes.
4. Visual Cues: The trailing stop line changes color to indicate the current trend (green for uptrends, red for downtrends) and briefly turns yellow during trend changes. Small circles below or above the price action further highlight the current trend direction.
5. Information Display: A label shows the current ATR value and trend direction, providing at-a-glance information to the trader.
6. Trend Change Highlights: The background briefly changes color when a trend change occurs, drawing attention to potential trading opportunities or exit points.
Usage:
- ATR Length: Set the number of periods for the ATR calculation. This is based on 1-minute data, so a value of 14 represents 14 minutes of data.
- ATR Multiplier: Adjust how far the trailing stop is placed from the price. Higher values create a wider stop, allowing for more price movement before triggering.
This indicator is particularly useful for traders who:
- Use multiple timeframes in their analysis and want consistent signals across charts.
- Seek a dynamic stop-loss method that adapts to market volatility.
- Want clear visual cues for trend direction and changes.
By providing a consistent ATR-based trailing stop across different timeframes, this indicator helps traders maintain a unified approach to their trading strategy, regardless of the chart interval they are viewing.

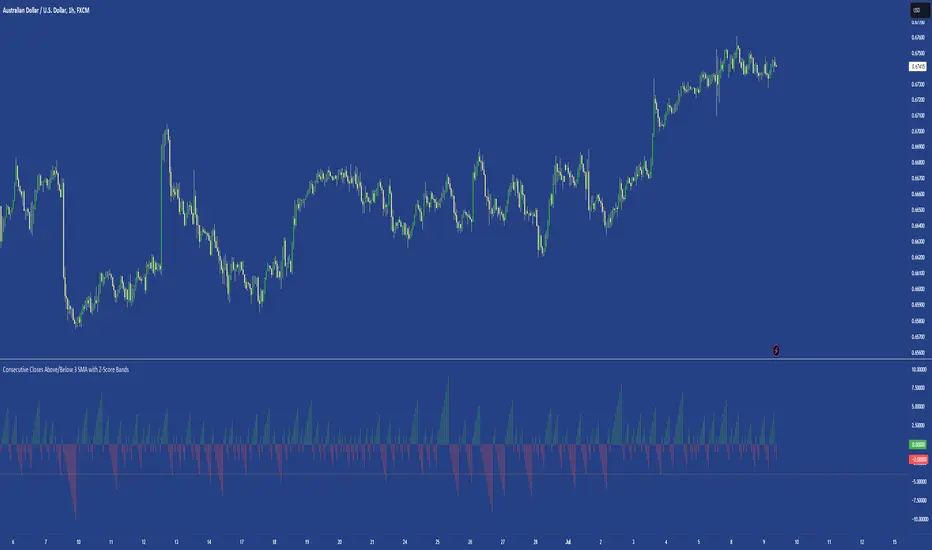
Consecutive Closes Above/Below 3 SMA with Z-Score BandsA simple indicator that measures consecutive closes above & below the 3-period simple moving average. An upper and lower Z-score has been calculated to indicate where the 4 standard deviations of the last 60 bars sits.
Useful for identifying directional runs in price.
RSI Trail [UAlgo]The RSI Trail indicator is a technical analysis tool designed to assist traders in making informed decisions by utilizing the Relative Strength Index (RSI) and various moving average calculations. This indicator dynamically plots support and resistance levels based on RSI values, providing visual cues for potential bullish and bearish signals. The inclusion of a trailing stop mechanism allows traders to adapt to market volatility, ensuring optimal entry and exit points.
🔶 Key Features
Multiple Moving Average Types: Choose from Simple Moving Average (SMA), Exponential Moving Average (EMA), Weighted Moving Average (WMA), Running Moving Average (RMA), and McGinley Dynamic for diverse analytical approaches.
Configurable RSI Bounds: Tailor the RSI lower and upper bounds to your specific trading preferences, with default settings at 40 and 60.
Signals: The indicator determines bullish and bearish market states and plots corresponding signals on the chart.
Customizable Visualization: Options to display the midline and color candles based on market state enhance visual analysis.
Alerts: Integrated alert conditions notify you of bullish and bearish signals.
🔶 Calculations
The RSI Trail indicator calculates dynamic support and resistance levels using a combination of moving averages and the Relative Strength Index (RSI). It starts by computing a chosen moving average (SMA, EMA, WMA, RMA, or McGinley) over a period of 27 using the typical price (ohlc4).
The indicator then defines upper and lower bounds based on customizable RSI levels (default 40 and 60) and adjusts these bounds using the Average True Range (ATR) to account for market volatility. The upper bound is calculated by adding a volatility-adjusted value to the moving average, while the lower bound is found by subtracting this value. Bullish signals occur when the price crosses above the upper bound, and bearish signals when it falls below the lower bound.
The RSI Trail indicator also can be used to identify pullback opportunities. When the price high/low crosses above/below the calculated upper/lower bound, it indicates a potential pullback, suggesting a favorable point to enter a trade during a pullback.
🔶 Disclaimer
This indicator is for informational purposes only and should not be considered financial advice.
Always conduct your own research and due diligence before making any trading decisions. Past performance is not necessarily indicative of future results.

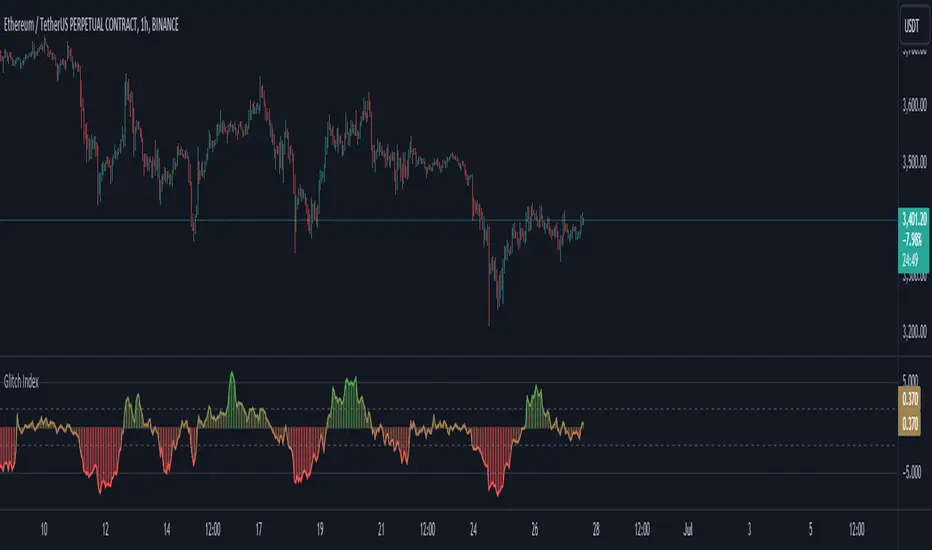
Glitch IndexGlitch Index is an oscillator from an unknown origin that is discovered in 2013 as a lua indicator taken from MetaStock days and we are not really sure how far back the original idea goes.
How it Works?
As I found this indicator and looking at it's code in different platform I can see it comes back from a basic idea of getting a price value, calculating it's smoothed average with a set multiplier and getting the difference then presenting it on a simplified scale. It appears to be another interpretation of figuring out price acceleration and velocity. The main logic is calculated as below:
price = priceSet(priceType)
_ma = getAverageName(price, MaMethod, MaPeriod)
rocma = ((_ma - _ma ) * 0.1) + 1
maMul = _ma * rocma
diff = price - maMul
gli_ind = (diff / price) * -10
How to Use?
Glitch Index can be used based on different implementations and along with your already existing trading system as a confirmation. Yoıu can use it as a Long signal when the histogram crosses inner levels or you can use it as an overbough and oversold signals when the histogram crosses above outter levels and gets back in the range between outter and inner levels.
You can customise the settings and set your prefered inner and outter levels in indicator settings along with gradient or static based coloring and modify the code as you see fit. The coloring code is set below:
gli_col = gli_ind > outterLevel ? color.green : gli_ind < -outterLevel ? color.red : gli_ind > innerLevel ? color.rgb(106, 185, 109, 57) : gli_ind < -innerLevel ? color.rgb(233, 111, 111, 40) : color.new(color.yellow, 60)
gradcol = color.from_gradient(gli_ind, -outterLevel, outterLevel, color.red, color.green)
colorSelect = colorType == "Gradient" ? gradcol : gli_col
HMA Crossover 1H with RSI, Stochastic RSI, and Trailing StopThe strategy script provided is a trading algorithm designed to help traders make informed buy and sell decisions based on certain technical indicators. Here’s a breakdown of what each part of the script does and how the strategy works:
Key Components:
Hull Moving Averages (HMA):
HMA 5: This is a Hull Moving Average calculated over 5 periods. HMAs are used to smooth out price data and identify trends more quickly than traditional moving averages.
HMA 20: This is another HMA but calculated over 20 periods, providing a broader view of the trend.
Relative Strength Index (RSI):
RSI 14: This is a momentum oscillator that measures the speed and change of price movements over a 14-period timeframe. It helps identify overbought or oversold conditions in the market.
Stochastic RSI:
%K: This is the main line of the Stochastic RSI, which combines the RSI and the Stochastic Oscillator to provide a more sensitive measure of overbought and oversold conditions. It is smoothed with a 3-period simple moving average.
Trading Signals:
Buy Signal:
Generated when the 5-period HMA crosses above the 20-period HMA, indicating a potential upward trend.
Additionally, the RSI must be below 45, suggesting that the market is not overbought.
The Stochastic RSI %K must also be below 39, confirming the oversold condition.
Sell Signal:
Generated when the 5-period HMA crosses below the 20-period HMA, indicating a potential downward trend.
The RSI must be above 60, suggesting that the market is not oversold.
The Stochastic RSI %K must also be above 63, confirming the overbought condition.
Trailing Stop Loss:
This feature helps protect profits by automatically selling the position if the price moves against the trade by 5%.
For sell positions, an additional trailing stop of 100 points is included.

ACD Indicator [TradingFinder] M Fisher Pivots Methodology Signal🔵 Introduction
The book "The Logical Trader" begins with a comprehensive review of the ACD Methodology principles, which include identifying specific price points related to the opening range.
This method allows you to set reference points for trading and use points "A" and "C" for trade entry. You will also learn about the "Pivot Range" and how to combine them with the ACD method to maximize position size and minimize risk.
In this indicator, the strategy is implemented to make it easier to use.
🔵 How to Use
The "ACD" strategy can be applied to various markets such as stocks, commodities, or forex, providing buy and sell signals that allow you to set your price targets and stop losses.
This strategy is based on the assumption that the opening range of trades is statistically significant each day, meaning the initial market fluctuations influence the market until the end of the day.
The ACD trading strategy is known as a breakout strategy and performs best in volatile or strongly trending markets, such as crude oil and stocks.
Some of the rules for using the ACD strategy include the following :
Consider points A and C as reference points and continuously pay attention to these points during trades. These points serve as entry and exit points for trades.
Examine daily and multi-day pivot ranges to analyze market trends. If the price is above the pivots, the trend is upward, and if below the pivots, the trend is downward.
Trading with the ACD strategy in forex is possible using the ACD indicator. This indicator is a technical tool used to measure the balance between supply and demand in the market. By analyzing trading volume and price, this indicator helps traders identify trend strength and suitable entry and exit points.
To use the ACD indicator, consider the following :
Identifying strong trends: The ACD indicator can help you identify strong and stable trends in the market.
Determining entry and exit points: ACD provides buy and sell signals to enter or exit trades at the best possible time.
Bullish Setup :
When the "A up" line is broken, it is advisable to wait for some time to ensure that this is not a "Fake Breakout" and that the price stabilizes above this line.
After entering the trade, the best stop loss you can choose is below the "A down" line. However, it is recommended to test this in backtests to achieve the best results. The suitable reward-to-risk ratio for this strategy is 1, which should also be backtested.
Bearish Setup :
When the "A down" line is broken, it is advisable to wait for some time to ensure that this is not a "Fake Breakout" and that the price stabilizes below this line.
After entering the trade, the best stop loss you can choose is above the "A up" line. However, it is recommended to test this in backtests to achieve the best results. The suitable reward-to-risk ratio for this strategy is 1, which should also be backtested.
🔵 Setting
NDay Pivot Range Period : Using this entry you can specify the number of days to calculate NDay Pivot Range.
Show Daily Pivot Range : Set the Daily Pivot color and displayed or not.
Show NDay Pivot Range : Set the NDay Pivot color and displayed or not.
ATR Period Levels : Determining the period of the ATR indicator, which is used to determine the A and C levels.
Show Tokyo ACD Setup : Set the Tokyo ACD Setup color and displayed or not.
Tokyo Opening Range Time : The amount of time taken to determine the opening range. You can set this number between 5 and 60 minutes.
Tokyo Session : Market start and end time.
A Level Multiplier : The coefficient that is multiplied by ATR to determine the distance of line A up and A down.
C Level Multiplier : The coefficient that is multiplied by ATR to determine the distance of line C up and C down.
The same settings exist for the London and New York sessions.

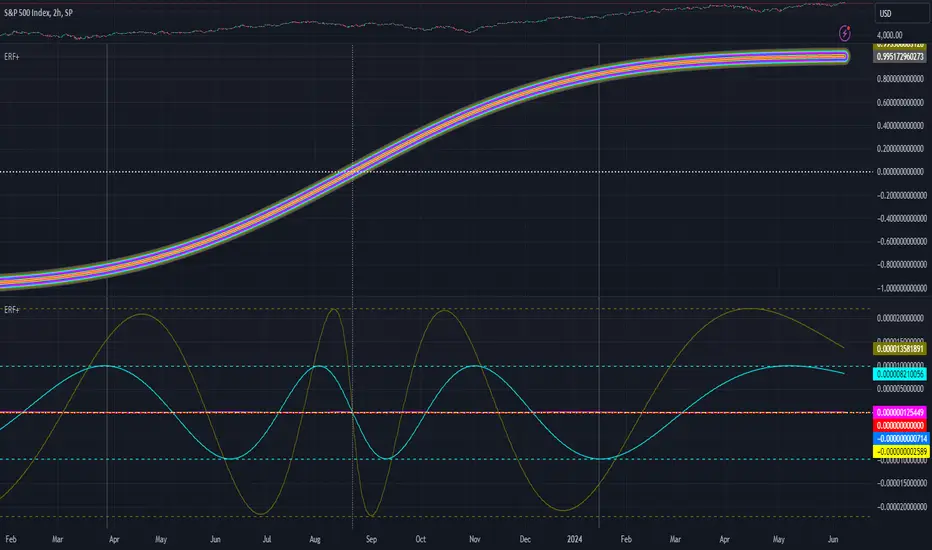
Prometheus Polarized Fractal Efficiency (PFE)This indicator uses market data to calculate Polarized Fractal Efficiency (PFE) on an asset, so traders can have a better idea of which direction it may go.
Users can control the lookback length for the fractal calculation, the lookback length for the Exponential Moving Average (EMA), and whether or not to display lines at the -50 and 50 level, or -25 and 25 level.
Polarized Fractal Efficiency:
The Polarized Fractal Efficiency (PFE) indicator is a value between -100 and 100 with 0 as a midpoint.
A PFE above 0 indicates the asset may trend higher, a PFE below 0 indicates the asset may trend lower.
There are many ways to trade with PFE, the intuitive trend riding as described above, or reversals.
Even when the PFE is above 0, if it gets high enough, it may also be an indication of a reversal. A PFE of 90 - 100, or -100 - -90, may indicate price is ready to revert the other direction. Furthermore, traders already in a position may look to breaks of other levels to be their take profit or stop out spot.
Calculation:
Pi = 100 x (Price - Price )2 + N2 / Summation, j= 0, to N-2 (Price - Price )2 + 1
If Close < Close Pi = -Pi
PFEi = EMA(Pi, M)
Where:
N = period of indicator
M = smoothing period
Citation: www.investopedia.com
Scenarios:
Inputs are (9, 5) and every display option is on.
Trend example
Step 1: A short trade appears as PFE crosses below -25. We reach a safe take profit as PFE crosses below -50. Traders can use these levels to exit as well as enter.
Step 2: On the cross above 25 there is a safe long. As the PFE value breaks 0 a safe, early take profit could be appropriate for this trade. No guarantee we would see 50.
Step 3: Long scenario at break of 25, straight to 50. Simple, straightforward setup.
Step 4: This long results in a stop loss. Once again entry as PFE crosses 25, but as we cross the 0 line it is for a loss.
Step 5: The last trade in this example is reminiscent of step 3. This is a short trade entry at break of 25 and exit at break of 50.
Traders have liberty to use the PFE value to determine spots to enter and exit trades, long or short. 25 and 50 were chosen arbitrarily, values like 10 and 60 may work as well, we encourage traders to use their own discretion along with tools.
Reversal example
Step 1: PFE is around -100, crossing below it at one point! Strong zone for a potential reversal.
Step 2: PFE crosses above 25 adding conviction.
Step 3: Option to exit at 70.
Step 4: Option to exit at 90.
There is no “one size fits all method”, this approach may be more intuitive for some users and is just as feasible as the first.
Longer trend example
Step 1: Using -50 and 50 this time instead of -25 and 25 to be safer on our entries we see a short here. Was a good entry and as the value gets closer to -70 we can safely close.
Step 2: On this candle we see a long for the break of 50. On the next candle we break the 0 line, but because of our safe entry at 50, we could hold this and only stop out at a break of -25. We get close but stay in it and close at 70.
Step 3: Break of 50 for a long once again. This time the break of 0 line occurs as we are in profit, not letting a green trade go red is a golden rule of trading, so an early exit here.
Step 4: Same at step 2, break of 50 to long and stay in it, not stopping out at break of 0 line. The PFE value eventually reaches 70 and there is a good exit.
Quicker Reversal example
Step 1: Notice a close with PFE below -90, enter long for the reversal. Then close for profit when the PFE crosses above 70.
Step 2: When the PFE breaks above 90 we have a short entry. Like the long closing it when it crosses below -70.
Step 3: This step is the same setup as step 2. As PFE breaks above 90 we have a short entry. Closing it when it crosses below -70.
Recap:
Described above are 4 different examples with many different trades. Both trend and reversal trades. The PFE value is an indicator that can be used by traders in many different ways and Prometheus encourages traders to use their own discretion along with tools and not follow indicators blindly.
Options:
Users can control the input for the lookback of the indicator. The default is 9.
The smoothing factor for the EMA is also changeable, default is 5.
Users have options to display lines at -50, -25, 25, and 50.

Sharpe and Sortino Ratios█ OVERVIEW
This indicator calculates the Sharpe and Sortino ratios using a chart symbol's periodic price returns, offering insights into the symbol's risk-adjusted performance. It features the option to calculate these ratios by comparing the periodic returns to a fixed annual rate of return or the returns from another selected symbol's context.
█ CONCEPTS
Returns, risk, and volatility
The return on an investment is the relative gain or loss over a period, often expressed as a percentage. Investment returns can originate from several sources, including capital gains, dividends, and interest income. Many investors seek the highest returns possible in the quest for profit. However, prudent investing and trading entails evaluating such returns against the associated risks (i.e., the uncertainty of returns and the potential for financial losses) for a clearer perspective on overall performance and sustainability.
The profitability of an investment typically comes at the cost of enduring market swings, noise, and general uncertainty. To navigate these turbulent waters, investors and portfolio managers often utilize volatility , a measure of the statistical dispersion of historical returns, as a foundational element in their risk assessments because it provides a tangible way to gauge the uncertainty in returns. High volatility suggests increased uncertainty and, consequently, higher risk, whereas low volatility suggests more stable returns with minimal fluctuations, implying lower risk. These concepts are integral components in several risk-adjusted performance metrics, including the Sharpe and Sortino ratios calculated by this indicator.
Risk-free rate
The risk-free rate represents the rate of return on a hypothetical investment carrying no risk of financial loss. This theoretical rate provides a benchmark for comparing the returns on a risky investment and evaluating whether its excess returns justify the risks. If an investment's returns are at or below the theoretical risk-free rate or the risk premium is below a desired amount, it may suggest that the returns do not compensate for the extra risk, which might be a call to reassess the investment.
Since the risk-free rate is a theoretical concept, investors often utilize proxies for the rate in practice, such as Treasury bills and other government bonds. Conventionally, analysts consider such instruments "risk-free" for a domestic holder, as they are a form of government obligation with a low perceived likelihood of default.
The average yield on short-term Treasury bills, influenced by economic conditions, monetary policies, and inflation expectations, has historically hovered around 2-3% over the long term. This range also aligns with central banks' inflation targets. As such, one may interpret a value within this range as a minimum proxy for the risk-free rate, as it may correspond to the minimum rate required to maintain purchasing power over time. This indicator uses a default value of 2% as the risk-free rate in its Sharpe and Sortino ratio calculations. Users can adjust this value from the "Risk-free rate of return" input in the "Settings/Inputs" tab.
Sharpe and Sortino ratios
The Sharpe and Sortino ratios are two of the most widely used metrics that offer insight into an investment's risk-adjusted performance . They provide a standardized framework to compare the effectiveness of investments relative to their perceived risks. These metrics can help investors determine whether the returns justify the risks taken to achieve them, promoting more informed investment decisions.
Both metrics measure risk-adjusted performance similarly. However, they have some differences in their formulas and their interpretation:
1. Sharpe ratio
The Sharpe ratio , developed by Nobel laureate William F. Sharpe, measures the performance of an investment compared to a theoretically risk-free asset, adjusted for the investment risk. The ratio uses the following formula:
Sharpe Ratio = (𝑅𝑎 − 𝑅𝑓) / 𝜎𝑎
Where:
• 𝑅𝑎 = Average return of the investment
• 𝑅𝑓 = Theoretical risk-free rate of return
• 𝜎𝑎 = Standard deviation of the investment's returns (volatility)
A higher Sharpe ratio indicates a more favorable risk-adjusted return, as it signifies that the investment produced higher excess returns per unit of increase in total perceived risk.
2. Sortino ratio
The Sortino ratio is a modified form of the Sharpe ratio that only considers downside volatility , i.e., the volatility of returns below the theoretical risk-free benchmark. Although it shares close similarities with the Sharpe ratio, it can produce very different values, especially when the returns do not have a symmetrical distribution, since it does not penalize upside and downside volatility equally. The ratio uses the following formula:
Sortino Ratio = (𝑅𝑎 − 𝑅𝑓) / 𝜎𝑑
Where:
• 𝑅𝑎 = Average return of the investment
• 𝑅𝑓 = Theoretical risk-free rate of return
• 𝜎𝑑 = Downside deviation (standard deviation of negative excess returns, or downside volatility)
The Sortino ratio offers an alternative perspective on an investment's return-generating efficiency since it does not consider upside volatility in its calculation. A higher Sortino ratio signifies that the investment produced higher excess returns per unit of increase in perceived downside risk.
The risk-free rate (𝑅𝑓) in the numerator of both ratio formulas acts as a baseline for comparing an investment's performance to a theoretical risk-free alternative. By subtracting the risk-free rate from the expected return (𝑅𝑎−𝑅𝑓), the numerator essentially represents the risk premium of the investment.
Comparison with another symbol
In addition to the conventional Sharpe and Sortino ratios, which compare an instrument's returns to a risk-free rate, this indicator can also compare returns to a user-specified benchmark symbol , allowing the calculation of Information ratios .
An Information ratio is a generalized form of the Sharpe ratio that compares an investment's returns to a risky benchmark , such as SPY, rather than a risk-free rate. It measures the investment's active return (the difference between its returns and the benchmark returns) relative to its tracking error (i.e., the volatility of the active return) using the following formula:
𝐼𝑅 = (𝑅𝑝 − 𝑅𝑏) / 𝑇𝐸
Where:
• 𝑅𝑝 = Average return on the portfolio or investment
• 𝑅𝑏 = Average return from the benchmark instrument
• 𝑇𝐸 = Tracking error (volatility of 𝑅𝑝 − 𝑅𝑏)
Comparing returns to a benchmark instrument rather than a theoretical risk-free rate offers unique insights into risk-adjusted performance. Higher Information ratios signify that the investment produced higher active returns per unit of increase in risk relative to the benchmark. Conventional choices for non-risk-free benchmarks include major composite indices like the S&P 500 and DJIA, as the resulting ratios can provide insight into the effectiveness of an investment relative to the broader market.
Users can enable this generalized calculation for both the Sharpe and Sortino ratios by selecting the "Benchmark symbol returns" option from the "Benchmark type" dropdown in the "Settings/Inputs" tab.
It's crucial to note that this indicator compares the charts symbol's rate of change (return) to the rate of change in the benchmark symbol. Consequently, not all symbols available on TradingView are suitable for use with these ratios due to the nature of what their values represent. For instance, using a bond as a benchmark will produce distorted results since each bar's values represent yields rather than prices, meaning it compares the rate of change in the yield. To maintain consistency and relevance in the calculated ratios, ensure the values from the compared symbols strictly represent price information.
█ FEATURES
This indicator provides traders with two widely used metrics for assessing risk-adjusted performance, generalized to allow users to compare the chart symbol's price returns to a fixed risk-free rate or the returns from another risky symbol. Below are the key features of this indicator:
Timeframe selection
The "Returns timeframe" input determines the timeframe of the calculated price returns. Users can select any value greater than or equal to the chart's timeframe. The default timeframe is "1M".
Periodic returns tracking
This indicator compounds and collects requested price returns from the selected timeframe over monthly or daily periods, similar to how the Broker Emulator works when calculating strategy performance metrics on trade data. It employs the following logic:
• Track returns over monthly periods if the chart's data spans at least two months.
• Track returns over daily periods if the chart's data spans at least two days but not two months.
• Do not track or collect returns if the data spans less than two days, as the amount of data is insufficient for meaningful ratio calculations.
The indicator uses the returns collected from up to a specified number of periods to calculate the Sharpe and Sortino ratios, depending on the available historical data. It also uses these periodic returns to calculate the average returns it displays in the Data Window.
Users can control the maximum number of periods the indicator analyzes with the "Max no. of periods used" input in the "Settings/Inputs" tab. The default value is 60 periods.
Benchmark specification
The "Benchmark return type" input specifies the benchmark type the indicator compares to the chart symbol's returns in the ratio calculations. It features the following two options:
• "Risk-free rate of return (%)": Compares the price returns to a user-specified annual rate of return representing a theoretical risk-free rate (e.g., 2%).
• "Benchmark symbol return": Compares the price returns to a selected benchmark symbol (e.g., "AMEX:SPY) to calculate Information ratios.
When comparing a chart symbol's returns to a specified benchmark symbol, this indicator aligns the times of data points from the benchmark with the times of data points from the chart's symbol to facilitate a fair comparison between symbols with different active sessions.
Visualization and display
• The indicator displays the periodic returns requested from the specified "Returns timeframe" in a separate pane. The plot includes dynamic colors to signify positive and negative returns.
• When the "Returns timeframe" value represents a higher timeframe, the indicator displays background highlights on the main chart pane to signify when a new value is available and whether the return is positive or negative.
• When the specified benchmark return type is a benchmark symbol, the indicator displays the requested symbol's returns in the separate pane as a gray line for visual comparison.
• Within the separate pane, the indicator displays a single-cell table that shows the base period it uses for periodic returns, the number of periods it uses in the calculation, the timeframe of the requested data, and the calculated Sharpe and Sortino ratios.
• The Data Window displays the chart symbol and benchmark returns, their periodic averages, and the Sharpe and Sortino ratios.
█ FOR Pine Script™ CODERS
• This script utilizes the functions from our RiskMetrics library to determine the size of the periods, calculate and collect periodic returns, and compute the Sharpe and Sortino ratios.
• The `getAlignedPrices()` function in this script requests price data for the chart's symbol and a benchmark symbol with consistent time alignment by utilizing spread symbols , which helps facilitate a fair comparison between different symbol types. Retrieving prices from spreads avoids potential information loss and data misalignment that can otherwise occur when using separate requests from each symbol's context when those symbols have different sessions or data times.
• For consistency, the `getAlignedPrices()` function includes extended hours and dividend adjustment modifiers in its data requests. Additionally, it includes other settings inherited from the chart's context, such as "settlement-as-close" preferences for fair comparison between futures instruments.
• This script uses the `changePercent()` function from our ta library to calculate the percentage changes of the requested data.
• The newly released `force_overlay` parameter in display-related functions allows indicators to display visuals on the main chart and a separate pane simultaneously. We use the parameter in this script's bgcolor() call to display background highlights on the main chart.
Look first. Then leap.

[Pandora] Error Function Treasure Trove - ERF/ERFI/Sigmoids+PRAISE:
At this time, I have to graciously thank the wonderful minds behind the new "Pine Profiler Mode" (PPM). Directly prior to this release, it allowed me to ascertain script performance even more. While I usually write mostly in highly optimized Pine code, PPM visually identified a few bottlenecks that would otherwise be hard to identify. Anyone who contributed to PPMs creation and testing before release... BRAVO!!! I commend all of those who assisted in it's state-of-the-art engineering and inception, well done!
BACKSTORY:
This script is specifically being released in defense of another member, an exceptionally unique PhD. It was brought to my attention that a script-mod-event occurred, regarding the publishing of a measly antiquated error function (ERF) calculation within his script. This sadly resulted in the now former member jumping ship after receiving unmannerly responses amidst his curious inquiries as to why his erf() was modded. To forbid rusty and rudimentary formulations because a mod-on-duty is temporally offended by a non-nefarious release of code, is in MY opinion an injustice to principles of perpetuating open-source code intended to benefit thousands to millions of community members. While Pine is the heart and soul of TV, the mathematical concepts contributed from the minds of members is the inspirational fuel of curiosity that powers it's pertinent reason to exist and evolve.
It is an indisputable fact that most members are not greatly skilled Pine Poets. Many members may be incapable of innovating robust function code in Pine, even if they have one or more PhDs. We ALL come from various disciplines of mathematical comprehension and education. Some mathematicians are not greatly skilled at coding, while some coders are not exceptional at math. So... what am I to do to attempt to resolve this circumstantial challenge??? Those who know me best are aware that I will always side with "the right side of history" in order to accomplish my primary self-defined missions I choose to accept. Serving as an algorithmic advocate, I felt compelled to intercede by compiling numerous error functions into elegant code of very high caliber that any and every TV member may choose to employ, so this ERROR never happens again.
After weeks of contemplation into algorithms I knew little about, I prioritized myself to resolve an unanticipated matter by creating advanced formulas of exquisitely crafted error functions refined to the best of my current abilities. My aversion for unresolved problems motivated me to eviscerate error function insufficiencies with many more rigid formulations beyond what is thought to exist. ERF needed a proper algorithmic exorcism anyways. In my furiosity, I contemplated an array of madMAXimum diplomatic demolition methods, choosing the chain saw massacre technique to slaughter dysfunctionalities I encountered on a battered ERF roadway. This resulted in prolific solutions that should assuredly endure the test of time. Poetically, as you will come to see, I am ripping the lid off of Pandora's box of error functions in this case to correct wrongs into a splendid bundle of rights for members.
INTENTION:
Error function (ERF) enthusiasts... PREPARE FOR GLORY!! The specific purpose of this script is to deprecate classic error functions with the creation of a fierce and formidable army of superior formulations, each having varying attributes of computational complexity with differing absolute error ranges in their results for multiple compute scenarios. This is NOT an indicator... It is intended to allow members to embark on endeavors to advance the profound knowledge base of this growing worldwide community of 60+ million inquisitive minds. For those of you who believe computational mathematics and statistics is near completion at its finest; I am here to inform you, this is ridiculous to ponder. We are no where near statistical excellence that can and will exist eventually. At this time, metaphorically speaking, we are merely scratching microns off of the surface of the skin of a statistical apple Isaac Newton once pondered.
THIS RELEASE:
Following weeks of pondering methodical experiments beyond the ordinary, I am liberating these wild notions of my error function explorations to the entire globe as copyleft code, not just Pine. This Pandora's basket of ERFs is being openly disclosed for the sake of the sanctity of mathematics, empirical science (not the garbage we are told by CONTROLocrats to blindly trust), revolutionary cutting edge engineering, cosmology, physics, information technology, artificial intelligence, and EVERY other mathematical branch of human knowledge being discovered over centuries. I do believe James Glaisher would favor my aims concerning ERF aspirations embracing the "Power of Pine".
The included functions are intended for TV members to use in any way they see fit. This is a gift to ALL members to foster future innovative excellence on this platform. Any attempt to moderate this code without notification of "self-evident clear and just cause" will be considered an irrevocable egregious action. The original foundational PURPOSE of establishing script moderation (I clearly remember) was primarily to maintain active vigilance over a growing community against intentional nefarious actions and/or behaviors in blatant disrespect to other author's works AND also thwart rampant copypasting bandit operations, all while accommodating balanced principles of fairness for an educational community cause via open source publishing that should support future algorithmic inventions well beyond my lifespan.
APPLICATIONS:
The related error functions are used in probability theory, statistics, and numerous and engineering scientific disciplines. Its key characteristics and applications are innumerable in computational realms. Its versatility and significance make it a fundamental tool in arenas of quantitative analysis and scientific research...
Probability Theory - Is widely used in probability theory to calculate probabilities and quantiles of the normal distribution.
Statistics - It's related to the Gaussian integral and plays a crucial role in statistics, especially in hypothesis testing and confidence interval calculations.
Physics - In physics, it arises in the study of diffusion equations, quantum mechanics, and heat conduction problems.
Engineering - Applications exist in engineering disciplines such as signal processing, control theory, and telecommunications.
Error Analysis - It's employed in error analysis and uncertainty quantification.
Numeric Approximations - Due to its lack of a closed-form expression, numerical methods are often employed to approximate erf/erfi().
AI, LLMs, & MACHINE LEARNING:
The error function (ERF) is indispensable to various AI applications, particularly due to its relation to Gaussian distributions and error analysis. It is used in Gaussian processes for regression and classification, probabilistic inference for Bayesian networks, soft margin computation in SVMs, neural networks involving Gaussian activation functions or noise, and clustering algorithms like Gaussian Mixture Models. Improved ERF approximations can enhance precision in these applications, reduce computational complexity, handle outliers and noise better, and improve optimization and convergence, possibly leading to more accurate, efficient, and robust AI systems.
BONUS ALGORITHMS:
While ERFs are versatile, its opposite also exists in the form of inverse error functions (ERFIs). I have also included a modified form of the inverse fisher transform along side MY sigmoid (sigmyod). I am uncertain what sigmyod() may be used for, but it's a culmination of my examinations deep into "sigmoid domains", something I am fascinated by. Whatever implications it may possess, I am unveiling it along with it's cousin functions. For curious minds, this quality of composition seen here is ideally what underlies what I would term "Pandora functionality" that empowers my Pandora indication. I go through hordes of formulations, testing, and inspection to find what appears to be the most beneficial logical/mathematical equation to apply...
SCRIPT OPERATION:
To showcase the characteristics and performance of my ERF/ERFI formulations, I devised a multi-modal script. By using bar_index , I generated a broad sequence of numeric values to input into the first ERF/ERFI parameter. These sequences allow you to inspect the contours of the error function's outputs for both ERF and ERFI. When combined with compute-intensive precision functions (CIPFs), the polynomial function output values can be subtracted from my CIPFs to obtain results of absolute error, displaying the accuracy of the many polynomial estimation functions I tuned in testing for Pine's float environment.
A host of numeric input settings are wildly adjustable to inspect values/curvatures across the range of numeric input sequences. Very large numbers, such as Divisor:100,000,100/Offset:200,000,000 for ERF modes or... Divisor:100,000,100/Offset:100,000,000 for ERFI modes, will display miniscule output values calculated from input values in close proximity to 0.0 for the various estimates, similar to a microscope. ERFI approximations very near in proximity to +/-1.0 will always yield large deviations of absolute error. Dragging/zooming your chart or using the Offset input will aid with visually clipping off those ERFI extremes where float precision functions cannot suffice.
NOTICE:
perf() and perfi() are intended for precision computation (as good as it basically gets) in a float environment. However, they are CPU intensive (especially perfi). I wouldn't recommend these being used in ANY Pine script unless it's an "absolute necessity" to do so to accomplish your goal. I only built them to obtain "absolute error curvatures" of the error functions for the polynomial approximations. These are visible in the accuracy modes in the indicator Settings.
Momentum Alligator 4h Bitcoin StrategyOverview
The Momentum Alligator 4h Bitcoin Strategy is a trend-following trading system that operates on dual time frames. It utilizes the 1D Williams Alligator indicator to identify the prevailing major price trend and seeks trading opportunities on the 4-hour (4h) time frame when the momentum is turning up. The strategy is designed to close trades if the trend fails to develop or holding position if price continues increasing without any significant correction. Note that this strategy is specifically tailored for the 4-hour time frame.
Unique Features
2-layers market noise filtering system: Trades are only initiated in the direction of the 1D trend, determined by the Williams Alligator indicator. This higher time frame confirmation filters out minor trade signals, focusing on more substantial opportunities. At the same time, strategy has additional filter on 4h time frame with Awesome Oscillator which is showing the current price momentum.
Flexible Risk Management: The strategy exclusively opens long positions, resulting in fewer trades during bear markets. It incorporates a dynamic stop-loss mechanism, which can either follow the jaw line of the 4h Alligator or a user-defined fixed stop-loss. This flexibility helps manage risk and avoid non-trending markets.
Methodology
The strategy initiates a long position when the d-line of Stochastic RSI crosses up it's k-line. It means that there is a high probability that price momentum reversed from down to up. To avoid overtrading in potentially choppy markets, it skips the next two trades following a winning trade, anticipating sideways movement after a significant price surge.
This strategy has two layers trades filtering system: 4h and 1D time frames. The first one is awesome oscillator. It shall be increasing and value has to be higher than it's 5-period SMA. This is an additional confirmation that long trade is opened in the direction of the current momentum. As it was mentioned above, all entry signals are validated against the 1D Williams Alligator indicator. A trade is only opened if the price is above all three lines of the 1D Alligator, ensuring alignment with the major trend.
A trade is closed if the price hits the 4h jaw line of the Alligator or reaches the user-defined stop-loss level.
Risk Management
The strategy employs a combined approach to risk management:
It allows positions to ride the trend as long as the price continues to move favorably, aiming to capture significant price movements. It features a user-defined stop-loss parameter to mitigate risks based on individual risk tolerance. By default, this stop-loss is set to a 2% drop from the entry point, but it can be adjusted according to the trader's preferences.
Justification of Methodology
This strategy leverages Stochastic RSI on 4h time frame to open long trade when momentum started reversing to the upside. On the one hand, Stochastic RSI is one of the most sensitive indicator, which allows to react fast on the potential trend reversal. On the other hand, this indicator can be too sensitive and provide a lot of false trend changing signals. To eliminate this weakness we use two-layers trades filtering system.
The first layer is the 4h Awesome oscillator. This is less sensitive momentum indicator. Usually it starts increasing when price has already passed significant distance from the actual reversal point. The strategy opens long trade only is Awesome oscillator is increasing and above it's 5-period SMA. This approach increases the probability to filter the false signals during the choppy market or if the reversal is false.
The second layer filter is the Williams Alligator indicator on 1D time frame. The 1D Alligator serves as a filter for identifying the primary trend and increases probability to avoid the trades with low potential because trading against major trend usually is more risky. It's much better to catch the trend continuation than local bounce.
Last but not least feature of this strategy is close trades condition. It uses the flexible approach. First of all, user can set up the fixed stop-loss according to his own risk-tolerance, by default this value is 2% of price movement. It restricts the potential loss at the moment when trade has just been opened. Moreover strategy utilizes the 4h Williams Alligator's jaw line to exit the trade. If price fell below it trade is closed. This approach helps to not keep open trade if trend is not developing and hold it if price continues going up.
Backtest Results:
Operating window: Date range of backtests is 2021.01.01 - 2024.05.01. It is chosen to let the strategy to close all opened positions.
Commission and Slippage: Includes a standard Binance commission of 0.1% and accounts for possible slippage over 5 ticks.
Initial capital: 10000 USDT
Percent of capital used in every trade: 50%
Maximum Single Position Loss: -3.04%
Maximum Single Profit: +29.67%
Net Profit: +6228.01 USDT (+62.28%)
Total Trades: 118 (24.58% win rate)
Profit Factor: 1.71
Maximum Accumulated Loss: 1527.69 USDT (-11.52%)
Average Profit per Trade: 52.78 USDT (+0.89%)
Average Trade Duration: 60 hours
These results are obtained with realistic parameters representing trading conditions observed at major exchanges such as Binance and with realistic trading portfolio usage parameters.
How to Use:
Add the script to favorites for easy access.
Apply to the 4h timeframe desired chart (optimal performance observed on the BTC/USDT).
Configure settings using the dropdown choice list in the built-in menu.
Set up alerts to automate strategy positions through web hook with the text: {{strategy.order.alert_message}}
Disclaimer:
Educational and informational tool reflecting Skyrex commitment to informed trading. Past performance does not guarantee future results. Test strategies in a simulated environment before live implementation

Bitcoin Futures vs. Spot Tri-Frame - Strategy [presentTrading]Prove idea with a backtest is always true for trading.
I developed and open-sourced it as an educational material for crypto traders to understand that the futures and spot spread may be effective but not be as effective as they might think. It serves as an indicator of sentiment rather than a reliable predictor of market trends over certain periods. It is better suited for specific trading environments, which require further research.
█ Introduction and How it is Different
The "Bitcoin Futures vs. Spot Tri-Frame Strategy" utilizes three different timeframes to calculate the Z-Score of the spread between BTC futures and spot prices on Binance and OKX exchanges. The strategy executes long or short trades based on composite Z-Score conditions across the three timeframes.
The spread refers to the difference in price between BTC futures and BTC spot prices, calculated by taking a weighted average of futures prices from multiple exchanges (Binance and OKX) and subtracting a weighted average of spot prices from the same exchanges.
BTCUSD 1D L/S Performance
█ Strategy, How It Works: Detailed Explanation
🔶 Calculation of the Spread
The spread is the difference in price between BTC futures and BTC spot prices. The strategy calculates the spread by taking a weighted average of futures prices from multiple exchanges (Binance and OKX) and subtracting a weighted average of spot prices from the same exchanges. This spread serves as the primary metric for identifying trading opportunities.
Spread = Weighted Average Futures Price - Weighted Average Spot Price
🔶 Z-Score Calculation
The Z-Score measures how many standard deviations the current spread is from its historical mean. This is calculated for each timeframe as follows:
Spread Mean_tf = SMA(Spread_tf, longTermSMA)
Spread StdDev_tf = STDEV(Spread_tf, longTermSMA)
Z-Score_tf = (Spread_tf - Spread Mean_tf) / Spread StdDev_tf
Local performance
🔶 Composite Entry Conditions
The strategy triggers long and short entries based on composite Z-Score conditions across all three timeframes:
- Long Condition: All three Z-Scores must be greater than the long entry threshold.
Long Condition = (Z-Score_tf1 > zScoreLongEntryThreshold) and (Z-Score_tf2 > zScoreLongEntryThreshold) and (Z-Score_tf3 > zScoreLongEntryThreshold)
- Short Condition: All three Z-Scores must be less than the short entry threshold.
Short Condition = (Z-Score_tf1 < zScoreShortEntryThreshold) and (Z-Score_tf2 < zScoreShortEntryThreshold) and (Z-Score_tf3 < zScoreShortEntryThreshold)
█ Trade Direction
The strategy allows the user to specify the trading direction:
- Long: Only long trades are executed.
- Short: Only short trades are executed.
- Both: Both long and short trades are executed based on the Z-Score conditions.
█ Usage
The strategy can be applied to BTC or Crypto trading on major exchanges like Binance and OKX. By leveraging discrepancies between futures and spot prices, traders can exploit market inefficiencies. This strategy is suitable for traders who prefer a statistical approach and want to diversify their timeframes to validate signals.
█ Default Settings
- Input TF 1 (60 minutes): Sets the first timeframe for Z-Score calculation.
- Input TF 2 (120 minutes): Sets the second timeframe for Z-Score calculation.
- Input TF 3 (180 minutes): Sets the third timeframe for Z-Score calculation.
- Long Entry Z-Score Threshold (3): Defines the threshold above which a long trade is triggered.
- Short Entry Z-Score Threshold (-3): Defines the threshold below which a short trade is triggered.
- Long-Term SMA Period (100): The period used to calculate the simple moving average for the spread.
- Use Hold Days (true): Enables holding trades for a specified number of days.
- Hold Days (5): Number of days to hold the trade before exiting.
- TPSL Condition (None): Defines the conditions for taking profit and stop loss.
- Take Profit (%) (30.0): The percentage at which the trade will take profit.
- Stop Loss (%) (20.0): The percentage at which the trade will stop loss.
By fine-tuning these settings, traders can optimize the strategy to suit their risk tolerance and trading style, enhancing overall performance.

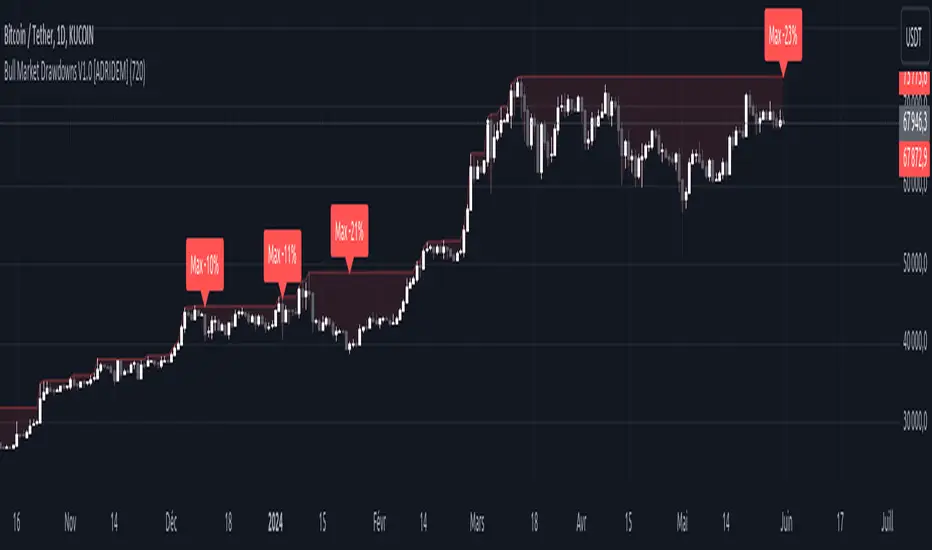
Bull Market Drawdowns V1.0 [ADRIDEM]Bull Market Drawdowns V1.0
Overview
The Bull Market Drawdowns V1.0 script is designed to help visualize and analyze drawdowns during a bull market. This script calculates the highest high price from a specified start date, identifies drawdown periods, and plots the drawdown areas on the chart. It also highlights the maximum drawdowns and marks the start of the bull market, providing a clear visual representation of market performance and potential risk periods.
Unique Features of the New Script
Default Timeframe Configuration: Allows users to set a default timeframe for analysis, providing flexibility in adapting the script to different trading strategies and market conditions.
Customizable Bull Market Start Date: Users can define the start date of the bull market, ensuring the script calculates drawdowns from a specific point in time that aligns with their analysis.
Drawdown Calculation and Visualization: Calculates drawdowns from the highest high since the bull market start date and plots the drawdown areas on the chart with distinct color fills for easy identification.
Maximum Drawdown Tracking and Labeling: Tracks the maximum drawdown for each period and places labels on the chart to indicate significant drawdowns, helping traders identify and assess periods of higher risk.
Bull Market Start Marker: Marks the start of the bull market on the chart with a label, providing a clear reference point for the beginning of the analysis period.
Originality and Usefulness
This script provides a unique and valuable tool by combining drawdown analysis with visual markers and customizable settings. By calculating and plotting drawdowns from a user-defined start date, traders can better understand the performance and risks associated with a bull market. The script’s ability to track and label maximum drawdowns adds further depth to the analysis, making it easier to identify critical periods of market retracement.
Signal Description
The script includes several key visual elements that enhance its usefulness for traders:
Drawdown Area : Plots the upper and lower boundaries of the drawdown area, filling the space between with a semi-transparent color. This helps traders easily identify periods of market retracement.
Maximum Drawdown Labels : Labels are placed on the chart to indicate the maximum drawdown for each period, providing clear markers for significant drawdowns.
Bull Market Start Marker : A label is placed at the start of the bull market, marking the beginning of the analysis period and helping traders contextualize the drawdown data.
These visual elements help quickly assess the extent and impact of drawdowns within a bull market, aiding in risk management and decision-making.
Detailed Description
Input Variables
Default Timeframe (`default_timeframe`) : Defines the timeframe for the analysis. Default is 720 minutes
Bull Market Start Date (`start_date_input`) : The starting date for the bull market analysis. Default is January 1, 2023
Functionality
Highest High Calculation : The script calculates the highest high price on the specified timeframe from the user-defined start date.
```pine
var float highest_high = na
if (time >= start_date)
highest_high := na(highest_high ) ? high : math.max(highest_high , high)
```
Drawdown Calculation : Determines the drawdown starting point and calculates the drawdown percentage from the highest high.
```pine
var float drawdown_start = na
if (time >= start_date)
drawdown_start := na(drawdown_start ) or high >= highest_high ? high : drawdown_start
drawdown = (drawdown_start - low) / drawdown_start * 100
```
Maximum Drawdown Tracking : Tracks the maximum drawdown for each period and places labels above the highest high when a new high is reached.
```pine
var float max_drawdown = na
var int max_drawdown_bar_index = na
if (time >= start_date)
if na(max_drawdown ) or high >= highest_high
if not na(max_drawdown ) and not na(max_drawdown_bar_index) and max_drawdown > 10
label.new(x=max_drawdown_bar_index, y=drawdown_start , text="Max -" + str.tostring(max_drawdown , "#") + "%",
color=color.red, style=label.style_label_down, textcolor=color.white, size=size.normal)
max_drawdown := 0
max_drawdown_bar_index := na
else
if na(max_drawdown ) or drawdown > max_drawdown
max_drawdown := drawdown
max_drawdown_bar_index := bar_index
```
Drawdown Area Plotting : Plots the drawdown area with upper and lower boundaries and fills the area with a semi-transparent color.
```pine
drawdown_area_upper = time >= start_date ? drawdown_start : na
drawdown_area_lower = time >= start_date ? low : na
p1 = plot(drawdown_area_upper, title="Drawdown Area Upper", color=color.rgb(255, 82, 82, 60), linewidth=1)
p2 = plot(drawdown_area_lower, title="Drawdown Area Lower", color=color.rgb(255, 82, 82, 100), linewidth=1)
fill(p1, p2, color=color.new(color.red, 90), title="Drawdown Fill")
```
Current Maximum Drawdown Label : Places a label on the chart to indicate the current maximum drawdown if it exceeds 10%.
```pine
var label current_max_drawdown_label = na
if (not na(max_drawdown) and max_drawdown > 10)
current_max_drawdown_label := label.new(x=bar_index, y=drawdown_start, text="Max -" + str.tostring(max_drawdown, "#") + "%",
color=color.red, style=label.style_label_down, textcolor=color.white, size=size.normal)
if (not na(current_max_drawdown_label))
label.delete(current_max_drawdown_label )
```
Bull Market Start Marker : Places a label at the start of the bull market to mark the beginning of the analysis period.
```pine
var label bull_market_start_label = na
if (time >= start_date and na(bull_market_start_label))
bull_market_start_label := label.new(x=bar_index, y=high, text="Bull Market Start", color=color.blue, style=label.style_label_up, textcolor=color.white, size=size.normal)
```
How to Use
Configuring Inputs : Adjust the default timeframe and start date for the bull market as needed. This allows the script to be tailored to different market conditions and trading strategies.
Interpreting the Indicator : Use the drawdown areas and labels to identify periods of significant market retracement. Pay attention to the maximum drawdown labels to assess the risk during these periods.
Signal Confirmation : Use the bull market start marker to contextualize drawdown data within the overall market trend. The combination of drawdown visualization and maximum drawdown labels helps in making informed trading decisions.
This script provides a detailed view of drawdowns during a bull market, helping traders make more informed decisions by understanding the extent and impact of market retracements. By combining customizable settings with visual markers and drawdown analysis, traders can better align their strategies with the underlying market conditions, thus improving their risk management and decision-making processes.
VAMSI ADVANCE Entry HelperThe "VAMSI Entry Helper" indicator is designed to assist traders in identifying potential entry points in the market by analyzing price equilibrium and liquidity equilibrium using a combination of Relative Strength Index (RSI) and moving averages. Here’s a detailed description of its components and functionality:
Components of the Indicator:
RSI (Relative Strength Index):
RSI Length: This parameter (rsiLengthInput) controls the period over which the RSI is calculated. It is set to 50 by default, but you can adjust it as needed.
RSI Source: The source of the price data for calculating the RSI, which is the closing price by default.
Moving Average (MA):
MA Type: You can choose between Simple Moving Average (SMA) and Exponential Moving Average (EMA) for smoothing the RSI values.
MA Length: This parameter (maLengthInput) controls the period over which the moving average of the RSI is calculated. It is set to 60 by default.
Functionality:
RSI Calculation:
The script calculates the RSI based on the selected source and length. RSI is a momentum oscillator that measures the speed and change of price movements and oscillates between 0 and 100.
The RSI calculation involves computing the average gains and losses over the specified period (rsiLengthInput), and then applying the RSI formula.
Moving Average of RSI:
After calculating the RSI, the indicator computes a moving average of the RSI values using the specified type (SMA or EMA) and length (maLengthInput). This smoothed RSI helps in identifying the equilibrium of liquidity.
Plots:
RSI Plot: The RSI values are plotted on the chart with a purple line (#4B0082), providing a visual representation of price equilibrium.
MA Plot: The moving average of the RSI is plotted with a black line, showing the smoothed trend of the RSI.
Middle Band: A horizontal line at the 50 level is plotted as a reference point, indicating the midpoint of the RSI scale. This can help in identifying overbought and oversold conditions.
Use Case:
Price Equilibrium: The RSI plot helps traders identify when the price is relatively strong or weak. RSI values above 70 may indicate an overbought condition, while values below 30 may indicate an oversold condition.
Liquidity Equilibrium: The moving average of the RSI provides a smoothed view of the RSI, helping traders see the overall trend of liquidity equilibrium.
Example Usage:
Entry Points: Traders might look for entry points when the RSI crosses above or below its moving average, indicating potential changes in momentum.
Overbought/Oversold Conditions: Traders can use the RSI values along with the middle band (50) to identify overbought (RSI > 70) and oversold (RSI < 30) conditions.
Customization:
RSI Length: Adjustable to fit different trading strategies and timeframes.
Source: You can change the source data for the RSI calculation (e.g., close, open, high, low).
MA Type and Length: You can choose between SMA and EMA and adjust the period to better fit your trading style.
This indicator provides a comprehensive tool for traders to analyze price and liquidity equilibrium, helping them make informed decisions about entry points in the market.

TMB LevelsDescription:
Improved "Hourly Midline" indicator. It displays high, middle and low levels of every candle with specified timeframe (can be hourly, daily, or any other timeframe). You can change the source for the levels (either high and low of candle, or open and close of candle). Additionally, you can turn on the "Line chart", which essentially connects every midline, making a line chart of middle prices.
Parameters:
- Timeframe -> use data from this timeframe ("30" would mean 30 minutes, "60" would mean 1 hour, etc.)
- Source -> source for calculating the middle level
- Top -> parameters of the top level lines
- Middle -> parameters of the middle level lines
- Bottom -> parameters of the bottom level lines
- Line chart -> connect every midline, making a line chart

Futures Auto Levels [NariCapitalTrading]Futures Auto Levels Indicator
Introduction
The "Futures Auto Levels" (FAL) indicator shows the previous day's levels, weekly open, high, low, and the Initial Balance Range (IBR).
Indicator Components
The FAL indicator comprises the following components:
Previous Day's Levels: These include the open, high, low, and close of the previous trading day. They are represented on the chart by lines and labels, helping to identify significant price levels from the prior session.
Weekly Open, High, Low: These levels represent the open, high, and low prices of the current trading week.
Initial Balance Range (IBR): The IBR is calculated based on the price range during the first 60 minutes of the trading day. It helps identify initial trading range and potential breakout levels.
How to Use the Indicator
1. Previous Day's Levels:
Monitor the previous day's open, high, low, and close to identify key support and resistance levels.
Use these levels to gauge market sentiment and potential price reversals.
2. Weekly Open, High, Low:
Pay attention to the weekly open, high, and low to understand the market's behavior within the weekly timeframe.
These levels can act as reference points for setting profit targets and stop-loss orders.
3. Initial Balance Range (IBR):
Watch for price movements within the IBR to identify potential trading opportunities.
Breakouts above or below the IBR may signal the beginning of a new trend or continuation of the current trend.
Suggested/Potential Strategies
Reversal Trading: Look for price reversals around previous day's levels, especially when they coincide with other technical indicators or significant support/resistance zones.
Trend Following: Follow the trend by trading breakouts above/below the IBR or weekly high/low levels. Use trailing stops to capture profits while the trend remains intact.
Range Trading: Trade within the IBR when the market is consolidating. Buy near the IBR low and sell near the IBR high, with tight stop-loss orders to manage risk.
Conclusion
The Futures Auto Levels indicator is designed to help incorporate levels into trading analysis and trading strategies to improve profitability and consistency.

Sector Rotation Hedging With Volatility Index [TradeDots]The "Sector Rotation Hedging Strategy With Volatility Index" is a comprehensive trading indicator developed to optimally leverage the S&P500 volatility index. It is designed to switch between distinct ETF sectors, strategically hedging to moderate risk exposure during harsh market volatility.
HOW DOES IT WORK
The core of this indicator is grounded on the S&P500 volatility index (VIX) close price and its 60-day moving average. This serves to determine whether the prevailing market volatility is above or below the quarterly average.
In periods of elevated market volatility, risk exposure escalates significantly. Traders retaining stocks in sectors with disproportionately high volatility face increased vulnerability to negative returns. To tackle this, our indicator employs a two-pronged approach utilizing two sequential candlestick close prices to confirm if volatility surpasses the average value.
Upon confirming above-average volatility, a hedging table is deployed to spotlight ETFs with low volatility, such as the Utilities Select Sector SPDR Fund (XLU), to derisk the overall portfolio.
Conversely, in low-volatility conditions, sectors yielding higher returns like the Technology Select Sector SPDR Fund (XLK) are preferred. The hedging table is utilized to earmark high-return sector ETFs.
Thus, during highly volatile market periods, the strategy recommends enhancing portfolio allocation to low-volatility ETFs. During low-volatility windows, the portfolio is calibrated towards high-volatility ETFs for heightened returns.
IMPORTANT CONSIDERATION
In real trading, additional considerations encompassing trading commissions, management fees, and ancillary rotation costs should be factored in. False signals may arise, potentially leading to losses from these fees.
RISK DISCLAIMER
Trading entails substantial risk, and most day traders incur losses. All content, tools, scripts, articles, and education provided by TradeDots serve purely informational and educational purposes. Past performances are not definitive predictors of future results.

OHT Harmonic LevelsHarmonic Level plotter I've been talking about on the discord - right now a lot of this is manual and some day maybe we can get it to be automatic across different time frames but that is probably far off in the future.
For now, you need to probably create a new tab/layout for each instrument you add this to. It will then ask for the long start price and short start price. I would like to leave this how it is as I don't like using the top of pivot points, its lazy and you don't learn to go find the current trend.
The levels have an area around them equal to 10% of the rotation size, so if NQ has a rotation size of 60, there is a 6pt area around the actual level to either size to account for rotation average changes.
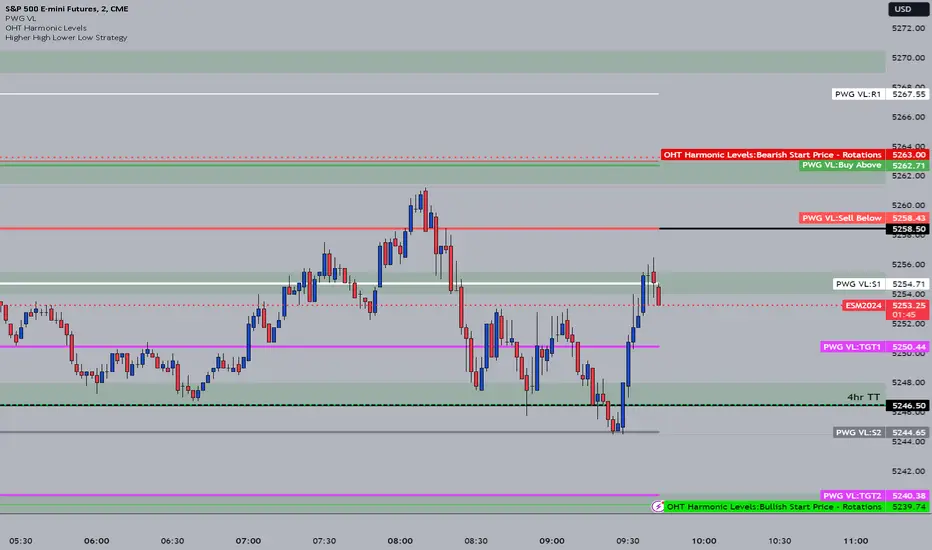
1000X Dual T3 Set to Any Time Frame1000X Dual T3 Set to Any Time Frame
The "1000X Dual T3 Set to Any Time Frame" is an enhancement of the well-known T3 indicator, building upon the T3 Average script by HPotter , which was itself based on Tim Wilson's work on smoothing techniques. This version provides two T3 lines, which is useful when adapting one each to the long and short trends on the same chart, with the added flexibility of setting the indicator to a higher time frame than the one you are currently trading. We also make the "b" value adjustable, creating a more sensitivity, adaptable indicator. This indicator is recommended as a trend filter or confirmation indicator in trading strategies.
Key Features
Dual Trend Analysis: The dual T3 offers a view of long and short trends to aid in better optimized market analysis. This avoids the problem with using a single T3 line to filter tradable price action for both long and short sides, which forces one to compromise performance in order to achieve profitability in both directions.
Timeframe Customization: This indicator can be set to a desired timeframe while trading another. For example, the T3 can be set as a trend filter on the daily or weekly time frame to separate bull and bear markets, even as you work with other indicators on a chart set to a lower time frame. Set the time frame in the inputs, using minutes (15, 60, 240, etc.) or using D, W, and M.
Preserved T3 Script: Like the powerful HPotter script on which it builds, this indicator leverages EMA-based T3 smoothing calculations for smooth and responsive trend lines.
B Value adjustability: Given the role of the b value in smoothing and sensitivity, I have found it beneficial to make the b value an adjustable input as well. A higher b value will make the T3 line more responsive to recent price changes, making it closer to the actual price movements but potentially more susceptible to market noise.
Visual Trend Indicators: In addition to filtering markets using the "above or below" approach, this script provides colour coding to delineate trend directions.
Acknowledgments
As stated, this work is a tribute to the foundational contributions of Tim Wilson and the subsequent development by HPotter whose script was the basis of this one. The enhancements in this version aim to provide added value to the trading community.

Volume Quartile IndicatorThe Volume Quartile Indicator is a tool designed to analyze and classify trading volumes based on quartile levels, offering traders a visual means to assess market strength and momentum. This indicator calculates volume levels using a default length of 60 periods to determine the quartiles at 10%, 30%, 50%, 70%, and 90%. Each quartile range is represented by a specific color, providing a clear, visual representation of volume intensity relative to historical data.
Color-Coded Volume Strength: Volume strength is visually represented through a color-coded system for quick and intuitive analysis:
Red: Volume below the 10% level indicates very weak market activity.
Orange: Volume between 10% and 30% signifies weak market activity.
Gray: Volume in the 30% to 50% range represents medium activity with a weak bias.
Silver: Volume between 50% and 70% indicates medium activity with a strong bias.
Blue: Volume in the 70% to 90% range denotes strong market activity.
Green: Volume above the 90% level signifies very strong market activity.
Special Volume Markers: Yellow diamond markers highlight volumes that stand out due to their significance, providing traders with visual cues for potential market entry or exit points.
Q-Lines: The indicator draws q-lines at the 70%, 90%, and the midpoint between these two levels. The convergence of these q-lines suggests potential volatility in volume, which could significantly impact price movements.
The Volume Quartile Classification Indicator is atool for traders looking to incorporate volume analysis into their trading strategy.

Pivot Points + Day First Candle Breakout + VWAP + Supertrend This indicator amalgamates several key indicators to provide a comprehensive analysis for trading decisions, including SuperTrend, Pivot Points, VWAP, along with the Day First Candle Breakout strategy.
Key Features:
Day First Candle Breakout: Identifies potential breakout opportunities based on the first candle of the trading day. It utilizes the high and low of the initial trading range to determine entry points.
Timeframe Selection: Allows users to select the timeframe for analyzing the first candle (e.g., 5, 15, or 60 minutes).
Previous Day and Week High/Low: Displays the high and low of the previous day and week to provide additional context for trading decisions and assess the strength of the trend.
Trend Strength Analysis: Indicates whether the current price is above or below the previous day's high or low, signaling a stronger bullish or bearish trend respectively.
SuperTrend Indicator: Visualizes the trend direction and potential reversal points based on the SuperTrend indicator. It helps traders to stay aligned with the prevailing trend and avoid premature exits.
Pivot Points: Presents key support and resistance levels derived from Pivot Points, assisting traders in identifying potential reversal or breakout zones.
VWAP (Volume Weighted Average Price): Plots VWAP to provide insight into the average price traded over a given period, aiding in determining the fair value of the asset and potential buying/selling zones.
Trading Signals:
Buy Signal: Triggered when the price exceeds the high of the initial trading range after an upward price gap.
Sell Signal: Generated when the price falls below the low of the initial trading range after a downward price gap.
Caveats for Effective Trading:
Extended Trading Ranges: Adjusts support and resistance levels if the initial trading range extends beyond the defined timeframe.
Morning Noise Consideration: Exercises caution during volatile morning sessions to avoid false breakouts and whipsaws.
Pullbacks and Narrow Range Bars: Looks for opportunities during pullbacks or when the price forms narrow range bars to enter trades, reducing the risk of sudden reversals.
