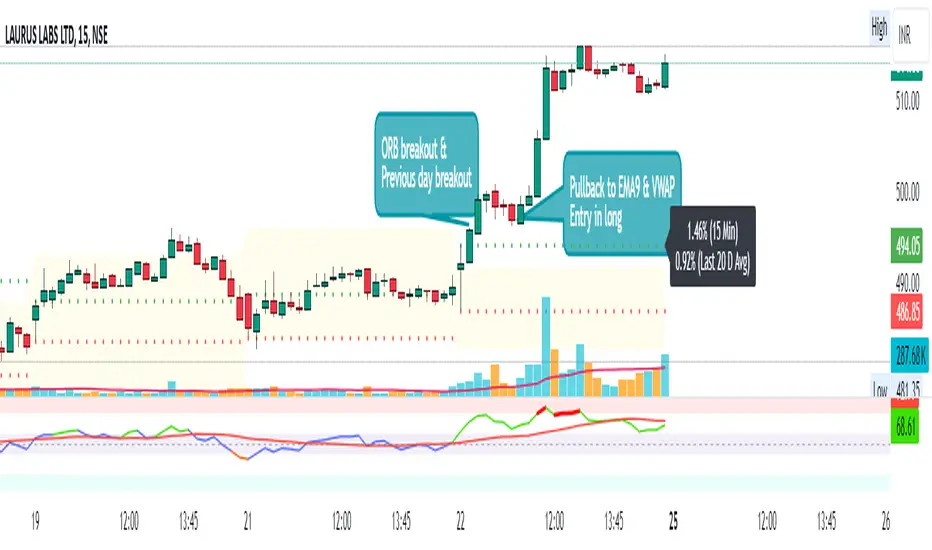
Day First Candle BreakoutR-DFCB V1.5: Day First Candle Breakout
This indicator identifies potential breakout opportunities based on the first candle of the trading day. It considers the high and low of the initial trading range to determine possible entry points, along with the previous day's high and low to gauge the strength of the trend.
Key Features:
Day First Candle Breakout: Analyzes the first candle of the trading day to identify potential breakout scenarios.
Timeframe Selection: Allows users to select the timeframe for analyzing the first candle (e.g., 5, 15, or 60 minutes).
Previous Day and Week High/Low: Displays the high and low of the previous day and week to provide additional context for trading decisions.
Previous Day Trend Strength: Indicates whether the current price is above or below the previous day's high or low, signaling a stronger bullish or bearish trend respectively.
Trading Signals:
Buy Signal: Triggered when the price exceeds the high of the initial trading range after an upward price gap.
Sell Signal: Generated when the price falls below the low of the initial trading range after a downward price gap.
Trend Strength Analysis:
Strong Bullish Trend: If the current price is above the previous day's high, it indicates a stronger bullish trend.
Strong Bearish Trend: If the current price is below the previous day's low, it suggests a stronger bearish trend.
Caveats for Effective Trading:
Extended Trading Ranges: Adjusts support and resistance levels if the initial trading range extends beyond the defined timeframe.
Morning Noise Consideration: Exercises caution during volatile morning sessions to avoid false breakouts and whipsaws.
Pullbacks and Narrow Range Bars: Looks for opportunities during pullbacks or when the price forms narrow range bars to enter trades, reducing the risk of sudden reversals.
Cari dalam skrip untuk "市值60亿的股票"
Three ma cross alertThis indicator displays three moving averages and can set alarms.
The default values for the three moving averages are set to 20,35,60, which can be changed by the user.
It is based on the idea of considering the moving average as an up-trend when it is in a positive arrangement and a down-trend when it is in a reverse arrangement.
If the candle reaches each moving average when the moving average is in a positive arrangement, it is considered a price adjustment
Therefore when the candles touch each line with the ma in the same arrangement, an alarm occurs.
The alarm reference time zone is set by 1D default, , and can be modified from the settings.
You can use it when you want to see the simple 3 moving averages without an alarm.
The alarm occurs before the closing price of the candle is closed in real time.
If there is any improvement, please contact us
Thanks

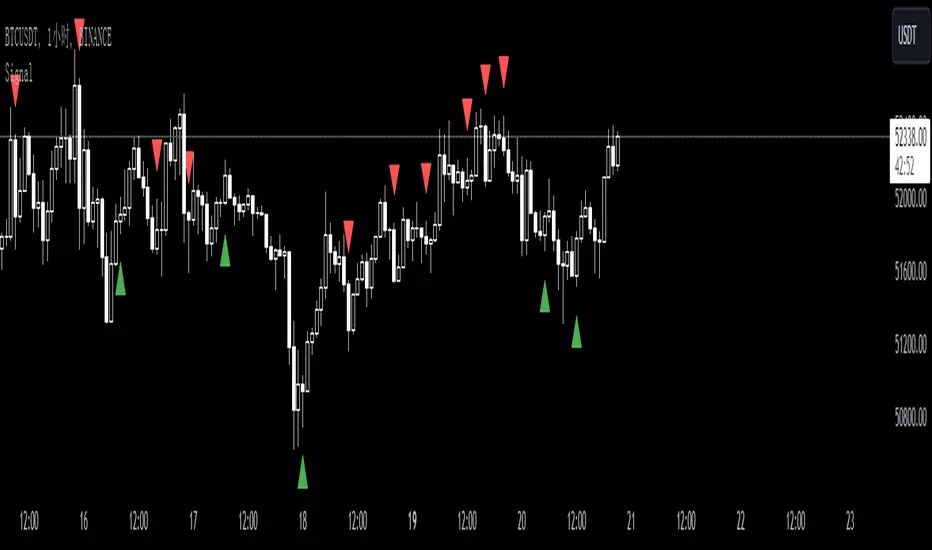
SignalThis custom TradingView indicator, named "Signal," is designed to generate buy and sell signals based on the Stochastic Oscillator, a momentum indicator that compares a particular closing price of an asset to a range of its prices over a certain period of time. The indicator is set to overlay on the price chart, providing visual cues for potential trading opportunities.
Key features of the "Signal" indicator include:
1. **Dynamic Period Adjustment**: The indicator automatically adjusts its settings based on the chart's time frame. For a 1-hour (60 minutes) chart, the stochastic length is set to 15, while for a 15-minute chart, the length is set to 10.
2. **Stochastic Calculation**: It calculates the %K line as a smoothed moving average (SMA) of the stochastic ratio, and the %D line as an SMA of the %K line, with both lines smoothed over a period derived from the dynamic length setting.
3. **Signal Detection**: The indicator identifies bullish crossovers (golden crosses) when the %K line crosses above the %D line and the average of both lines is below 50. Conversely, it detects bearish crossovers (death crosses) when the %K line crosses below the %D line and the average is above 50.
4. **Signal Confirmation**: Signals are confirmed using historical data with an offset of 1 bar to ensure that the crossover is evaluated after the close of the candlestick, thus avoiding repainting issues.
5. **Visual Indicators**: Buy signals are represented by green upward-pointing triangles placed below the bars, while sell signals are indicated by red downward-pointing triangles above the bars.
6. **Alerts**: The indicator includes alert conditions for both golden crosses and death crosses, notifying users when a potential buy or sell signal has been identified based on the stochastic crossover.
This indicator can be a valuable tool for traders who follow stochastic momentum signals and prefer to have dynamic adjustments based on the chart's time frame. It is important to note that, as with all trading indicators, the "Signal" indicator should be used in conjunction with other forms of analysis to confirm trading signals and manage risk effectively.
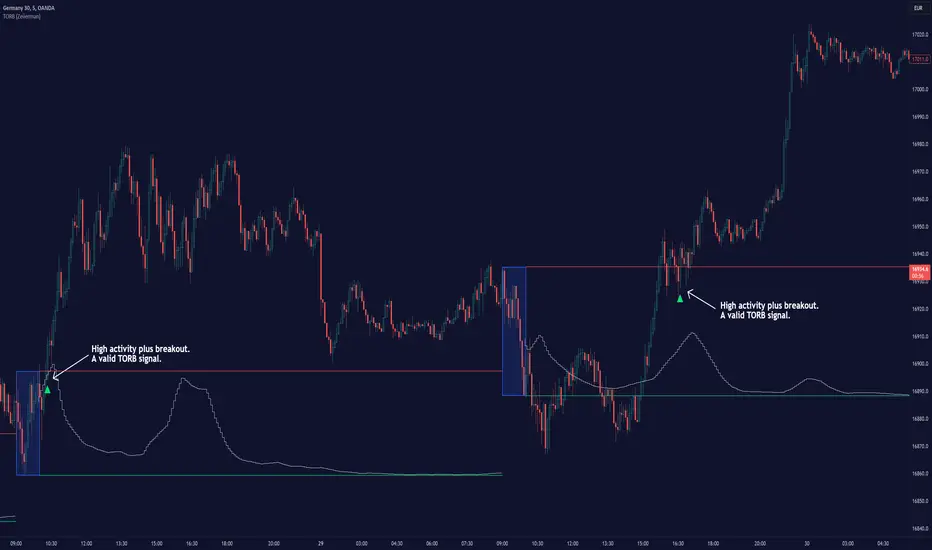
Timely Opening Range Breakout Strategy [TORB] (Zeiierman)█ Overview
The Timely Opening Range Breakout (TORB) indicator builds upon the classic Open Range Breakout (ORB) concept. The ORB strategy is a popular trading setup used to identify trades around the opening range of an asset. It's based on the idea that the first few minutes (15-60 minutes) of trading often set the tone for the rest of the day, with breakouts above or below the opening range signifying potential trends.
TORB refines the concept by stating that a trade is only valid if there is sufficient market activity. This means a breakout beyond the upper or lower range is only of interest during the most active trading hours, as defined by PMMV (Per-Minute Mean Volume)
█ How It Works
ORB
The indicator works by first defining a session's opening range based on user-specified settings, including the session's start and end times and the applicable time zone. During this session, it calculates the high and low price points, which form the basis for identifying potential breakout levels.
PMMV
PMMV (Per-Minute Mean Volume) provides a snapshot of the market's activity level at each minute of the trading day. PMMV is calculated by averaging the trading volume in a one-minute interval over a specified number of trading days. This script uses the average volume over the last N periods to determine the PMMV value. This average volume provides a smoother representation of volume activity compared to using a single volume value. It considers the volume over a broader timeframe, filtering out short-term fluctuations and potentially offering a more reliable indicator of underlying market activity.
TORB
TORB works by integrating the Opening Range Breakout (ORB) highs and lows with the Per-Minute Mean Volume (PMMV) metric to assess the validity of breakouts. The objective is to identify breakouts from the opening high and low levels during periods of heightened market activity, as indicated by PMMV.
█ How to Use
To effectively utilize the Timely Opening Range Breakout (TORB) strategy, follow these steps:
Identify Active Hours: Employ PMMV to pinpoint periods of peak activity within the trading day.
Apply Basic ORB Rules: If the price surpasses the upper range (resistance), buy; if it breaches the lower range (support), sell.
Breakouts
The TORB strategy identifies breakout signals when the price moves beyond the established range, supported by volume exceeding a set threshold. This technique aims to eliminate false signals, focusing on price movements during high market activity.
█ Settings
Session
Trading Session: Customize the trading session's start and end times.
Volume
Volume analysis is integral to the TORB strategy, as it uses volume data to confirm the strength and validity of breakout signals.
Period: Sets the number of periods (or bars) to calculate the average volume, which is then used to assess market activity level.
Sensitivity and Significance: Adjusts how responsive the volume analysis is to changes in trading volume. By adjusting the sensitivity, traders can decide how much emphasis to place on volume spikes, potentially reducing false breakouts and focusing on those supported by significant trading activity.
Breakout Threshold
This setting establishes a criterion to identify when the price movement is significant enough.
Threshold: Traders set a threshold level to identify high market activity. If the PMMV is greater than or equal to this threshold, it indicates significant market activity.
Setting the correct threshold is key to balancing sensitivity and specificity. Too low of a threshold may lead to many false positives, while too high of a threshold might filter out potentially profitable breakouts. This setting helps in pinpointing when market activity indicates a strong move, thereby aligning trade entries with moments of heightened market momentum.
-----------------
Disclaimer
The information contained in my Scripts/Indicators/Ideas/Algos/Systems does not constitute financial advice or a solicitation to buy or sell any securities of any type. I will not accept liability for any loss or damage, including without limitation any loss of profit, which may arise directly or indirectly from the use of or reliance on such information.
All investments involve risk, and the past performance of a security, industry, sector, market, financial product, trading strategy, backtest, or individual's trading does not guarantee future results or returns. Investors are fully responsible for any investment decisions they make. Such decisions should be based solely on an evaluation of their financial circumstances, investment objectives, risk tolerance, and liquidity needs.
My Scripts/Indicators/Ideas/Algos/Systems are only for educational purposes!
PresentTrend RMI Synergy - Strategy [presentTrading] █ Introduction and How it is Different
The "PresentTrend RMI Synergy Strategy" is the combined power of the Relative Momentum Index (RMI) and a custom presentTrend indicator. This strategy introduces a multifaceted approach, integrating momentum analysis with trend direction to offer traders a more nuanced and responsive trading mechanism.
BTCUSD 6h L/S Performance
Local
█ Strategy, How It Works: Detailed Explanation
The "PresentTrend RMI Synergy Strategy" intricately combines the Relative Momentum Index (RMI) and a custom SuperTrend indicator to create a powerful tool for traders.
🔶 Relative Momentum Index (RMI)
The RMI is a variation of the Relative Strength Index (RSI), but instead of using price closes against itself, it measures the momentum of up and down movements in price relative to previous prices over a given period. The RMI for a period length `N` is calculated as follows:
RMI = 100 - 100/ (1 + U/D)
where:
- `U` is the average upward price change over `N` periods,
- `D` is the average downward price change over `N` periods.
The RMI oscillates between 0 and 100, with higher values indicating stronger upward momentum and lower values suggesting stronger downward momentum.
RMI = 21
RMI = 42
For more information - RMI Trend Sync - Strategy :
🔶 presentTrend Indicator
The presentTrend indicator combines the Average True Range (ATR) with a moving average to determine trend direction and dynamic support or resistance levels. The presentTrend for a period length `M` and a multiplier `F` is defined as:
- Upper Band: MA + (ATR x F)
- Lower Band: MA - (ATR x F)
where:
- `MA` is the moving average of the close price over `M` periods,
- `ATR` is the Average True Range over the same period,
- `F` is the multiplier to adjust the sensitivity.
The trend direction switches when the price crosses the presentTrend bands, signaling potential entry or exit points.
presentTrend length = 3
presentTrend length = 10
For more information - PresentTrend - Strategy :
🔶 Strategy Logic
Entry Conditions:
- Long Entry: Triggered when the RMI exceeds a threshold, say 60, indicating a strong bullish momentum, and when the price is above the presentTrend, confirming an uptrend.
- Short Entry: Occurs when the RMI drops below a threshold, say 40, showing strong bearish momentum, and the price is below the present trend, indicating a downtrend.
Exit Conditions with Dynamic Trailing Stop:
- Long Exit: Initiated when the price crosses below the lower presentTrend band or when the RMI falls back towards a neutral level, suggesting a weakening of the bullish momentum.
- Short Exit: Executed when the price crosses above the upper presentTrend band or when the RMI rises towards a neutral level, indicating a reduction in bearish momentum.
Equations for Dynamic Trailing Stop:
- For Long Positions: The exit price is set at the lower SuperTrend band once the entry condition is met.
- For Short Positions: The exit price is determined by the upper SuperTrend band post-entry.
These dynamic trailing stops adjust as the market moves, providing a method to lock in profits while allowing room for the position to grow.
This strategy's strength lies in its dual analysis approach, leveraging RMI for momentum insights and presentTrend for trend direction and dynamic stops. This combination offers traders a robust framework to navigate various market conditions, aiming to capture trends early and exit positions strategically to maximize gains and minimize losses.
█ Trade Direction
The strategy provides flexibility in trade direction selection, offering "Long," "Short," or "Both" options to cater to different market conditions and trader preferences. This adaptability ensures that traders can align the strategy with their market outlook, risk tolerance, and trading goals.
█ Usage
To utilize the "PresentTrend RMI Synergy Strategy," traders should input their preferred settings in the Pine Script™ and apply the strategy to their charts. Monitoring RMI for momentum shifts and adjusting positions based on SuperTrend signals can optimize entry and exit points, enhancing potential returns while managing risk.
█ Default Settings
1. RMI Length: 21
The 21-period RMI length strikes a balance between capturing momentum and filtering out market noise, offering a medium-term outlook on market trends.
2. Super Trend Length: 7
A SuperTrend length of 7 periods is chosen for its responsiveness to price movements, providing a dynamic framework for trend identification without excessive sensitivity.
3. Super Trend Multiplier: 4.0
The multiplier of 4.0 for the SuperTrend indicator widens the trend bands, focusing on significant market moves and reducing the impact of minor fluctuations.
---
The "PresentTrend RMI Synergy Strategy" represents a significant step forward in trading strategy development, blending momentum and trend analysis in a unique way. By providing a detailed framework for understanding market dynamics, this strategy empowers traders to make more informed decisions.

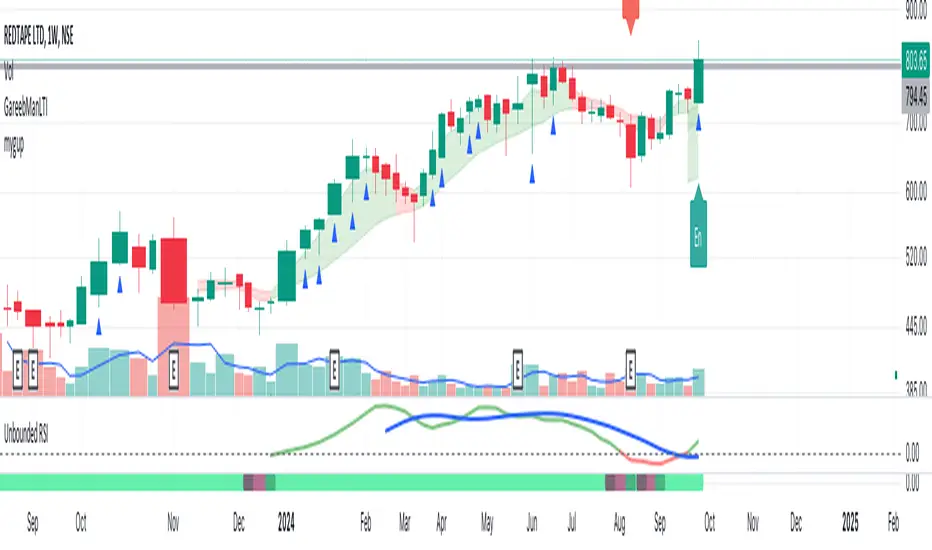
Unbounded RSIIntroducing the concept of "Unbounded RSI".
Instead of indexing the average gain and average loss, over the time period of interest, we leave the average gain and loss unbounded. Instead we "bound" them by difference of each and smoothen out this difference in an envelope using exponential average. See code.
What this does to traditional RSI concept?
No concept of "overbought", "oversold"
No concept of "60-40", "70-30" bands and arguments over it
No concept of "Range Shifts"
...
How to use it?
I am generally a positional long trader. So I present my version. Of course, I expect each individual who decide to use this concept, to come up with their ideas, based on their style and temperament.
The points below, I apply on a Weekly Timeframe Chart.
Once, we see a long consolidation and price breakout, we should be able to see "Green" histogram bars. These appear, once we have the stock at least 20% up from the 52WL and the "Unbounded RSI" has turned positive. This can be a good time to "enter" into the scrip.
The height of the bars are significant, since they essentially show, that the "gap" between the avg. gain and avg. loss is widening, indicating momentum. Swing trading can thrive in these environments I guess.
Falling heights indicate that gaps to close, though, the "gap can still be green". This means, momentum is now falling. Swing traders and "quick buck makers", would ideally book profits here. If the color of the bars still remain "Green" it indicates that momentum has reduced but still the gains are "more" than loss on the timeperiod selected.
Once the histogram turns red, it means that the gain is now lower than loss. An increasing height underground, means this loss is widening. Generally, this will corelate with price action (not necessarily volume).
At this time, exits should be looked for, may be also check other factors/indicators to decide, but surely the momentum and the gain% over the timeperiod selected has now gone.
Note for Pine Coders:
The source code can easily be modified to develop this concept further.
For example:
Use different smoothing algorithms
Remove 52WL condition and introduce new additional conditions
Instead of price change of the stock for gain/loss calculations, we use the concept of Relative Strength (RS, not RSI) and measuere the gain/loss based on a benchmark index . I intend to work on this concept, soon.
You shall see a variable "unboundedRSI" which is actually a ratio of the Avg. Gain / Avg. Loss. This ratio is not plotted. It is kept there, for future use.
Many more
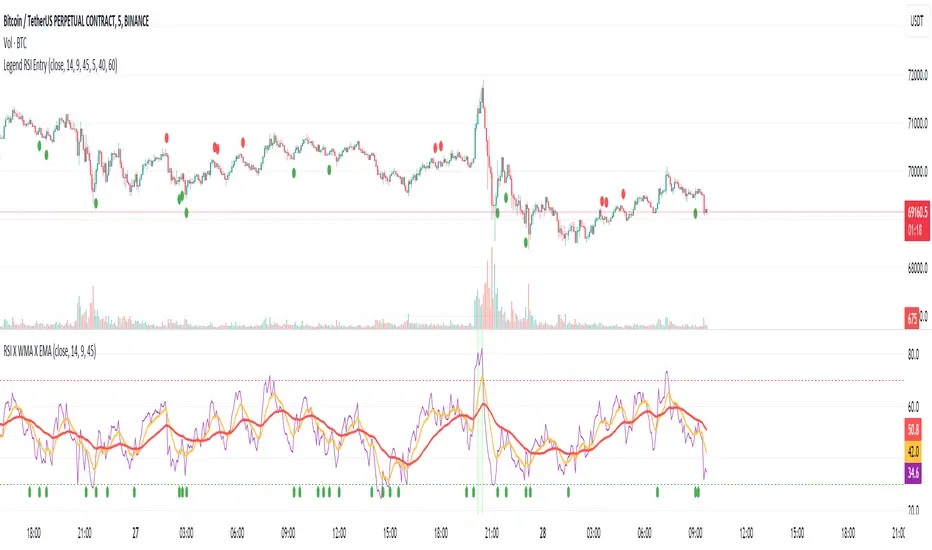
Entry Buy/Sell with Adjustable EMA-WMA Difference by Brian LeThe "Entry Buy/Sell with RSI-WMA Conditions" script, crafted by Brian Le, is a specialized TradingView indicator designed for traders who seek to capitalize on specific RSI (Relative Strength Index) crossover events relative to key moving averages, specifically the EMA (Exponential Moving Average) and WMA (Weighted Moving Average). This tool is particularly useful for identifying potential entry points in a trading strategy, marked by distinctive visual signals on the chart.
Key Features:
Customizable Timeframes and Lengths: Users can adjust the lengths of the RSI, EMA, and WMA, making the indicator versatile across various timeframes and trading styles.
RSI Crossover Signals: The script generates signals based on the RSI crossing over the EMA. A green dot signifies a potential buy signal when the RSI crosses above the EMA, while a red dot indicates a potential sell signal when the RSI crosses below the EMA.
Special Conditions Based on WMA: The indicator enhances decision-making by including the WMA in its analysis. Buy signals (green dots) are only shown when the RSI is below the WMA, and sell signals (red dots) are displayed when the RSI is above the WMA. This additional condition helps in filtering out less probable trades.
EMA and WMA Difference Filter: A unique feature of this script is the ability to set a minimum point difference between the EMA and WMA, adding another layer of specificity to the generated signals.
RSI Threshold Filters: The indicator includes optional filters to show signals only when the RSI is above 40 (for buy signals) or below 60 (for sell signals), aiding in avoiding overbought or oversold conditions.
Enhanced Visuals for Significant Events: For more prominent trading events, such as the RSI crossing both the EMA and WMA within a single candle, the script plots larger symbols (triangles), making these significant events stand out on the chart.
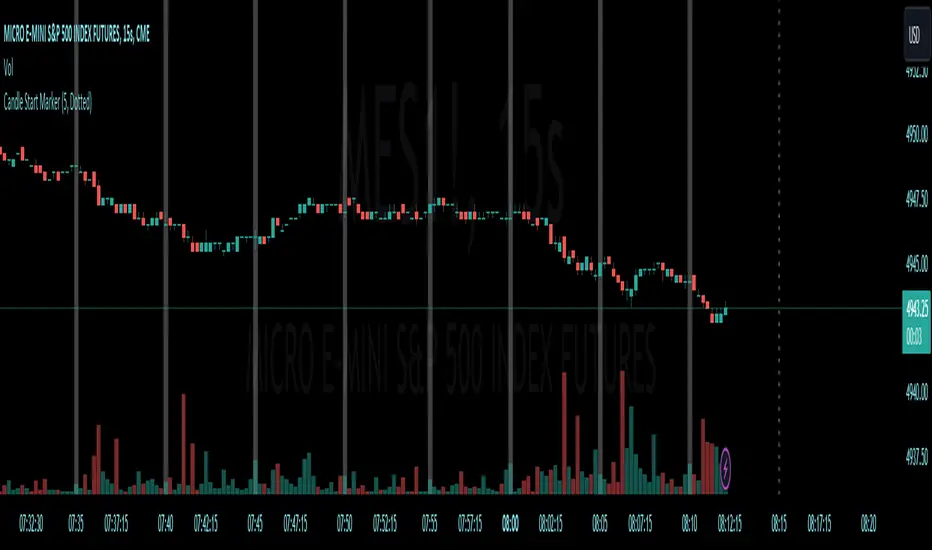
[CS] HTF Candle Start MarkerHello Traders!
I was using this script personally and thought it may be helpful to others that trade much lower timeframes. This script is particularly useful for traders who monitor price movements across multiple timeframes or need to synchronize their strategies with the start of new candle open.
Features:
User-Selectable Timeframe : Users can select the desired timeframe for the candle start marker, ranging from 1 to 60 minutes.
Start-of-Period Visualization : The indicator works by highlighting the background color at the start of each new candle for the chosen timeframe. This visual cue is particularly helpful for identifying the commencement of new trading intervals on lower timeframe charts.
Intelligent Timeframe Adaptation : A unique feature of this indicator is its ability to disable the marking on charts where the selected timeframe is equal to or higher than the chart's current timeframe. This ensures that the marker is only active when it provides meaningful information, avoiding redundancy on higher timeframe charts.
Usage:
This indicator is ideal for low time frame traders and those employing multi-timeframe analysis. It helps in quickly identifying the start of new time intervals. For example I trade the 15 second timeframe and mark the start of every 5 minute candle.
Volume-Trend Sentiment (VTS) [AlgoAlpha]Introducing the Volume-Trend Sentiment by AlgoAlpha, a unique tool designed for traders who seek a deeper understanding of market sentiment through volume analysis. This innovative indicator offers a comprehensive view of market dynamics, blending volume trends with price action to provide an insightful perspective on market sentiment. 🚀📊
Key Features:
1. 🌟 Dual Trend Analysis: This indicator combines the concepts of price movement and volume, offering a multi-dimensional view of market sentiment. By analyzing the relationship between the closing and opening prices relative to volume, it provides a nuanced understanding of market dynamics.
2. 🎨 Customizable Settings: Flexibility is at the core of this indicator. Users can adjust various parameters such as the length of the volume trend, standard deviation, and SMA length, ensuring a tailored experience to match individual trading strategies.
3. 🌈 Visual Appeal: With options to display noise, the main plot, and background colors, the indicator is not only informative but also visually engaging. Users can choose their preferred colors for up and down movements, making the analysis more intuitive.
4. ⚠️ Alerts for Key Movements: Stay ahead of market changes with built-in alert conditions. These alerts notify traders when the Volume-Trend Sentiment crosses above or below the midline, signaling potential shifts in market momentum.
How It Works:
The core of the indicator is the calculation of the Volume-Trend Sentiment (VTS). It is computed by subtracting a double-smoothed Exponential Moving Average (EMA) of the price-volume ratio from a single EMA of the same ratio. This method highlights the trend in volume relative to price changes.
volumeTrend = ta.ema((close - open) / volume, volumeTrendLength) - ta.ema(ta.ema((close - open) / volume, volumeTrendLength), volumeTrendLength)
To manage volatility and noise in the volume trend, the indicator employs a standard deviation calculation and a Simple Moving Average (SMA). This smoothing process helps in identifying the true underlying trend by filtering out extreme fluctuations.
standardDeviation = ta.stdev(volumeTrend, standardDeviationLength) * 1
smoothedVolumeTrend = ta.sma(volumeTrend / (standardDeviation + standardDeviation), smaLength)
A unique feature is the dynamic background color, which changes based on the sentiment level. This visual cue instantly communicates the market's bullish or bearish sentiment, enhancing the decision-making process.
getColor(volumeTrendValue) =>
sentimentLevel = math.abs(volumeTrendValue * 10)
baseTransparency = 60 // Base transparency level
colorTransparency = math.max(90 - sentimentLevel * 5, baseTransparency)
volumeTrendValue > 0 ? color.new(upColor, colorTransparency) : color.new(downColor, colorTransparency)
bgcolor(showBackgroundColor ? getColor(smoothedVolumeTrend) : na)
In summary, the Volume-Trend Sentiment by AlgoAlpha is a comprehensive tool that enhances market analysis through a unique blend of volume and price trends. Whether you're a seasoned trader or just starting out, this indicator offers valuable insights into market sentiment and helps in making informed trading decisions. 📈📉🔍🌐

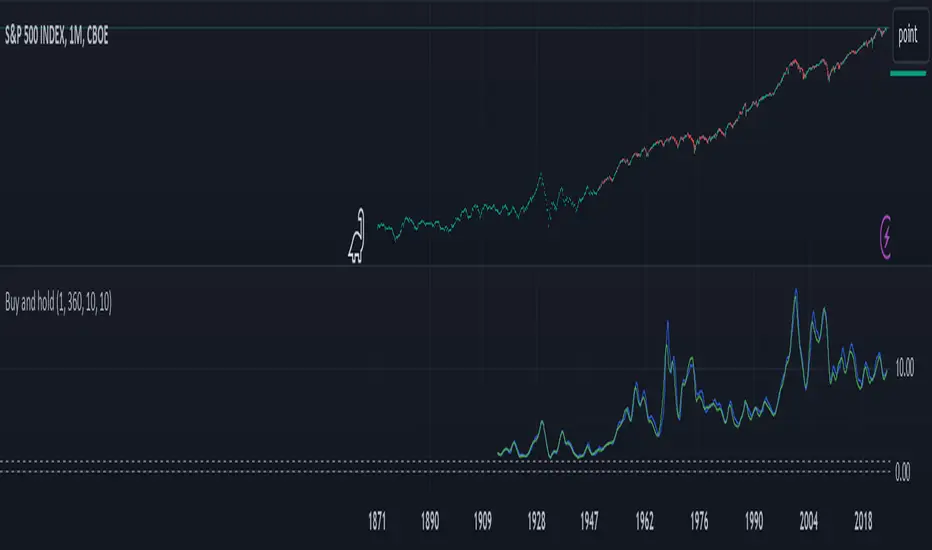
Buy and hold visualiserThis indicator shows the historical performance of a buy and hold portfolio. The purpose of the indicator is to show
1. the effect of the hold time (time between buying and selling a number of instruments) and
2. the effect of investing all capital at once (lump sum) versus dividing the investment over a number of months or years (cost averaging).
The indicator shows four lines:
- a dotted line at 0 (dollar or any other currency),
- a dotted line at the level of initial investment,
- a blue line that shows the amount of capital after selling at the end of the investment period after a lump sum investment,
- a green line that shows the amount of capital after selling at the end of the investment period after an investment that was done in chunks (cost averaging)
When 'chunks' is set to 1, the green line will match the blue line.
When 'investment' is set to 1, the blue and green lines will show the factor by which the initial investment was multiplied at the end of the investment period.
The effect of the hold time can be easily seen in the following example: Choose SPX (CBOE) as the active instrument, set 'chunks' to 1 and 'months' to 12. Depending on when you bought your portfolio, selling it a year later is like tossing a coin. Set 'months' to 360 and it becomes clear that it doesn't matter when you buy, the value of your portfolio will likely multiply considerably in 30 years, even if you bought everything all at once just before a bear market. It shows that with a long time horizon, you don't have to worry about timing the market.
Continue the example above and set 'chunks' to 12, thus spreading the initial investment over 12 months. The green line shows the cost averaging performance. The blue lump sum line is above the green line most of the time. Increase the chunks to 60 and the difference increases.
Price at time (sub-bar resolution)This simple script shows you the price at a fixed sub-bar time, and is useful for back-testing.
For example, if your strategy is to enter buy stops overnight and check your positions at lunch the next day, then use this indicator to highlight the opening price of the 3rd 60-minute bar. The default is the open price of the second 30-minute bar ("10 am").

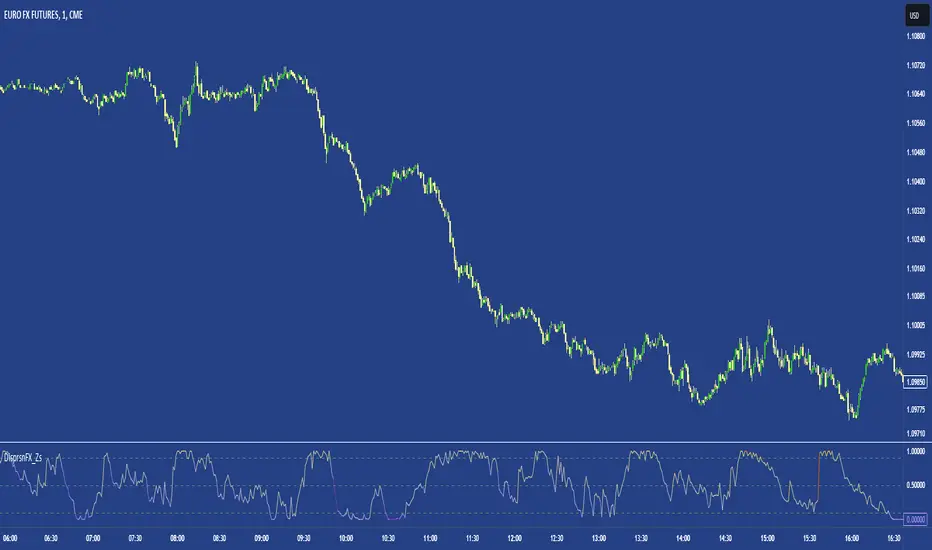
FX DispersionThis script calculates the dispersion of a basket of 5 FX pairs and then calculates the z-score the z-score is then made into a composite using the 30 and 60 ema of the z-score to smooth any noise. It must be used on one of the FX pairs in the basket and on the 1-minute timeframe as it has been hardcoded for 1 min use below.
Interpretation - Dispersion is a component of volatility - the dispersion of the underlying basket increases above 0.5 and decreases below 0.5.
Although increased dispersion is beneficial to momentum and trend-following strategies on the monthly and weekly timeframes. Observe this on the 1-minute timeframe and how dispersion crossing above/ below 0.5 it can signal reversion or momentum for the next period.
Delta price table, BTC Status (track bitcoin price change)If you are trading alt coins which are affected with Bitcoin price movements then this indicator may be useful. It allows you to trade altcoin and track bitcoin price changes simultaneously.
It shows the price change (delta price) for last 60 seconds, 5 minutes, 15 minutes, 30 minutes, 1 hour, 4 hours, 1 day.
If you want any updates, just feel free to write me :)

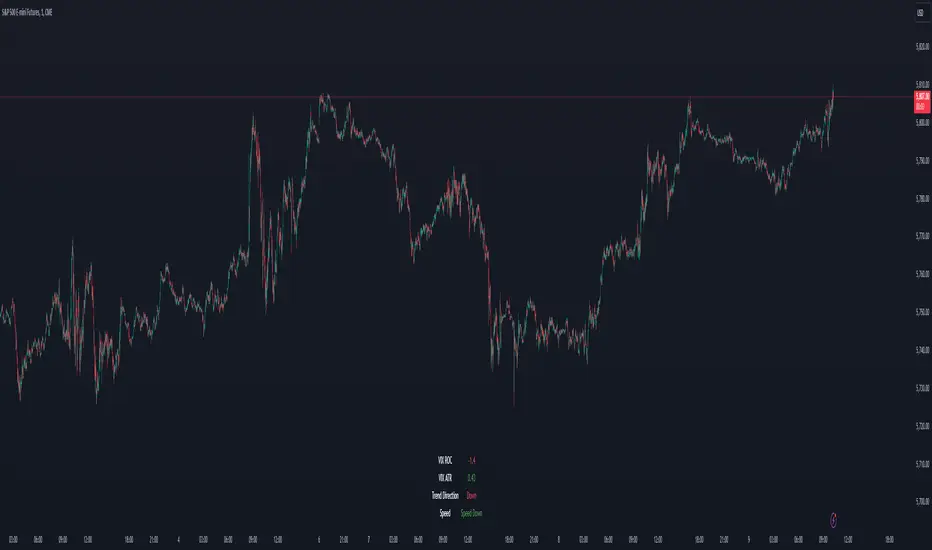
VIX Dashboard [NariCapitalTrading]Overview
This VIX Dashboard is designed to provide traders with a quick visual reference into the current volatility and trend direction of the market as measured by CBOE VIX. It uses statistical measures and indicators including Rate of Change (ROC), Average True Range (ATR), and simple moving averages (SMA) to analyze the VIX.
Components
ATR Period : The ATR Period is used to calculate the Average True Range. The default period set is 24.
Trend Period : This period is used for the Simple Moving Average (SMA) to determine the trend direction. The default is set to 48.
Speed Up/Down Thresholds : These thresholds are used to determine significant increases or decreases in the VIX’s rate of change, signaling potential market volatility spikes or drops. These are customizable in the input section.
VIX Data : The script fetches the closing price of the VIX from a specified source (CBOE:VIX) with a 60-minute interval.
Rate of Change (ROC) : The ROC measures the percentage change in price from one period to the next. The script uses a default period of 20. The period can be customized in the input section.
VIX ATR : This is the Average True Range of the VIX, indicating the daily volatility level.
Trend Direction : Determined by comparing the VIX data with its SMA, indicating if the trend is up, down, or neutral. The trend direction can be customized in the input section.
Dashboard Display : The script creates a table on the chart that dynamically updates with the VIX ROC, ATR, trend direction, and speed.
Calculations
VIX ROC : Calculated as * 100
VIX ATR : ATR is calculated using the 'atrPeriod' and is a measure of volatility.
Trend Direction : Compared against the SMA over 'trendPeriod'.
Trader Interpretation
High ROC Value : Indicates increasing volatility, which could signal a market turn or increased uncertainty.
High ATR Value : Suggests high volatility, often seen in turbulent market conditions.
Trend Direction : Helps in understanding the overall market sentiment and trend.
Speed Indicators : “Mooning” suggests rapid increase in volatility, whereas “Cratering” indicates a rapid decrease.
The interpretation of these indicators should be combined with other market analysis tools for best results.
RSI Graphique and Dashboard MTFMTF RSI Indicator - User Guide
Introduction:
The MTF RSI (Multi-Timeframe Relative Strength Index) Pine Script is designed to provide traders with a comprehensive view of the RSI (Relative Strength Index) across multiple timeframes. The script includes a primary chart displaying RSI values and a dashboard summarizing RSI trends for different time intervals.
Installation:
Copy the provided Pine Script.
Open the TradingView platform.
Create a new script.
Paste the copied code into the script editor.
Save and apply the script to your chart.
Primary Chart:
The primary chart displays RSI values for the selected timeframe (5, 15, 60, 240, 1440 minutes).
different color lines represent RSI values for different timeframes.
Overbought and Oversold Levels:
Overbought levels (70) are marked in red, while oversold levels (30) are marked in blue for different timeframes.
Dashboard:
The dashboard is a quick reference for RSI trends across multiple timeframes.
Each row represents a timeframe with corresponding RSI trend information.
Arrows (▲ for bullish, ▼ for bearish) indicate the current RSI trend.
Arrow colors represent the trend: blue for bullish, red for bearish.
Settings:
Users can customize the RSI length, background color, and other parameters.
The background color of the dashboard can be adjusted for light or dark themes.
Interpretation:
Bullish Trend: ▲ arrow and blue color.
Bearish Trend: ▼ arrow and red color.
RSI values above 70 may indicate overbought conditions, while values below 30 may indicate oversold conditions.
Practical Tips:
Timeframe Selection: Consider the trend alignment across different timeframes for comprehensive market analysis.
Confirmation: Use additional indicators or technical analysis to confirm RSI signals.
Backtesting: Before applying in live trading, conduct thorough backtesting to evaluate the script's performance.
Adjustment: Modify settings according to your trading preferences and market conditions.
Disclaimer:
This script is a tool for technical analysis and should be used in conjunction with other indicators. It is not financial advice, and users should conduct their own research before making trading decisions. Adjust settings based on personal preferences and risk tolerance. Use the script responsibly and at your own risk.

Back Week For BacktestIt is Backtest Calculator For Essential and Plus plan holders, the length of available intraday data is calculated as follows: from now to 6 weeks back multiplied by timeframe(in minutes), i.e. you can go 6 weeks back on the 1-minute chart, 12 weeks back on the 2-minute chart, 30 weeks back on the 5-minute chart, 90 weeks back on the 15-minute chart and so on. The higher timeframe is selected, the more intraday data is available.
This show creates a weekday label based on the data in the plans allowed by TradingView. This show creates a weekday label based on the data in the plans allowed by TradingView. How much data is available for Bar Replay? According to the article, we can replay 6 weeks backwards for a 1-minute chart. This indicator is a label that shows how far we can go back, consisting of multiplying each minute by 6 between 1 minute and 60 minutes.
1 minute => 6 week backtest
2 minutes => 12 week backtest
.....
15 minutes => 90 week backtest
...
59 minutes => 354 week backtest

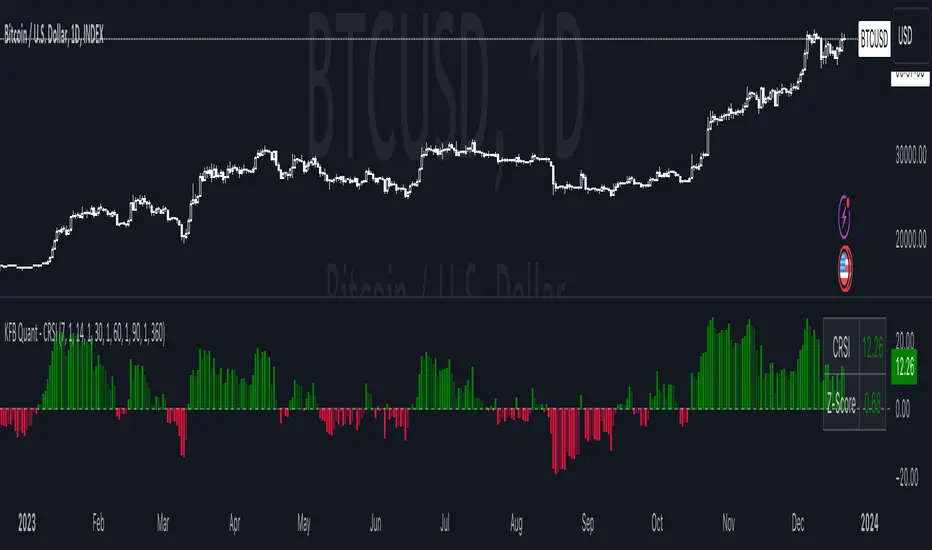
Composite RSI [KFB Quant]The Composite RSI (CRSI) is a momentum oscillator that combines 5 adjustable RSI's. It also has a Z-Score to make it easier to identify potential market extremes.
How to adjust the indicator
Inside the Length & Impact Configuration tab you can adjust the length and impact of each RSI as well as the Z-Score length specific to your needs. The default length inputs are 7, 14, 30, 60, 90 (RSI 1 - RSI 5) and the default impact is set to 1.0 for all RSI's. Default length for Z-Score is 360.
Inside the Style Configuration tab you can pick what you want to display(plot). The options are: CRSI, Z-Score, Overview Table and the individual RSI's.
Inside the Color Configuration tab you can customize the color of each plot.
How the script works
CRSI = rsi_sum / imp_sum
Z-Score = (crsi - crsi_mean) / crsi_stdev
rsi_sum = (rsi_1 -50) + (rsi_2 -50) + (rsi_3 -50) + (rsi_4 -50) + (rsi_5 -50)
imp_sum = imp_1 + imp_2 + imp_3 + imp_4 + imp_5
crsi_mean = Average of the crsi over the defined period in Z-Score Length
crsi_stdev = StDev of crsi over the defined period in Z-Score Length
This is not financial advice. Trading is risky & most traders lose money. Past performance does not guarantee future results. This indicator is for informational & educational purposes only.
SentinelsSentinels is a playful variation on combining different mean averages (MA).
A cross of 2 user-defined MA's (MA 1 & MA 2) initiates the drawing of a sentinel with tentacles, which, on its turn can provide potential support/resistance or entry/stop-loss/take profit zones.
The type of each MA (MA 1, MA 2 and tentacles) can be chosen from following options:
SMA
EMA
SMMA (RMA)
HullMA
WMA
VWMA
DEMA
TEMA
🔹 Examples
Fast & slow MA: HullMA, Tentacles: TEMA
Fast & slow MA: SMA, Tentacles: WMA
Fast & slow MA: WMA, Tentacles: WMA
Fast & slow MA: TEMA, Tentacles: TEMA
🔶 DETAILS
🔹 Head-Body
The head-body is formed by:
the slow MA when there is a crossunder.
the fast MA when there is a crossover.
The color of the head-body is a gradient which can be set. The color of the tentacles (non-gradient) can be set as well.
The head-body of the sentinel will be visible for maximum 60 bars after a cross has occured.
🔹 Tentacles
The length of the 'Tentacles' is calculated by taking the difference between the length of MA 1 and MA 2 , and dividing this by 6 -> diff .
The length of each tentacle is MA 1 + a multiple of diff .
The tentacles will only begin to show from 2 bars after a cross.
Each tentacle will be shown maximum x bars after the cross:
Tentacle 1: 15 bars
Tentacle 2: 20 bars
Tentacle 3: 25 bars
Tentacle 4: 30 bars
Tentacle 5: 35 bars
Tentacle 6: 40 bars
🔹 Switch lengths
By switching lengths the colors get switched too.
Note that the tentacles act differently though.
In that way, this can be an extra option to visualize the tentacles .
🔶 Happy Holidays
Merry Christmas and a Happy New Year!

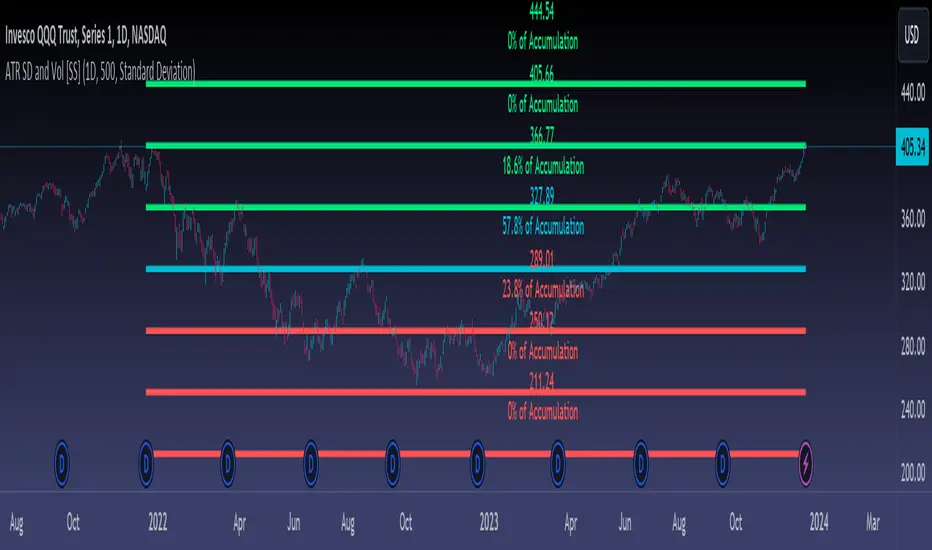
ATR Range Accumulation by Standard Deviation and Volume [SS]So, this is an indicator/premise I have been experimenting with, which mixes ATR with Z-Score and Volume metrics.
What does the indicator do?
The indicator, on the lower timeframes, uses an ATR approach to determine short-term ranges. It takes the average ATR range over a designated lookback period and plots out the levels like so:
It then calculates the Z-Score for these ATR targets (shown in the chart above) and calculates, over the designated lookback period, how often price accumulates at that standard deviation level.
The indicator is essentially a hybrid of my Z-Score Support and Resistance indicator and my frequency distribution indicator. It combines both concepts into one.
You also have the option of sorting by volume accumulation. This will display the accumulation of the ranges by volume accumulation, like so:
Larger Timeframes:
If you want to see the accumulation by volume or standard deviation on the larger timeframes, you can. Simply toggle on your preferred setting:
Show Total Accumulation Breakdown:
This will break down the levels, over the lookback period, by standard deviation. This is similar to the Z-Score support and resistance indicator. It will then show you how often price accumulates at these various standard deviation levels. Here is an example on the daily timeframe using the 1D chart settings:
Inversely, you can repeat this, with the Z-Score levels, but show accumulation by volume. This will print 5 boxes, which are between +3 Standard Deviations and -3 Standard Deviations, like so:
Here we can see that 61% of volume accumulation is between -1 and 1 standard deviation.
Using it to Trade:
For swing trading, I suggest using the larger timeframe information. However, for both swing and day traders, it is also helpful to use the ATR display. You can modify the ATR display to show the levels on any timeframe by selecting which timeframe you would like to see ATR ranges for. If you are trading on the 1 or 5-minute chart, I suggest leaving the levels at no shorter than a 60-minute timeframe.
You can also use these levels on the daily for the weekly levels, etc.
The accumulation being shown will be based on the current chart timeframe. This is a function of Pinescript, but in this case, it's actually advantageous because if you are trading on the shorter timeframe, and a level has 0% recent accumulation, it's unlikely we will see that level soon or overly quickly. Intraday retracements will generally happen to areas of high accumulation.
How this indicator is different:
The difference in this indicator comes from its focus on accumulation in relation to Standard Deviation. There is one thing that is consistent among retail traders, algorithms, market makers, and funds, and that is looking at the market in terms of standard deviation. Each person, market maker, and algorithm may be slightly nuanced in how it conceptualizes standard deviation (whether it be since the inception of the ticker (or IPO), or the previous 500 days, or the previous 100 days, etc.), but the premise remains consistent. Standard Deviation is a really important, if not the most important, metric to pay attention to. Another important metric is volume. Thus, the premise is that combining volume accumulation with standard deviation should, theoretically, be telling. We can see the extent of buying at various standard deviations and whether a stock is really a buy or not.
And that's the indicator! Hope you enjoy it. Leave your comments and questions below.
Safe trades!
Mike's Crossover BotGreetings! As a newcomer to coding, I've developed a simple trading bot for experimentation purposes. However, it's important to note that this bot has not undergone rigorous testing, so please exercise caution and use it at your own risk.
Bot Overview:
The bot operates by leveraging two technical indicators: Moving Average Convergence Divergence (MACD) with 7-day and 25-day parameters, and the Relative Strength Index (RSI). These indicators help identify potential buying and selling opportunities in the market.
MACD Crossovers:
The MACD is a trend-following momentum indicator that compares short-term and long-term moving averages. In our bot, we look for crossovers between the 7-day and 25-day MACD lines. A crossover occurs when these lines intersect, suggesting a potential change in market direction.
RSI Confirmation:
To refine our signals, we incorporate the Relative Strength Index (RSI). When a MACD crossover happens, the bot checks if the RSI is below 40. If it is, a buy signal is generated, indicating a potential undervalued condition. Conversely, when the RSI is above 60 during a crossover, a sell signal is triggered, suggesting a potentially overvalued condition.
Important Considerations:
New Coder Disclaimer: This bot is designed for educational purposes, especially for those who are new to coding. It serves as a learning tool and is not intended for live trading without proper testing.
Risk Awareness: Trading always involves risks, and the bot's performance has not been thoroughly tested in live market conditions. It's crucial to exercise caution and be aware of the inherent risks associated with financial markets.
Continuous Learning: Coding and algorithmic trading are dynamic fields. As you explore this bot, consider it a starting point for learning and continuously seek to enhance your understanding and skills in coding and trading strategies.
Remember, the success of any trading strategy depends on various factors, and past performance is not indicative of future results. Always conduct thorough testing before considering any automated strategy for live trading.

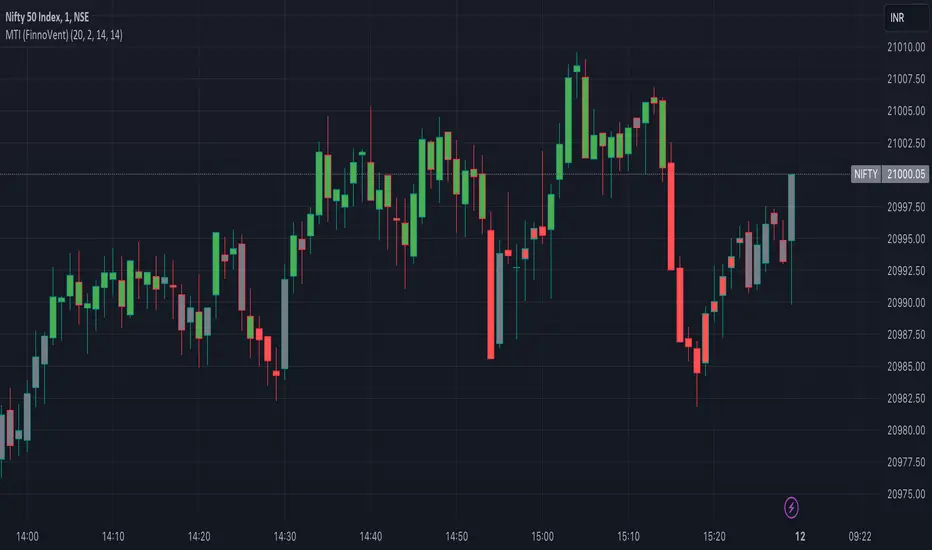
Market Trend Indicator (FinnoVent)The Market Trend Indicator (FinnoVent) is a comprehensive trading tool designed to provide clear visual cues for market trends on TradingView charts. This indicator combines the principles of Exponential Moving Averages (EMAs), Bollinger Bands, the Average Directional Index (ADX), and the Relative Strength Index (RSI) to offer a nuanced view of market movements.
How It Works:
Trend Identification with EMAs: The indicator uses two EMAs (3-period and 30-period) to identify the primary trend. An upward trend is signaled when the 3-period EMA crosses above the 30-period EMA, while a downward trend is indicated when the 3-period EMA crosses below the 30-period EMA.
Sideways Market Detection: To identify sideways trends, the indicator employs Bollinger Bands, ADX, and RSI. A sideways (or consolidating) market condition is identified when:
The price is between the middle 60% of the Bollinger Bands (avoiding the top and bottom 20%).
The ADX is below 30, indicating a lack of a strong trend.
The RSI is between 40 and 60, suggesting a neutral market momentum.
Visual Representation:
Bar Colors: The indicator colors the price bars on the chart based on the identified trend:
Green Bars: Indicate an upward trend.
Red Bars: Indicate a downward trend.
Grey Bars: Indicate a sideways or consolidating market.
How to Use:
Trend Following: Use the colored bars as a guide for trend following. Green bars suggest a potential entry for a long position, while red bars may indicate opportunities for short positions.
Sideways Market Caution: Grey bars signal a sideways market. In such conditions, traders might exercise caution and avoid trend-following strategies, as the market lacks a clear direction.
Complementary Analysis: While the Market Trend Indicator (FinnoVent) provides valuable insights, it's recommended to use it in conjunction with other forms of analysis (like fundamental analysis, other technical indicators, or price action) for comprehensive decision-making.
Suitable for: This indicator is versatile and can be applied to various timeframes and trading instruments, including stocks, forex, commodities, and indices.
Important Notes:
The indicator is designed to minimize repainting but always consider the latest data for the most accurate analysis.
Like all indicators, it is not foolproof. It works best when combined with a solid trading plan and risk management strategies.
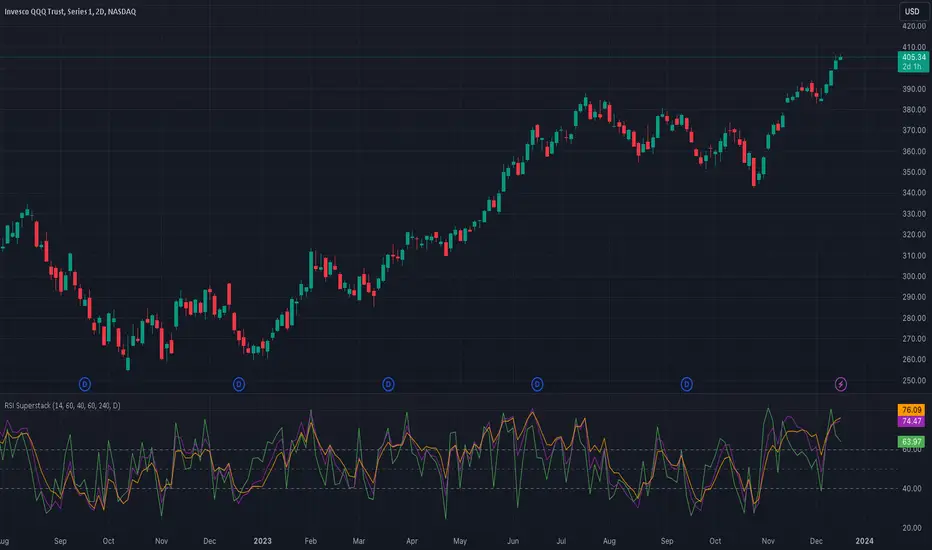
RSI SuperstackThis script integrates three Relative Strength Index (RSI) indicators across multiple time frames, providing a comprehensive overview of oversold and overbought conditions. This holistic approach enhances the precision of entry and exit points on shorter time frames.
As a momentum indicator, the Relative Strength Index assesses a security's strength during upward and downward price movements within the specified time period.
In a broader context, an upward slope in all indicators (green, purple, and orange) signifies an increasing market momentum, suggesting a potential continuation of the upward trend.
More specifically, a collective upward slope reaching or surpassing the 40 level in all indicators serves as a buy signal. Conversely, a uniform downward slope descending to or below the 60 level in all indicators constitutes a sell signal.
The default time frames for analysis include:
- 1 Hour (1H)
- 4 Hours (4H)
- Daily (D)
It is imperative to note that this indicator should not serve as the sole determinant for initiating long or short positions. Instead, it is recommended to consider it as part of a broader analysis, incorporating factors such as trend analysis and significant support levels.
Disclaimer: The utilization of this indicator should complement a comprehensive analysis and not be solely relied upon for decision-making regarding long or short positions.
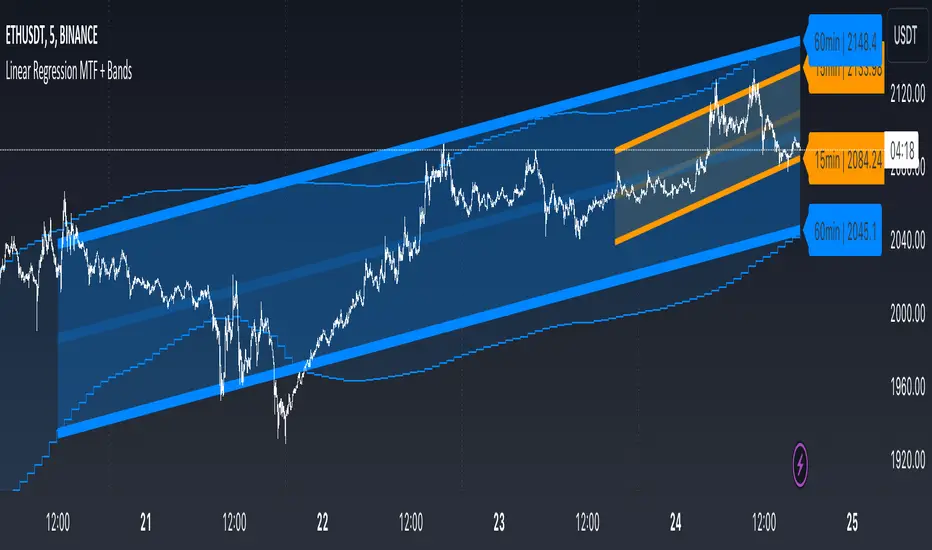
Linear Regression MTF + Bands
Multiple Time Frames (MTFs): The indicator allows you to view linear regression trends over three different time frames (TF1, TF2, TF3) simultaneously. This means a trader can observe short, medium, and long-term trends on a single chart, which is valuable for understanding overall market direction and making cross-timeframe comparisons.
Linear Regression Bands: For each time frame, the indicator calculates linear regression bands. These bands represent the expected price range based on past prices. The middle line is the linear regression line, and the upper and lower lines are set at a specified deviation from this line. Traders can use these bands to spot potential overbought or oversold conditions, or to anticipate future price movements.
History Bands: Looking at linear regression channels can be deceiving if the user does not understand the calculation. In order to see where the channel was at in history the user can display the history bands to see where price actual was in a non-repainting fashion.
Customization Options: Traders can customize various aspects of the indicator, such as whether to display each time frame, the length of the linear regression (how many past data points it considers), and the deviation for the bands. This flexibility allows traders to adapt the indicator to their specific trading style and the asset they are analyzing.
Alerts: The script includes functionality to set alerts based on the price crossing the upper or lower bands of any time frame. This feature helps traders to be notified of potential trading opportunities or risks without constantly monitoring the chart.
Examples
The 15minute linear regression is overlayed onto a 5 minute chart. We are able to see higher timeframe average and extremes. The average is the middle of the channel and the extremes are the outer edges of the bands. The bands are non-repainting meaning that is the actual value of the channel at that place in time.
Here multiple channels are shown at once. We have a linear regression for the 5, 15, and 60 minute charts. If your strategy uses those timeframes you can see the average and overbought/oversold areas without having to flip through charts.
In this example we show just the history bands. The bands could be thought of as a "don't diddle in the middle" area if your strategy is looking for reversals
You can extend the channel into the future via the various input settings.