Cari dalam skrip untuk "市值60亿的股票"

Real-time price distribution in candlesThis indicator splits the candle time into 30 units to indicate where the price was at each time.
In the case of a 1-hour time zone, 60 minutes / 30 = 2 minutes, so this display the location of the price every 2 minutes.
In case of 1 minute time zone, it is displayed every 2 seconds.
CAUTION
If a transaction does not occur, the display may be omitted.
You can change the color of the opening and closing prices and the size of the dots.

Price Action in action
What?
Price Action in Action is an indicator to help Price Action learners and practitioners to get everything related for Price Action in one place.
Price Action is:
Price + Volume = Action
In this indicator, we have the following features available:
Support/Resistance
Using the RSI with different periods in a multiple of 7 (7, 14, 21, 28), we first determine the overbought (above 70, customizable) and oversold (below 30, customizable) regions. Then we pick up the highest point and lowest point in the RSI values in the overbought and oversold regions, respectively. These are the point, historically supply/demand emerged for surety to push down/up the RSI indicator and the corresponding price. So, these are the most accurate way, we believe, to draw support/resistance (or demand/supply) in the chart. By default, the Support is green color and Resistance is red color. To give a visual representation, we differentiate the different shades of green and red. For example, for Level-1 (i.e. 7 by default) we use the darkest shade (0 transparency) and Level-4 (i.e. 28 by default) we use lighter shade (60 transparency). Note please: you can customize the color of support and resistance lines (say if you want resistance as green and support as red). The respective shades (transparency) will be automatically adjusted accordingly. But those shade (transparency) levels are not customizable, they are fixed (please bear with it for version-1 at least).
Strength of Support/Resistance
In the chart above/below the Resistance / Support lines you can see the tiny labels with some numbers like 1, 2.
We found out how many times a particular support/resistance is appearing across multiple RSI periods. E.g. if price P1 appears 2 times among 4 different RSI periods, the number will be 2 for that calculation, and so on.
There can be multiple presence of these numbers in a support/resistance line (i.e. multiple tiny labels). Something like: 1, 1, 2 (into different candles). This means the same support/resistance is tested so many times in different occasion (means there is a RSI max/min coincides in this level over multiple occasions) at different candles.
This will help you to intuitionally gauge the “strength” of a support/resistance line.
The more the marrier, unworthy to mention.
Candle Stick Patterns
Well: we don’t need to tell anything about the Candlestick. All of you know it better than us. And it’s a time proven, zero-lag mechanism to judge the Price-Action is unfolding in the market. We do not know if there is anything better possible than this time tested patterns to judge the prevailing sentiments of market.
Price-Action does not complete without finding out the Candlestick Patterns correctly.
And in this indicator your will get all of these: Single Candle such as Doji (default off), Marubozu, Spinner, hammers, inverted-hammer etc. ; 2 candles like Tweezer, Inside Candle, Engulfing; 3 candles like morning star/evening star.
In the multi candle patterns (2/3 candles), we are grouping the candles with a dotted rectangle such that it is clear which 2/3 candles are part of the pattern. E.g. Morning Star: 3 candles are grouped in a dotted rectangle and the Morning Star label will come to the latest candle (3rd most – as the pattern is detected reliably only on the completion of the 3rd final candle).
Of course, any program can not eliminate your trained eyes and brain to capture the patterns. But we have provided sufficient knobs to adjust various parameters to tweak the candle-pattern detection. Such as Strict Inside Candle(Harami) Boolean knob where the whole current candle including wicks will be inside the body part of the previous big candle. For non-strict mode, the current candle just inside the previous candle, possibly by wicks.
To make it better usable, for every such knobs (which are not obvious) we have added user-friendly tooltip (just mouse hover the question mark (?) besides the control/switch). There are plenty of it.
Volume
Here we have a rudimentary (yet effective) way to judge the volumes.
We find out the Volume Weighted Moving Average (VMWA) of the 20-period (default, but customizable) and the latest volume. If the latest volume is more than the 20 period vwma, we just add a grey diamond on the top of the candle to denote it’s attracting volumes. Of course, we provide a Weight coefficient (default is set to 1). So if the current bar’s volume on bar’s completion is more than the 20 period volume vmwa times the weigh-cofficient, we mark it with a tiny grey diamond.
Points to be noted:
In all places we mark the indication only on the completion of the bar (technically speaking we have checks, as far as possible, with barstate.isconfirmed). However, if you wish, you can turn it off for Candlestick (as some experts may want to check candlestick on the real time, even before the closing of bars).
In case if you see the chart looks cluttered (because of many information, specially in smaller timeframes like 5 min), there are controls given in the settings to toggle each and every features.
By default, we turn off Doji candles (all 3 types of Doji’s – normal, Gravestone & Dragonfly) as they are mainly indecision. However, you can toggle it to turn it on.
It does not give you any Buy/Sell call. The interpretation it does not have.
Why?
What’s unique in it?
As we already mentioned our intention is to include Price (in forms of Support / Resistance), Volume and Action (sentiments in terms of Candlestick patterns) into a single place. And so far, to the best of our knowledge, we could not come across a single indicator provides all of these.
There were works available to determine the RSI based support / resistance zones. Those are great piece works at that time (lets say 3 years back when PineScript was in earlier versions). To the best of our knowledge those does not cover up finding out the lowest / highest point of RSI and the corresponding price to get the simplistic and distinct support/resistance lines.
We have the intuitive support/resistance strength included which we could not found out in current set of available indicators.
To the best of our knowledge, there seems no indicator can detect 3-candle patterns which are extremely popular to detect trend reversals (such as Morning Star or Evening Star). Moreover for the multi-candle patterns we are grouping the candles part of the pattens (2-candles or 3-candles) using a dotted rectangle such that it’s visually clearly (and a well educative material for Price-Action learners also).
Mentions:
There are many works which inspire us along the way. Honestly: we sometimes forgot which all indicators we experimented with. We are sincerely apologetic in case we forgot to mention. A few note-worthy:
There is an indicator from user “repo32” named as “Candlestick Patterns Identified (updated 3/11/15)”. (We could not be able to contact “repo32”). We are inspired from his work that it’s feasible to detect Candlestick patterns.
There is an awesome work done by “RSI Based Automatic Demand and Supply” by user “shtcoinr”. The idea of consulting multiple RSI levels to find out the demand/supply zone we inspired from him. (We did contact “shtcoinr” and got his kind permission to use the concept.)
We are greatly thankful to these abovementioned wizards for their pioneering a-prior work in this front.
And of course, this TradingView platform to provide this abstraction, facilitates and felicitates collaborative contributions.
Ultimately, what’s for you?
That’s the main question. What’s for you?
Price-action comprises of following 3 tasks (at least):
Draw support/resistance lines in the chart.
Once price reaches at the support/resistance line, you fervently look out the candles’ formation to mentally map to the candle patterns. Your aim is divine: You want to judge if the price-action will continue or take a rejection/reversal.
Then you double-confirm with the volume (in a non-overlaid chart below).
Finally take a trade.
For a price-action newbie or seasoned, expert practitioner, you must be doing all the above tasks regularly and manually, in a mechanical, mundane way. There come the humanly subjectivity & the inevitable emotions . This indicator, being a piece of program/code in PineScript latest version v5 , eliminates (or at least, reduces to a great extend) that subjectivity & emotions out of the way of decision making . Thus resulting better yield.
Of course, you can argue that you draw slanted trend lines also. We recommend an already existing indicator by user LuxAlgo named as “Trendlines with Breaks ”, if you wish so.
Disclaimer:
This piece of software does not come up with any warrantee or any rights of not changing it over the future course of time.
We are not responsible for any trading/investment decision you are taking out of the outcome of this indicator.
Happy trading.

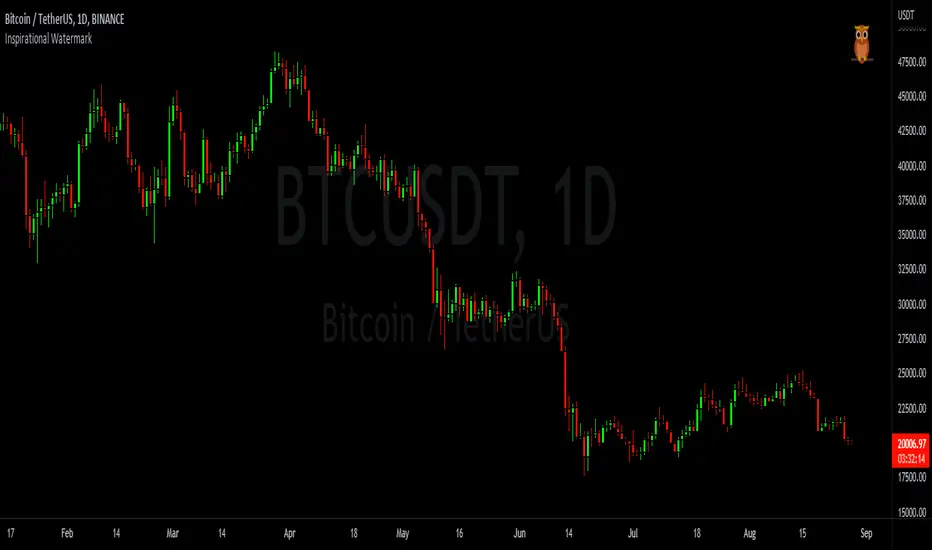
Inspirational WatermarkPreface: I wanted code that could display a different string of text whenever the bar changed. Viewing a long string of text on the chart can look messy & crowded, so the string of text is displayed as a tooltip when hoving over the user-customizable watermark text/emoji.
About the Indicator: This is a simple educational script where I hand-picked 60-ish quotes related to trading and included them as tooltips in a watermark indicator. The indicator includes a bank of preset quotes, and calls a random quote upon each bar change. Advantages of a watermark include claiming idea ownership as well as preventing simple copy-paste idea piracy/resale/repost. The trader can fully customize the on-screen watermark text. The trader has the option to display the watermark as either a table or a label. Tables are stationary but easy to crop out, while labels move around but are difficult to crop out. Choose the right watermark type depending on the level of idea ownership & protection you require.
Features: Fully customizable watermark type, text, size, color, and position.
‼ IMPORTANT: Hover over the watermark to read a famous trading quote that changes every candle. Consider moving this indicator to the front of the visual order.
⚠ DISCLAIMER: Not financial advice. Not a trading system. DYOR. I am not in any way affiliated with any of the quoted authors.
RSI OS/OS Levels MTFThis plots the overbought and oversold (70 and 30) levels from RSI on price, there are often levels where a market will bounce or retrace/reverse.
By default it shows 15 min, 60 min and 4 hour levels but I intend to make these configurable along with some other stuff. For now it works how I use it, nice and simple

Triple RSI strategyThis strategy is commonly used both in forex and stock markets for reversal trading. when the rsi line reaches and crosses simultaneously at 3 rsi setups i.e at 7, 14, and 21, a signal is generated.
This strategy works best in 1-hour timeframe. It provides over 60 to 80 percent accuracy in 1-hour timeframe.
In the stock market, this strategy provides an excellent entry point, if one is seeking small profits.
One can expect to make around 10 to 50 pips in the forex market easily. However, I advise seeking support from price action from the lower timeframe in the forex market.
I hope you like it.
Follow for more strategies and scripts like this.

Close v Open Moving Averages Strategy (Variable) [divonn1994]This is a simple moving average based strategy that works well with a few different coin pairings. It takes the moving average 'opening' price and plots it, then takes the moving average 'closing' price and plots it, and then decides to enter a 'long' position or exit it based on whether the two lines have crossed each other. The reasoning is that it 'enters' a position when the average closing price is increasing. This could indicate upwards momentum in prices in the future. It then exits the position when the average closing price is decreasing. This could indicate downwards momentum in prices in the future. This is only speculative, though, but sometimes it can be a very good indicator/strategy to predict future action.
What I've found is that there are a lot of coins that respond very well when the appropriate combination of: 1) type of moving average is chosen (EMA, SMA, RMA, WMA or VWMA) & 2) number of previous bars averaged (typically 10 - 250 bars) are chosen.
Depending on the coin.. each combination of MA and Number of Bars averaged can have completely different levels of success.
Example of Usage:
An example would be that the VWMA works well for BTCUSD (BitStamp), but it has different successfulness based on the time frame. For the 12 hour bar timeframe, with the 66 bar average with the VWMA I found the most success. The next best successful combo I've found is for the 1 Day bar timeframe with the 35 bar average with the VWMA.. They both have a moving average that records about a month, but each have a different successfulness. Below are a few pair combos I think are noticeable because of the net profit, but there are also have a lot of potential coins with different combos:
It's interesting to see the strategy tester change as you change the settings. The below pairs are just some of the most interesting examples I've found, but there might be other combos I haven't even tried on different coin pairs..
Some strategy settings:
BTCUSD (BitStamp) 12 Hr Timeframe : 66 bars, VWMA=> 10,387x net profit
BTCUSD (BitStamp) 1 Day Timeframe : 35 bars, VWMA=> 7,805x net profit
BNBUSD (Binance) 12 Hr Timeframe : 27 bars, VWMA => 15,484x net profit
ETHUSD (BitStamp) 16 Hr Timeframe : 60 bars, SMA => 5,498x net profit
XRPUSD (BitStamp) 16 Hr Timeframe : 33 bars, SMA => 10,178x net profit
I only chose these coin/combos because of their insane net profit factors. There are far more coins with lower net profits but more reliable trade histories.
Also, usually when I want to see which of these strategies might work for a coin pairing I will check between the different Moving Average types, for example the EMA or the SMA, then I also check between the moving average lengths (the number of bars calculated) to see which is most profitable over time.
Features:
-You can choose your preferred moving average: SMA, EMA, WMA, RMA & VWMA.
-You can also adjust the previous number of calculated bars for each moving average.
-I made the background color Green when you're currently in a long position and Red when not. I made it so you can see when you'd be actively in a trade or not. The Red and Green background colors can be toggled on/off in order to see other indicators more clearly overlayed in the chart, or if you prefer a cleaner look on your charts.
-I also have a plot of the Open moving average and Close moving average together. The Opening moving average is Purple, the Closing moving average is White. White on top is a sign of a potential upswing and purple on top is a sign of a potential downswing. I've made this also able to be toggled on/off.
Please, comment interesting pairs below that you've found for everyone :) thank you!
I will post more pairs with my favorite settings as well. I'll also be considering the quality of the trades.. for example: net profit, total trades, percent profitable, profit factor, trade window and max drawdown.
*if anyone can figure out how to change the date range, I woul really appreciate the help. It confuses me -_- *

Polynomial Regression Derivatives [Loxx]Polynomial Regression Derivatives is an indicator that explores the different derivatives of polynomial position. This indicator also includes a signal line. In a later release, alerts with signal markings will be added.
Polynomial Derivatives are as follows
1rst Derivative - Velocity: Velocity is the directional speed of a object in motion as an indication of its rate of change in position as observed from a particular frame of reference and as measured by a particular standard of time (e.g. 60 km/h northbound). Velocity is a fundamental concept in kinematics, the branch of classical mechanics that describes the motion of bodies.
2nd Derivative - Acceleration: In mechanics, acceleration is the rate of change of the velocity of an object with respect to time. Accelerations are vector quantities (in that they have magnitude and direction). The orientation of an object's acceleration is given by the orientation of the net force acting on that object.
3rd Derivative - Jerk: In physics, jerk or jolt is the rate at which an object's acceleration changes with respect to time. It is a vector quantity (having both magnitude and direction). Jerk is most commonly denoted by the symbol j and expressed in m/s3 (SI units) or standard gravities per second (g0/s).
4th Derivative - Snap: Snap, or jounce, is the fourth derivative of the position vector with respect to time, or the rate of change of the jerk with respect to time. Equivalently, it is the second derivative of acceleration or the third derivative of velocity.
5th Derivative - Crackle: The fifth derivative of the position vector with respect to time is sometimes referred to as crackle. It is the rate of change of snap with respect to time.
6nd Derivative - Pop: The sixth derivative of the position vector with respect to time is sometimes referred to as pop. It is the rate of change of crackle with respect to time.
Included:
Loxx's Expanded Source Types
Loxx's Moving Averages

Ultimate IndicatorThis is a combination of all the price chart indicators I frequently switch between. It contains my day time highlighter (for day trading), multi-timeframe long-term trend indicator for current commodity in the bottom right, customizable trend EMA which also has multi-timeframe drawing capabilities, VWAP, customizable indicators with separate settings from the trend indicator including: EMA, HL2 over time, Donchian Channels, Keltner Channels, Bollinger Bands, and Super Trend. The settings for these are right below the trend settings and can have their length and multiplier adjusted. All of those also have multi-timeframe capabilities separate from the trend multi-time settings.
The Day Trade Highlight option will draw faint yellow between 9:15-9:25, red between 9:25-9:45, yellow between 9:45-10:05. There will be one white background at 9:30am to show the opening of the market. while the market is open there will be a very faint blue background. For the end of the day there will be yellow between 15:45-15:50, red between 15:50-16:00, and yellow between 16:00-16:05. During the night hours, there is no coloring. The purpose of this highlight is to show the opening / closing times of the market and the hot times for large moves.
The indicators can also be colored in the following ways:
1. Simple = Makes all colors for the indicator Gray
2. Trend = Will use the Donchian Channels to get the short-trend direction and by default will color the short-term direction as Blue or Red. Unless using Super Trend, the Donchian Channel is used to find short-term trend direction.
3. Trend Adv = Will use the Donchian Channels to get the short-trend direction and by default will color the short-term direction as Blue or Red. Unless using Super Trend, the Donchian Channel is used to find short-term trend direction. If there is a short-term up-trend during a long-term down-trend, the Blue will become Navy. If short-term down-trend during long-term up-trend, the Red will be Brown.
4. Squeeze = Compares the Bollinger Bands width to the Keltner Channels width and will color based on relative squeeze of the market: Teal = no squeeze. Yellow = little squeeze. Red = decent squeeze. White = huge squeeze. if you do not understand this one, try drawing the Bollinger Bands while using the Squeeze color option and it should become more apparent how this works. I also recommend leaving the length and multiplier to the default 20 and 2 if using this setting and only changing the timeframe to get longer/shorter lengths as I've seen that changing the length or multiplier can more or less make it not work at all.
Along with the indicator settings are options to draw lines/labels/fills for the indicator. I enjoy having only fills for a cleaner look.
The Labels option will show Buy/Sell signals when the short-term trend flips to agree with the long-term trend.
The Trend Bars option will do the same as the Labels option but instead will color the bars white when a Buy/Sell option is given.
The Range Bars option shows will color a bar white when the Close of a candle is outside of a respective ranging indicator option (Bollinger or Keltner).
The Trend Bars will draw white candles no matter which indicator selection you make (even "Off"). However, Range Bars will only draw white when either Bollinger or Keltner are selected.
The Donchian Channels and Super Trend are trending indicators and should be used during trending markets. I like to use the MACD in conjunction with these indicators for possibly earlier entries.
The Bollinger Bands and Keltner Channel are ranging indicators and should be used during ranging markets. I like to use the RSI in conjunction with these indicators and will use 60/40 for overbought and oversold areas rather than 70/30. During a range, I wait for an overbought or oversold indication and will buy/sell when it crosses back into the middle area and close my position when it touches the opposite band.
I have a MACD/RSI combination indicator if you'd like that as well :D
As always, trade at your own risk. This is not some secret indicator that will 100% win. As always, the trades you see in the picture use a 1:1.5 or 1:2 risk to reward ratio, for today (August 8, 2022) it won 5/6 times with one trade still open at the end of the day. Manage your account correctly and you'll win in the long term. Hit me up with any questions or suggestions. Happy Trading!

OHL Screener by KiranScript is intended to scan Open = High and Open = Low (OHL) stocks for selected Opening Range in minutes.
I have added NSE NIFTY 50 stocks as default input for the script. Hopefully it will work with other stocks and exchanges.
Opening Range time is limited to the "1 min, 3 min, 5 min, 15 min, 30 min and 60 min" as OHL generally required for Intraday.
Stock qualified criteria OPEN = LOW (in selected Opening Range timeframe) will be listed in the table at TOP RIGHT corner of the chart screen in a green background.
Stock qualified criteria OPEN = HIGH (in selected Opening Range timeframe) will be listed in the table at BOTTOM LEFT corner of the chart screen in a red background.
Script scans stocks irrespective of current chart symbol and current time frame on the chart.
Limitations:
- Maximum 40 stocks can be scanned.
- request.security can't be placed under loop hence repeat call to request.security should be placed on separate line

RSI Mean Reversion StrategyThis is a scalping strategy designed to be used for crypto trading. It uses an Exponential Moving Average with a default length of 100 in order to identify the trend of the market. If the price is trading above 100, it will only take long trades, and vice versa for shorts. It places long orders when the RSI value closes below 40, and the price is also above the 100 EMA. It places short orders when the RSI value is above 60, and the price is below the 100 EMA.
*Note: for custom alert messages to be read, "{{strategy.order.alert_message}}" must be placed into the alert dialogue box when the alert is set.

CDC ActionZone BF for ETHUSD-1D © PRoSkYNeT-EE
Based on improvements from "Kitti-Playbook Action Zone V.4.2.0.3 for Stock Market"
Based on improvements from "CDC Action Zone V3 2020 by piriya33"
Based on Triple MACD crossover between 9/15, 21/28, 15/28 for filter error signal (noise) from CDC ActionZone V3
MACDs generated from the execution of millions of times in the "Brute Force Algorithm" to backtest data from the past 5 years. ( 2017-08-21 to 2022-08-01 )
Released 2022-08-01
***** The indicator is used in the ETHUSD 1 Day period ONLY *****
Recommended Stop Loss : -4 % (execute stop Loss after candlestick has been closed)
Backtest Result ( Start $100 )
Winrate 63 % (Win:12, Loss:7, Total:19)
Live Days 1,806 days
B : Buy
S : Sell
SL : Stop Loss
2022-07-19 07 - 1,542 : B 6.971 ETH
2022-04-13 07 - 3,118 : S 8.98 % $10,750 12,7,19 63 %
2022-03-20 07 - 2,861 : B 3.448 ETH
2021-12-03 07 - 4,216 : SL -8.94 % $9,864 11,7,18 61 %
2021-11-30 07 - 4,630 : B 2.340 ETH
2021-11-18 07 - 3,997 : S 13.71 % $10,832 11,6,17 65 %
2021-10-05 07 - 3,515 : B 2.710 ETH
2021-09-20 07 - 2,977 : S 29.38 % $9,526 10,6,16 63 %
2021-07-28 07 - 2,301 : B 3.200 ETH
2021-05-20 07 - 2,769 : S 50.49 % $7,363 9,6,15 60 %
2021-03-30 07 - 1,840 : B 2.659 ETH
2021-03-22 07 - 1,681 : SL -8.29 % $4,893 8,6,14 57 %
2021-03-08 07 - 1,833 : B 2.911 ETH
2021-02-26 07 - 1,445 : S 279.27 % $5,335 8,5,13 62 %
2020-10-13 07 - 381 : B 3.692 ETH
2020-09-05 07 - 335 : S 38.43 % $1,407 7,5,12 58 %
2020-07-06 07 - 242 : B 4.199 ETH
2020-06-27 07 - 221 : S 28.49 % $1,016 6,5,11 55 %
2020-04-16 07 - 172 : B 4.598 ETH
2020-02-29 07 - 217 : S 47.62 % $791 5,5,10 50 %
2020-01-12 07 - 147 : B 3.644 ETH
2019-11-18 07 - 178 : S -2.73 % $536 4,5,9 44 %
2019-11-01 07 - 183 : B 3.010 ETH
2019-09-23 07 - 201 : SL -4.29 % $551 4,4,8 50 %
2019-09-18 07 - 210 : B 2.740 ETH
2019-07-12 07 - 275 : S 63.69 % $575 4,3,7 57 %
2019-05-03 07 - 168 : B 2.093 ETH
2019-04-28 07 - 158 : S 29.51 % $352 3,3,6 50 %
2019-02-15 07 - 122 : B 2.225 ETH
2019-01-10 07 - 125 : SL -6.02 % $271 2,3,5 40 %
2018-12-29 07 - 133 : B 2.172 ETH
2018-05-22 07 - 641 : S 5.95 % $289 2,2,4 50 %
2018-04-21 07 - 605 : B 0.451 ETH
2018-02-02 07 - 922 : S 197.42 % $273 1,2,3 33 %
2017-11-11 07 - 310 : B 0.296 ETH
2017-10-09 07 - 297 : SL -4.50 % $92 0,2,2 0 %
2017-10-07 07 - 311 : B 0.309 ETH
2017-08-22 07 - 310 : SL -4.02 % $96 0,1,1 0 %
2017-08-21 07 - 323 : B 0.310 ETH

Koalafied RSI Decision PointsMomentum conditions as detailed in RSI : The Complete Guide by John Hayden
Decision points are conditions based on changes of these rsi values. Pauses in an uptrend, exiting high momentum values, breakouts and failures.
Touch up to an old script and so I thought I'd release. Although most people treat RSI as a reversion tool it is really a momentum indicator. Hopefully this script sparks thoughts about use-cases.
2:1 momentum is associated with RSI values of 66.67 and 33.33 respectfully. In an Uptrend an RSI value of 40 should not be broken and in a downtrend
a RSI value of 60 should not be exceeded. If so, then there is buying/selling pressure in the opposite direction (but not necessarily enough for a trend reversal).
Alternatively it may show the presence of HTF traders.
4:1 momentum (RSI values of 80/20) can be associated with extreme market conditions, typically thought of as being Overbought or Oversold.

All TimeFrame OscillatorsI have always fighted to understand the market direction because it looks different on different timeframes.
I wanted an indicator where I can see all the different timeframes at once.
This indicator shows already existing oscillators but not only in the current chart's timeframe, but all the most important higer timeframes at once.
I have started with the stoch, then added as many oscillators as I could.
Experimenting with this I have saw that confluence of 4H 1D and 1W Stoch can be very interesting and can highlight higher timeframe take profit areas and sometimes major tops/bottoms.
Also bounces can be interesting when a lower timeframe stoch is bounced or rejected from a higher one.
Oscillators:
Stoch - Stochastic Oscillator
SMI - Stochastic Momentum Index
Rsi - Relative Strength Index
StochRsi - Stochastic RSI
WaveTrend - Vumanchu alias Market Cypher Wave Trend line
CCI - Commodity Channel Index
CCIStoch - Stochastic CCI
Williams Percent Range - Williams %R
Norm. MACD - Normalized Moving Average Convergence Divergence
Norm. MACD Hist - Normalized MACD Histogramm
PVT - Normalized Price Volume Trend
MFI - Money Flow Index
CMF - Chaikin Money Flow
Chande Momentum - Chande Momentum
Volume - Normalized Volume
CandleValue - Vumanchu alias Market Cypher MoneyFlow
BBWP - Bollinger Band Width Percentile
Line Type
Smooth: lines are smoothed, but the actualy not closed values are not shown
Step: Step lines, the actually open timeframes are calculated as they closed at the current values
Plot Oscillator or it's Slope:
its possible to not plot the oscillator but it's slope
Print dots when:
Cross Up/Down oversold/overbougt level - best for most oscillators. for example when Stoch crosses above 20 or below 80
Cross os/ob and the one higher TF is about to cross - when it's crosses beolw 80 and the higher timeframe oscillator is still above ans sloping down
Cross above/below middle line - for example on RSI being above or below 50 can be interesting
Print triangles when:
All Slope Match - all visible timeframe lines are pointing up or down at the same time
All above/belove middle line - all visible lines are above or belove the middle line
All above/belove middle line and slope match - like the previous one and the slope direction is the same
All above/below oversold/overbougt - all lines are above or below os/ ob. this is the default. it can be a very important confluence
Lower TF in order - 5, 15, 30, 60 minute timeframes are in order.
Higher TF in order - 4H 1D 1W in order (like 4H above 1D abd 1D above 1W). can be interesting at RSI
4H-1D in order - 4H 1D in order .
Print triangles
Print all triangles - print all triangles when the condition is met
Print only first triangles - only show when the condition starts to met
Print only last triangles - small triangles when the condition met first, large when last. tis is the default.
Timeframes to show:
You can turn on/off different timeframs to show or not from the list below:
1m 5m 15m 30m 1H 4H D 5D W M
This is for experimenting/ understanding the market direction on multiple timeframes at once.
Don't take it's signals (and any other indicator's) as exact trade signals. use it as confirmation instead.
Any comments, insights, ideas are welcome.

Directional BiasA Directional Bias to stop me trading against the trend
Utilising EMA'S - I personally view on the 15M TF but it can be set on any
40/50/60 15Minute STF
and 13/35/50 - 30M 1H and 4H HTF
Mixing them together in direction and location to each other Gives a 6 colour system for keeping away from trading against trend
Dark Red Both Align - Sells Only do not take Buy Trades
Medium Red HTF and Dark Red Mix - Sells Only do not take Buy Trades
Light Red STF - if in a mix with Blanks and greens - Trade Both Directions - if 8 hours of solid Light Red ? Darker Red - do not take Buy Trades - Sells Only
Orange - Trading Both ways - No Directional Bias
Dark Green Both Align - Buys Only do not take Sell Trades
Medium Green HTF and Dark Green Mix - Buys Only do not take Sell Trades
Light Red STF - if in a mix with Blanks and greens - Trade Both Directions - if 8 hours of solid Light Green ? Darker Green - do not take Sell Trades - Buys Only
Alert Setting for Change of Direction included
I find this useful - to at least give me a pause for thought when I am about to trade against the trend - I hope you do to

FATL, SATL, RFTL, & RSTL Digital Signal Filter Smoother [Loxx]FATL, SATL, RFTL, & RSTL Digital Signal Filter (DSP) Smoother is is a baseline indicator with DSP processed source inputs
What are digital indicators: distinctions from standard tools, types of filters.
To date, dozens of technical analysis indicators have been developed: trend instruments, oscillators, etc. Most of them use the method of averaging historical data, which is considered crude. But there is another group of tools - digital indicators developed on the basis of mathematical methods of spectral analysis. Their formula allows the trader to filter price noise accurately and exclude occasional surges, making the forecast more effective in comparison with conventional indicators. In this review, you will learn about their distinctions, advantages, types of digital indicators and examples of strategies based on them.
Two non-standard strategies based on digital indicators
Basic technical analysis indicators built into most platforms are based on mathematical formulas. These formulas are a reflection of market behavior in past periods. In other words, these indicators are built based on patterns that were discovered as a result of statistical analysis, which allows one to predict further trend movement to some extent. But there is also a group of indicators called digital indicators. They are developed using mathematical analysis and are an algorithmic spectral system called ATCF (Adaptive Trend & Cycles Following). In this article, I will tell you more about the components of this system, describe the differences between digital and regular indicators, and give examples of 2 strategies with indicator templates.
ATCF - Market Spectrum Analysis Method
There is a theory according to which the market is chaotic and unpredictable, i.e. it cannot be accurately analyzed. After all, no one can tell how traders will react to certain news, or whether some large investor will want to play against the market like George Soros did with the Bank of England. But there is another theory: many general market trends are logical, and have a rationale, causes and effects. The economy is undulating, which means it can be described by mathematical methods.
Digital indicators are defined as a group of algorithms for assessing the market situation, which are based exclusively on mathematical methods. They differ from standard indicators by the form of analysis display. They display certain values: price, smoothed price, volumes. Many standard indicators are built on the basis of filtering the minute significant price fluctuations with the help of moving averages and their variations. But we can hardly call the MA a good filter, because digital indicators that use spectral filters make it possible to do a more accurate calculation.
Simply put, digital indicators are technical analysis tools in which spectral filters are used to filter out price noise instead of moving averages.
The display of traditional indicators is lines, areas, and channels. Digital indicators can be displayed both in the form of lines and in digital form (a set of numbers in columns, any data in a text field, etc.). The digital display of the data is more like an additional source of statistics; for trading, a standard visual linear chart view is used.
All digital models belong to the category of spectral analysis of the market situation. In conventional technical indicators, price indications are averaged over a fixed period of time, which gives a rather rough result. The use of spectral analysis allows us to increase trading efficiency due to the fact that digital indicators use a statistical data set of past periods, which is converted into a “frequency” of the market (period of fluctuations).
Fourier theory provides the following spectral ranging of the trend duration:
low frequency range (0-4) - a reflection of a long trend of 2 months or more
medium frequency range (5-40) - the trend lasts 10-60 days, thus it is referred to as a correction
high frequency range (41-130) - price noise that lasts for several days
The ATCF algorithm is built on the basis of spectral analysis and includes a set of indicators created using digital filters. Its consists of indicators and filters:
FATL: Built on the basis of a low-frequency digital trend filter
SATL: Built on the basis of a low-frequency digital trend filter of a different order
RFTL: High frequency trend line
RSTL: Low frequency trend line
Inclucded:
4 DSP filters
Bar coloring
Keltner channels with variety ranges and smoothing functions
Bollinger bands
40 Smoothing filters
33 souce types
Variable channels
