MTF Bollinger BandWidth [CryptoSea]The MTF Bollinger BandWidth Indicator is an advanced analytical tool crafted for traders who need to gauge market volatility and trend strength across multiple timeframes. This powerful indicator leverages the Bollinger BandWidth concept to provide a comprehensive view of price movements and volatility changes, making it ideal for those looking to enhance their trading strategies with multi-timeframe analysis.
Key Features
Multi-Timeframe Analysis: Allows users to monitor Bollinger BandWidth across various timeframes, providing a macro and micro perspective on market volatility.
Pivot Point Detection: Identifies crucial high and low pivot points, offering insights into potential support and resistance levels. Pivot points are dynamic and adjust based on the timeframe viewed, reflecting short-term fluctuations or longer-term trends.
Customizable Parameters: Includes options to adjust the length of the moving average, the standard deviation multiplier, and more, enabling traders to tailor the tool to their specific needs.
Dynamic Color Coding: Utilizes color changes to indicate different market conditions, aiding in quick visual assessments.
In the example below, notice how changes in BBW across different timeframes provide early signals for potential volatility increases or decreases.
How it Works
Calculation of BandWidth: Measures the percentage difference between the upper and lower Bollinger Bands, which expands or contracts based on market volatility.
High and Low Pivot Tracking: Automatically calculates and tracks the pivots in BBW values, which are critical for identifying turning points in market behavior. High and low levels will change depending on the timeframe, capturing distinct market behaviors from granular movements to broad trends.
Visual Alerts and Table Display: Highlights significant changes in BBW with visual alerts and provides a detailed table view for comparison across timeframes.
In the example below, BBW identifies a significant contraction followed by an expansion, suggesting a potential breakout.
Application
Strategic Market Entry and Exit: Assists traders in making well-informed decisions about when to enter and exit trades based on volatility cues.
Trend Strength Assessment: Helps in determining the strength of the prevailing market trend through detailed analysis of expansion and contraction periods.
Adaptable to Various Trading Styles: Suitable for day traders, swing traders, and long-term investors due to its customization capabilities and effectiveness across different timeframes.
The MTF Bollinger BandWidth Indicator is a must-have in the arsenal of traders who demand depth, accuracy, and responsiveness in their market analysis tools. Enhance your trading decisions by integrating this sophisticated indicator into your strategy to navigate the complexities of various market conditions effectively.
Cari dalam skrip untuk "弘历投教boll指标代码分析"

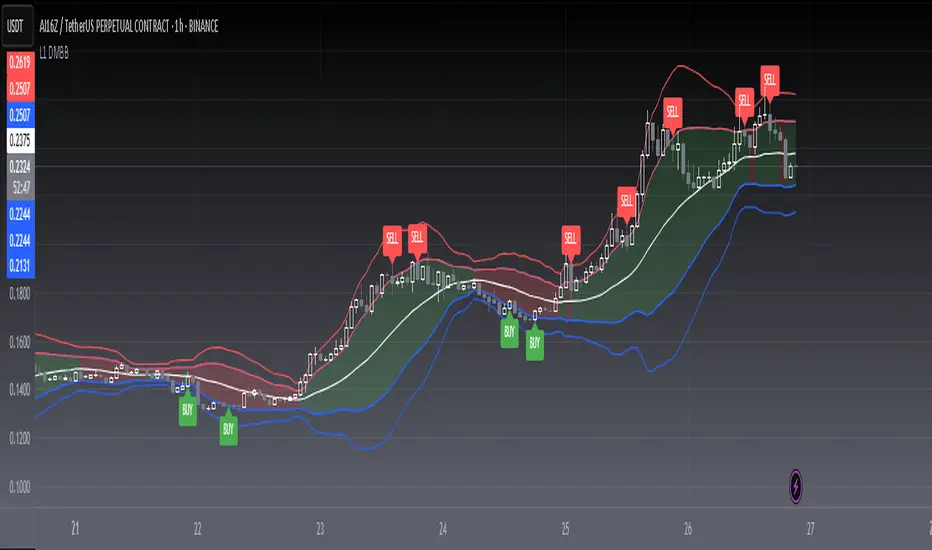
[blackcat] L1 Dynamic Multi-Layer Bollinger Bands## Overview
The L1 Dynamic Multi-Layer Bollinger Bands script is a custom indicator designed to provide a comprehensive analysis of price movements using Bollinger Bands, a widely-used technical analysis tool. The Bollinger Bands consist of a middle band being a simple moving average (SMA) of the close price, and an upper and lower band that are respectively 1.382 and 2.56 times the standard deviation of the close price over a 21-day period.
## How to Use
1. **Add the Indicator to Your Chart**: Click on the "Add to Chart" button in the Pine-Script editor. This will add the L1 Dynamic Multi-Layer Bollinger Bands to your chart.
2. **Interpreting the Bands**: The Bollinger Bands are plotted on your chart. The middle band is the 21-day SMA of the close price. The upper band is 1.382 times the standard deviation above the middle band, and the lower band is 1.382 times the standard deviation below the middle band.
3. **Analyzing the Bands**: When the price moves above the upper band, it is considered an overbought condition. When the price moves below the lower band, it is considered an oversold condition. These are potential areas of support and resistance.
4. **Multi-Layer Structure**: The script also calculates two additional bands, `up2` and `loow2`, which are respectively 2.56 times the standard deviation above and below the middle band. These bands provide a more layered perspective on the volatility of the price.
5. **Color Coding**: The area between the upper and lower bands is filled with a color that indicates the direction of the price movement. Green indicates an upward trend, and red indicates a downward trend.
## Disclaimer
The information provided by this script is for educational purposes only and should not be used as the sole basis for any trading decisions. Trading involves risk, and it is possible to lose money when trading stocks and other financial instruments. Use this script at your own risk.
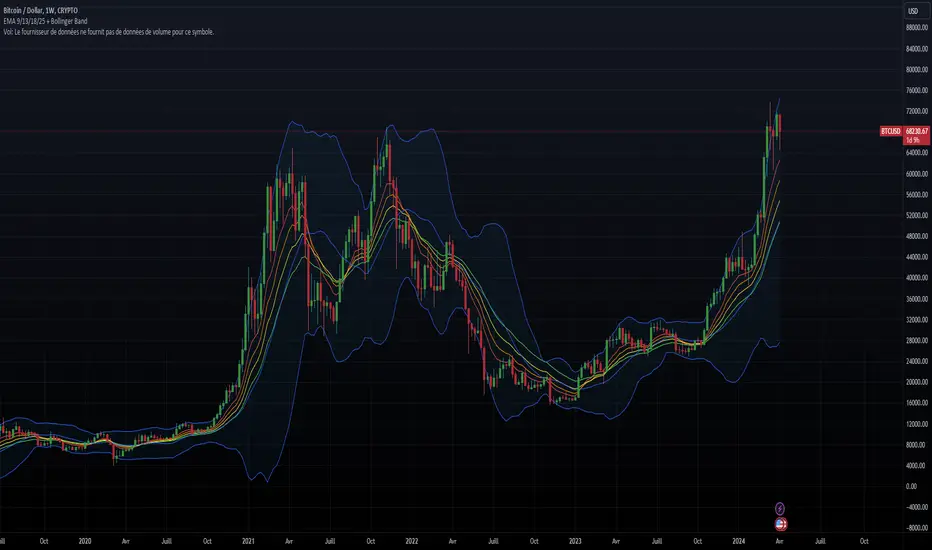
EMA 9/13/18/25 + Bollinger BandThe indicator combines two components: Exponential Moving Averages (EMAs) and Bollinger Bands.
Exponential Moving Averages (EMAs): The indicator calculates four EMAs with different periods: 9, 13, 18, and 25. An Exponential Moving Average is a type of moving average that places a greater weight and significance on the most recent data points. As the name suggests, it's an average of the asset's price over a certain period, with recent prices given more weight in the calculation, making it more responsive to recent price changes.
Bollinger Bands: Bollinger Bands consist of a simple moving average (the basis) and two standard deviations plotted away from it. The standard deviations are multiplied by a factor (usually 2) to determine the distance from the basis. These bands dynamically adjust themselves based on recent price movements. The upper band represents the highest price level reached in the given period, while the lower band represents the lowest price level.
Combining these components provides traders with insights into both trend direction and volatility. The EMAs help identify trends by smoothing out price data, while the Bollinger Bands offer insights into volatility and potential price reversal points. Traders often use the crossovers of EMAs and interactions with Bollinger Bands to make trading decisions. For example, when the price touches the upper Bollinger Band, it may indicate overbought conditions, while touching the lower band may suggest oversold conditions. Additionally, crossovers of EMAs (such as the shorter-term EMA crossing above or below the longer-term EMA) may signal changes in trend direction.
arpit bollinger bandStrategy Overview:
This strategy utilizes Bollinger Bands based on a 20-period Exponential Moving Average (EMA) with a standard deviation multiplier of 1.5. It is designed to generate early trading signals based on the relationship between the price action and the Bollinger Bands.
Bollinger Bands Calculation:
The upper Bollinger Band is calculated as the 20-period EMA of the closing prices plus 1.5 times the standard deviation of the same period.
The lower Bollinger Band is calculated as the 20-period EMA of the closing prices minus 1.5 times the standard deviation.
Entry Criteria:
Buy Signal: A buy signal is generated when the current candle's high exceeds the high of the candle two periods ago, which had closed below the lower Bollinger Band. This condition implies an anticipation of a bullish reversal.
Sell Signal: A sell signal is generated when the current candle's low falls below the low of the candle two periods ago, which had closed above the upper Bollinger Band. This condition suggests an anticipated bearish reversal.
Stop Loss and Take Profit:
The stop loss for a buy order is set slightly below the low of the current candle, and for a sell order, it is set slightly above the high of the current candle.
The take profit level is determined based on a predefined risk-reward ratio of 1:3. This means the take profit target is set at a distance three times greater than the distance between the entry price and the stop loss.
Risk Management:
The strategy includes an input option to adjust the risk-reward ratio, allowing for flexibility in managing the trade's potential risk versus reward.
Trade Execution:
The strategy automatically plots the buy and sell signals on the chart and executes the trades according to the defined conditions. It also visually indicates the stop loss levels for each trade.
Usage Notes:
This strategy is designed for use in the TradingView platform using Pine Script version 5.
It is important to backtest and paper trade the strategy before using it in live trading to understand its performance characteristics and risk profile.
The strategy should be used as part of a comprehensive trading plan, considering market conditions, trader risk tolerance, and personal trading goals.

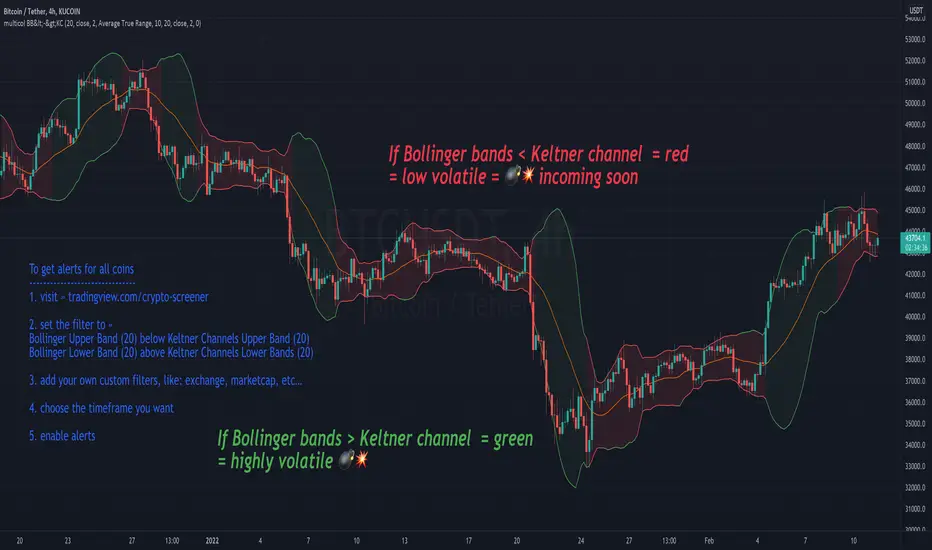
multicolor Bollinger Bands (BB <-> KC)Concept:
After every low volatile phase comes a high volatile phase and after every high volatile phase comes a low volatile phase.
If the Bollinger bands are smaller then the Keltner channel (colored red), the price action is low in volatility… meaning a breakout (colored green) will happen soon.
If Bollinger band is bigger than the Keltner channel = green
If Bollinger band is smaller than the Keltner channel = red
Displaying the Keltner Channel is optional
If multicolor BB is disabled, BB color = blue (default color)
Customise colors to your liking under settings -> style
-----------------------------------
To get alerts for all coins
1. visit » tradingview.com/crypto-screener
2. set the filter to »
Bollinger Upper Band (20) below Keltner Channels Upper Band (20)
Bollinger Lower Band (20) above Keltner Channels Lower Bands (20)
3. add your own custom filters, like: exchange, marketcap, etc…
4. choose the timeframe you want
5. enable alerts
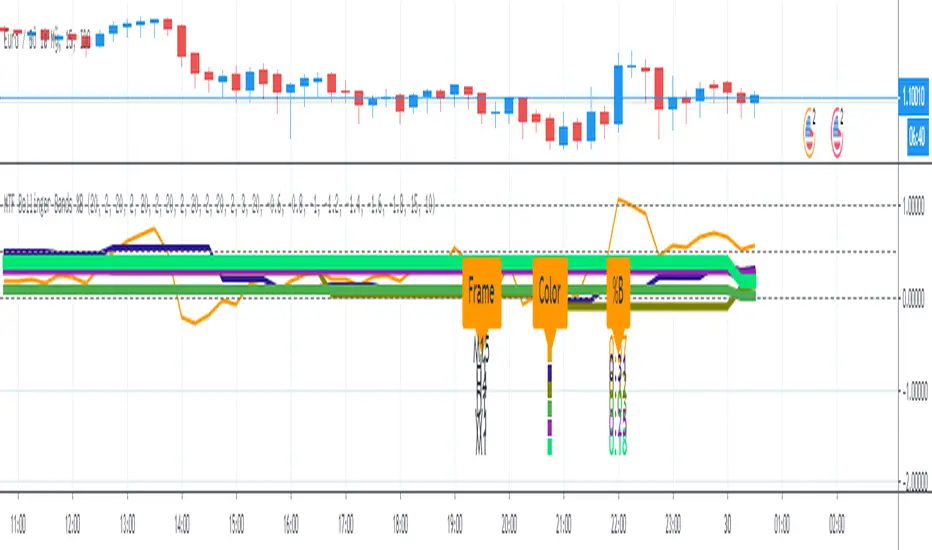
MTF Bollinger Bands %BMulti Time Frame (MTF) Bollinger Bands %B option:
1. On/ Off Bollinger Bands %B - M15 (15-Minute)
2. On/Off Bollinger Bands %B - H1 (1-Hour)
3. On/Off Bollinger Bands %B - H4 (4 Hour)
4. On/Off Bollinger Bands %B - D1 (Daily)
5. On/Off Bollinger Bands %B - W1 (Weekly)
6. On/Off Bollinger Bands %B - M1 (Monthly)
7. On/Off Panel Info: Color note & %B value
Range Delta Heiken Ashi Bollinger|Buy/Sell |OB & OS CandlesPurpose: Mathematically represent buying and selling zones for Daily/ Weekly Traders
Indicator: Calculates moving average of the candle's body with respect to the daily trading range
Buy and Sell Signals: Calculates Bollinger Range with Max/Min and Buy/Sell Bollinger signals
Overbought and Oversold Signals: Candlesticks show overbought and oversold conditions
Level of Difficulty: This indicator was written to make life easier. Follow the Rules and anyone can use it.
Rule 1: Buy when candlestick is below "purple" line
Rule 2: Sell when candlestick is above "blue" line
Rule 3: Add bollinger bands to your currency chart
Rule 4: Confirm indicator bollinger bands with currency chart's bollinger bands
Rule 5: Trade in direction of trend
Rule 6: As with all trading; no indicators are fool proof. Please trade responsibly.
****Full Customization for you****
Suggestion 1: Add bollinger bands to currency chart to improve probability
Suggestion 2: Trade the direction of Trend
Suggestion 3: This indicator works very well with Ranged Markets (or use Suggestion 2)
Disclaimer 1: This Indicator words best on Daily and Weekly time frames
Disclaimer 2: Enjoy the Indicator and feel free to ADD COMMENTS; I worked very hard for you and me :)

Scalping, Swing Pro: Urban Towers + Bollinger(0.5)+ WMA by KidevThis indicator combines narrow Bollinger Bands (σ = 0.5) with a Weighted Moving Average (WMA-96) to provide traders with a reliable framework for identifying both short-term scalps and medium-term swing setups.
Bollinger Bands (0.5σ):
Traditional Bollinger Bands at 2σ cover ~95% of price movement, while 0.5σ bands narrow the focus to ~50% of price activity. This tighter structure makes them ideal for detecting volatility contractions, consolidations, and early breakout signals.
WMA-96 as Trend Reference:
The 96-period WMA acts as a slower, more stable directional guide. Unlike shorter WMAs, this longer setting filters noise and serves as a reference line for the dominant trend. Traders can use it as an anchor for intraday or swing positions.
Scalping & Swing Benefits:
Price holding above the WMA-96 while staying near the upper 0.5σ band often signals strength.
Contractions (squeezes) in the 0.5σ band followed by expansion frequently mark breakout zones.
Pullbacks toward the WMA-96 combined with band signals can act as re-entry or risk-defined trade areas.
This script provides a balanced view of momentum and stability — the 0.5σ bands reveal short-term volatility shifts, while the WMA-96 grounds the trader in the prevailing trend.

Session Pivots + EMA20/50 + Bollinger BandsMulti-tool indicator combining session pivots, EMA trend filters, Bollinger Bands, and alerts for intraday trading.
📌 Description
One of the biggest advantages of this indicator is that it supports TradingView’s ALERT system, so traders can be notified the moment price crosses the daily/session pivot level. This allows faster decision-making without constant chart watching.
This script combines three powerful tools into a single indicator:
Session Pivot Levels (with Support/Resistance): Automatically calculates pivot, R1–R3 and S1–S3 levels based on the previous trading session (London, New York, Asia, or custom). Levels are plotted with clean labels and connector lines so you always see the exact price values ahead of time.
EMA Trend Filters (20 & 50): Tracks short- and medium-term market direction with two popular exponential moving averages, helping confirm entries and exits.
Bollinger Bands (fully customizable): Adds volatility bands with choice of SMA, EMA, SMMA, WMA, or VWMA for the middle line, plus adjustable standard deviation and offset.
✅ Key Features
Auto-detects London, New York, and Asian sessions or set your own custom session.
Displays up to 3 levels of support and resistance from the previous session.
Clean label display with customizable theme options (Dark, Light, Custom).
Alerts included: Get notified instantly when price crosses above or below the Pivot.
EMA20/50 trend confirmation built-in.
Bollinger Bands with multiple moving average types and volatility settings.
Works for Forex, Crypto, Indices, Commodities — optimized for intraday & scalping.
This makes it a complete intraday toolkit, reducing the need to load multiple separate indicators.
📄 Full documentation available here: [ link ]

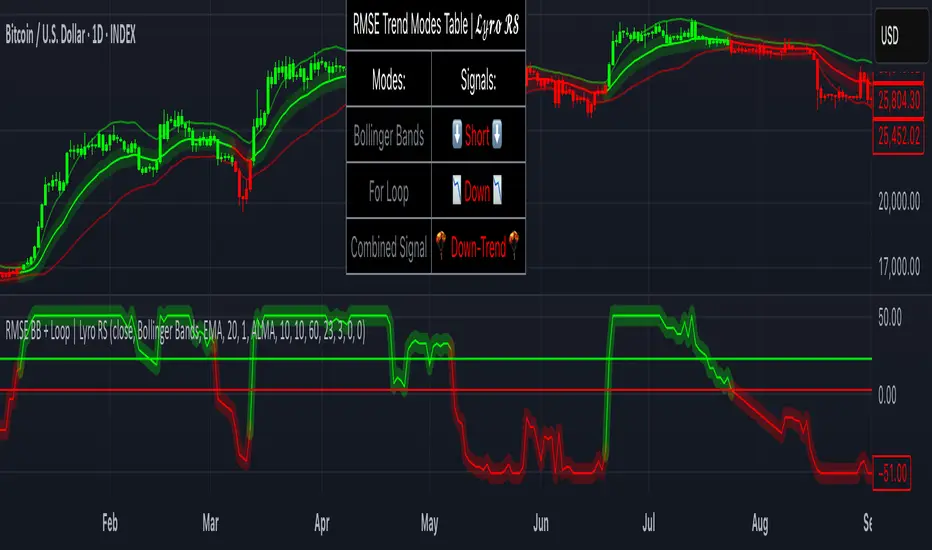
RMSE Bollinger Bands + Loop | Lyro RSRMSE Bollinger Bands + Loops
Overview
The RMSE Bollinger Bands + Loops is a sophisticated technical analysis tool designed to identify and quantify market trends by combining dynamic moving averages with statistical measures. This indicator employs a multi-model approach, integrating Bollinger-style RMSE bands, momentum scoring, and a hybrid signal system to provide traders with adaptive insights across varying market conditions.
Indicator Modes
Bollinger-style RMSE Bands: this mode calculates dynamic volatility bands around the price using the following formula:
Upper Band = Dynamic Moving Average + (RMSE × Multiplier)
Lower Band = Dynamic Moving Average - (RMSE × Multiplier)
These bands adjust to market volatility, helping identify potential breakout or breakdown points.
For-Loop Momentum Scoring, momentum is assessed by analyzing recent price behavior through a looping mechanism. A rising momentum score indicates increasing bullish strength, while a declining score suggests growing bearish momentum.
Hybrid Combined Signal: this mode assigns a directional score to the other two modes:
+1 for bullish (green)
–1 for bearish (red)
An average of these scores is computed to generate a combined signal, offering a consolidated market trend indication.
Practical Application
Signal Interpretation: A buy signal is generated when both the RMSE Bands and For-Loop Momentum Scoring align bullishly. Conversely, a sell signal is indicated when both are bearish.
Trend Confirmation: The Hybrid Combined Signal provides a consolidated view, assisting traders in confirming the prevailing market trend.
Note: Always consider additional technical analysis tools and risk management strategies when making trading decisions.
⚠️Disclaimer
This indicator is a tool for technical analysis and does not provide guaranteed results. It should be used in conjunction with other analysis methods and proper risk management practices. The creators of this indicator are not responsible for any financial decisions made based on its signals.
Mad Trading Scientist - Guppy MMA with Bollinger Bands📘 Indicator Name:
Guppy MMA with Bollinger Bands
🔍 What This Indicator Does:
This TradingView indicator combines Guppy Multiple Moving Averages (GMMA) with Bollinger Bands to help you identify trend direction and volatility zones, ideal for spotting pullback entries within trending markets.
🔵 1. Guppy Multiple Moving Averages (GMMA):
✅ Short-Term EMAs (Blue) — represent trader sentiment:
EMA 3, 5, 8, 10, 12, 15
✅ Long-Term EMAs (Red) — represent investor sentiment:
EMA 30, 35, 40, 45, 50, 60
Usage:
When blue (short) EMAs are above red (long) EMAs and spreading → Strong uptrend
When blue EMAs cross below red EMAs → Potential downtrend
⚫ 2. Bollinger Bands (Volatility Envelopes):
Length: 300 (captures the longer-term price range)
Basis: 300-period SMA
Upper & Lower Bands:
±1 Standard Deviation (light gray zone)
±2 Standard Deviations (dark gray zone)
Fill Zones:
Highlights standard deviation ranges
Emphasizes extreme vs. normal price moves
Usage:
Price touching ±2 SD bands signals potential exhaustion
Price reverting to the mean suggests pullback or re-entry opportunity
💡 Important Note: Use With Momentum Filter
✅ For superior accuracy, this indicator should be combined with your invite-only momentum filter on TradingView.
This filter helps confirm whether the trend has underlying strength or is losing momentum, increasing the probability of successful entries and exits.
🕒 Recommended Timeframe:
📆 1-Hour Chart (60m)
This setup is optimized for short- to medium-term swing trading, where Guppy structures and Bollinger reversion work best.
🔧 Practical Strategy Example:
Long Trade Setup:
Short EMAs are above long EMAs (strong uptrend)
Price pulls back to the lower 1 or 2 SD band
Momentum filter confirms bullish strength
Short Trade Setup:
Short EMAs are below long EMAs (strong downtrend)
Price rises to the upper 1 or 2 SD band
Momentum filter confirms bearish strength

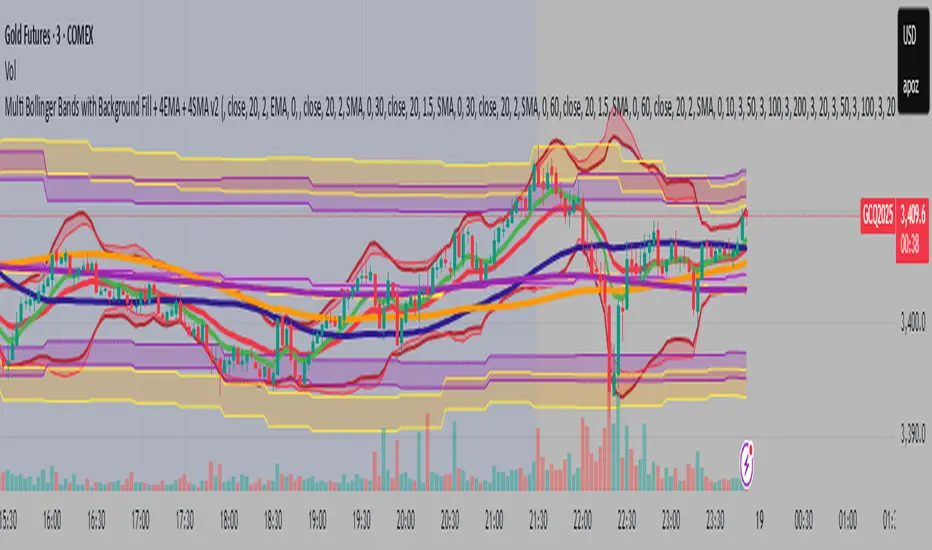
Multi Bollinger Bands with Background FillMulti Bollinger Bands with Background Fill
多組帶狀背景布林通道
This indicator plots six independent Bollinger Bands channels on the price chart, each fully configurable with customizable period length, standard deviation, and colors for upper, lower, and middle bands. Users can choose to display or hide each channel and its middle band independently.
A distinctive feature of this tool is the option to enable colored background fills between paired Bollinger Bands (channels 1&2, 3&4, and 5&6) to visually highlight volatility zones, improving the clarity of price action and aiding in multi-timeframe volatility analysis.
Key Features:
Six independent Bollinger Bands channels with separate visibility toggles.
Adjustable length and standard deviation for each channel.
Option to display or hide the middle band (basis) for each channel.
Unique colored background fills between paired upper and lower bands for enhanced visual interpretation.
Custom color settings for each band and background for better differentiation.
This indicator is designed for traders looking for advanced multi-layered volatility insights and clearer visual guidance when analyzing price behavior across different timeframes. It is suitable for various trading strategies including trend analysis and volatility-based setups.
Buy sell ATR Bollinger [vivekm8955]Buy Sell ATR Bollinger
This script combines Bollinger Bands with an optional ATR-based filter to generate high-probability Buy/Sell signals with trend confirmation.
🔹 Buy Signal: Price breaks above the upper Bollinger Band and trend flips bullish.
🔹 Sell Signal: Price drops below the lower Bollinger Band and trend flips bearish.
🔹 ATR Filter (Optional): Smoothens signals by filtering out weak breakouts based on volatility.
🔹 Visual Aids: Color-coded trend bands (Yellow for bullish, Red for bearish) with clean BUY/SELL labels.
🔹 Alerts Enabled: Get notified on signal generation.
✅ Suitable for intraday and swing traders
✅ Works across all timeframes
✅ Fully customizable inputs
trade safe with risk management! Happy trading!!

Moving Volume-Weighted Avg Price, % Channel, BBsThis script includes:
- Moving Volume-Weighted Average Price line.
- User-defined % band above and below, very useful for "breakout" signals, and mentally adjusting to the magnitude of price swings when viewing an automatic scale on the price axis.
- Volume-Weighted Bollinger Bands, which are more sensitive to volume.
More detail:
- This is like TV's basic VWAP in concept, except the major flaw in that is that it has reset periods that you can't override, and the volume is cumulative until the next hard reset. The 'reset' is OK for securities trading, that resets every day anyway. But not for crypto - and not if/when securities trading goes 24/7. Also, the denominator accumulating over the entire period is also *not* OK, because then what is shown means something different as the day progresses - which kind of makes it useless. In other words, it starts out very sensitive to volume, and gets progressively more numb to it as they day progresses, and starts flattening out.
- This fixes both problems, by using a user-definable moving window for the average. Essentially combining SMA with volume-weighting.
- You may also find an invaluable trading aid, in the % bands above and below.
- What can optionally be shown is standard deviation bands, aka Bollinger bands. The advantage over regular BB is that it's volume-weighted. Since it is already calculated on a moving average, the period for the standard deviation has been shortened by default, and the magnitude increased, to better approximate regular Bollinger Bands - but it's still more responsive to volume.

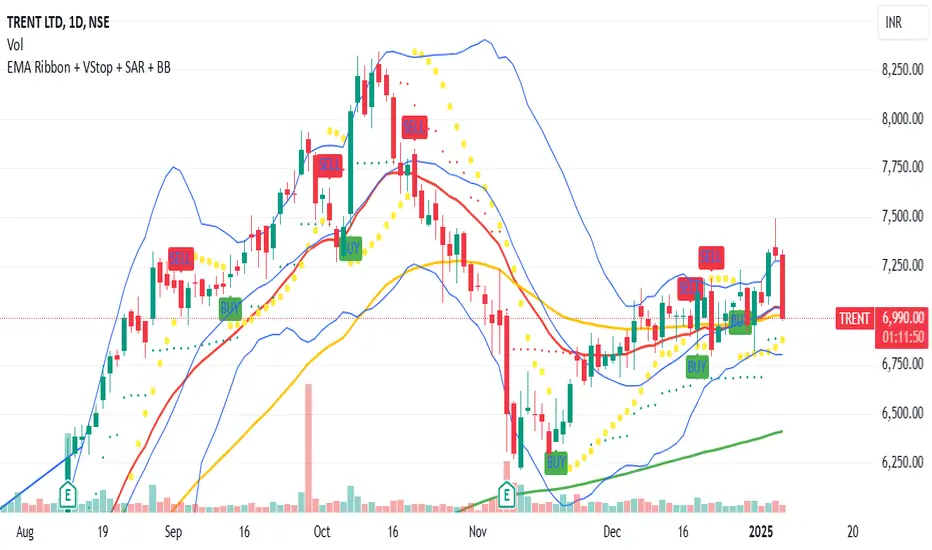
Aura Vibes EMA Ribbon + VStop + SAR + Bollinger BandsThe combination of Exponential Moving Averages (EMA), Volatility Stop (VStop), Parabolic SAR (PSAR), and Bollinger Bands (BB) offers a comprehensive approach to technical analysis, each serving a distinct purpose:
Exponential Moving Averages (EMA): EMAs are used to identify the direction of the trend by smoothing price data. Shorter-period EMAs react more quickly to price changes, while longer-period EMAs provide a broader view of the trend.
Volatility Stop (VStop): VStop is a dynamic stop-loss mechanism that adjusts based on market volatility, typically using the Average True Range (ATR). This allows traders to set stop-loss levels that accommodate market fluctuations, potentially reducing the likelihood of premature stop-outs.
Parabolic SAR (PSAR): PSAR is a trend-following indicator that provides potential entry and exit points by plotting dots above or below the price chart. When the dots are below the price, it suggests an uptrend; when above, a downtrend.
Bollinger Bands (BB): BB consists of a middle band (typically a 20-period simple moving average) and two outer bands set at standard deviations above and below the middle band. These bands expand and contract based on market volatility, helping traders identify overbought or oversold conditions.
Integrating these indicators can enhance trading strategies:
Trend Identification: Use EMAs to determine the prevailing market trend. For instance, a short-term EMA crossing above a long-term EMA may signal an uptrend.
Entry and Exit Points: Combine PSAR and BB to pinpoint potential entry and exit points. For example, a PSAR dot appearing below the price during an uptrend, coinciding with the price touching the lower Bollinger Band, might indicate a buying opportunity.
Risk Management: Implement VStop to set adaptive stop-loss levels that adjust with market volatility, providing a buffer against market noise.
By thoughtfully combining these indicators, traders can develop a robust trading system that adapts to various market conditions.
XAU/USD Strategy with Correct ADX and Bollinger Bands Fill1. *Indicators Used*:
- *Exponential Moving Averages (EMAs)*: Two EMAs (20-period and 50-period) are used to identify the trend direction and potential entry points based on crossovers.
- *Relative Strength Index (RSI)*: A momentum oscillator that measures the speed and change of price movements. It identifies overbought and oversold conditions.
- *Bollinger Bands*: These consist of a middle line (simple moving average) and two outer bands (standard deviations away from the middle). They help to identify price volatility and potential reversal points.
- *Average Directional Index (ADX)*: This indicator quantifies trend strength. It's derived from the Directional Movement Index (DMI) and helps confirm the presence of a strong trend.
- *Average True Range (ATR)*: Used to calculate position size based on volatility, ensuring that trades align with the trader's risk tolerance.
2. *Entry Conditions*:
- *Long Entry*:
- The 20 EMA crosses above the 50 EMA (indicating a potential bullish trend).
- The RSI is below the oversold level (30), suggesting the asset may be undervalued.
- The price is below the lower Bollinger Band, indicating potential price reversal.
- The ADX is above a specified threshold (25), confirming that there is sufficient trend strength.
- *Short Entry*:
- The 20 EMA crosses below the 50 EMA (indicating a potential bearish trend).
- The RSI is above the overbought level (70), suggesting the asset may be overvalued.
- The price is above the upper Bollinger Band, indicating potential price reversal.
- The ADX is above the specified threshold (25), confirming trend strength.
3. *Position Sizing*:
- The script calculates the position size dynamically based on the trader's risk per trade (expressed as a percentage of the total capital) and the ATR. This ensures that the trader does not risk more than the specified percentage on any single trade, adjusting the position size according to market volatility.
4. *Exit Conditions*:
- The strategy uses a trailing stop-loss mechanism to secure profits as the price moves in the trader's favor. The trailing stop is set at a percentage (1.5% by default) below the highest price reached since entry for long positions and above the lowest price for short positions.
- Additionally, if the RSI crosses back above the overbought level while in a long position or below the oversold level while in a short position, the position is closed to prevent losses.
5. *Alerts*:
- Alerts are set to notify the trader when a buy or sell condition is met based on the strategy's rules. This allows for timely execution of trades.
### Summary
This strategy aims to capture significant price movements in the XAU/USD market by combining trend-following (EMAs, ADX) and momentum indicators (RSI, Bollinger Bands). The dynamic position sizing based on ATR helps manage risk effectively. By implementing trailing stops and alert mechanisms, the strategy enhances the trader's ability to act quickly on opportunities while mitigating potential losses.

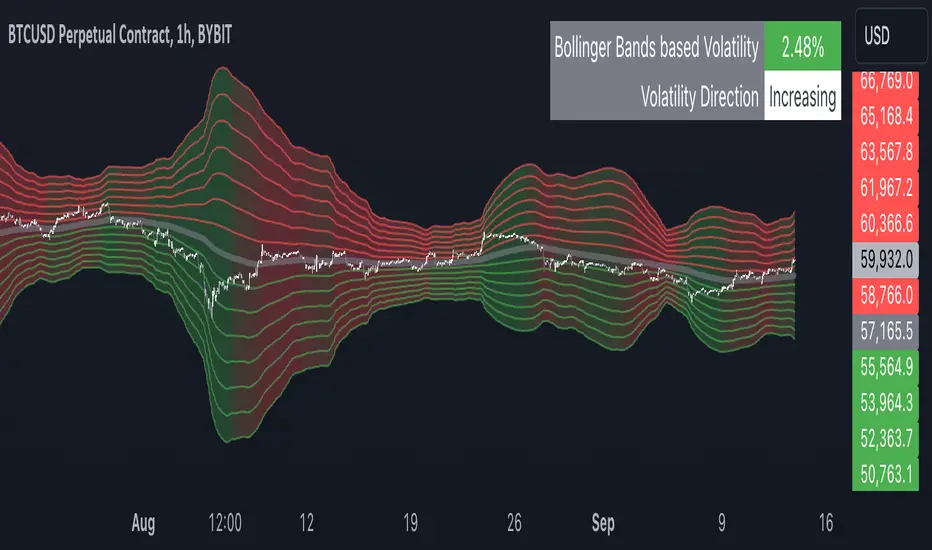
Multiple Bollinger Bands + Volatility [AlgoTraderPro]This indicator helps traders visualize price ranges and volatility changes. Designed to assist in identifying potential consolidation zones, the indicator uses multiple layers of Bollinger Bands combined with volatility-based shading. This can help traders spot periods of reduced price movement, which are often followed by breakouts or trend reversals.
█ FEATURES
Multiple Bollinger Bands: Displays up to seven bands with customizable standard deviations, providing a layered view of price range activity.
Volatility Measurement: Tracks changes in Bollinger Band width to display volatility percentage and direction (increasing, decreasing, or neutral).
Volatility Shading: Uses color-coded shading between the outermost bands to indicate changes in volatility, helping to visualize potential consolidation zones.
Customizable Inputs: Modify lookback periods, moving average lengths, and standard deviations for each band to tailor the analysis to your strategy.
Volatility Table: Displays a table on the chart showing real-time volatility data and direction for quick reference.
█ HOW TO USE
Add the Indicator: Apply it to your TradingView chart.
Adjust Settings: Customize the Bollinger Bands’ parameters to suit your trading timeframe and strategy.
Analyze Consolidation Zones: Use the multiple bands and volatility shading to identify areas of reduced price activity, signaling potential breakouts.
Monitor Volatility: Refer to the volatility table to track real-time shifts in market volatility.
Use in Different Markets: Adapt the settings for various assets and timeframes to assess market conditions effectively.
█ NOTES
• The indicator is useful in consolidating markets where price movement is limited, offering insights into potential breakout areas.
• Adjust the settings based on asset and market conditions for optimal results.
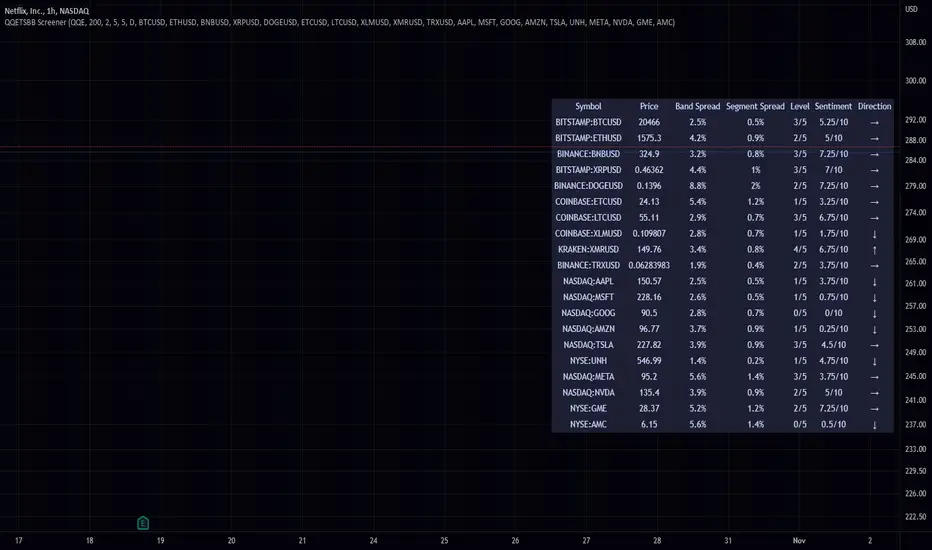
QQE Student's T-Distribution Bollinger Bands ScreenerThis script scans 20 custom symbols and displays the QQE Students T-Distribution Bollinger Bandwidth as a percentage, the quarter segment percentage, a score that tells you what segment of the band the price is in, and what direction the market is going in. This is useful because it can tell you how volatile a market is and how much reward is in the market. It also tells you what direction the market is going in so you can pick a symbol that has the best looking reward. I really hope that this script complements the group of indicators I have made so far. Here is a list of the other two indicators related to this script.
Please enjoy!
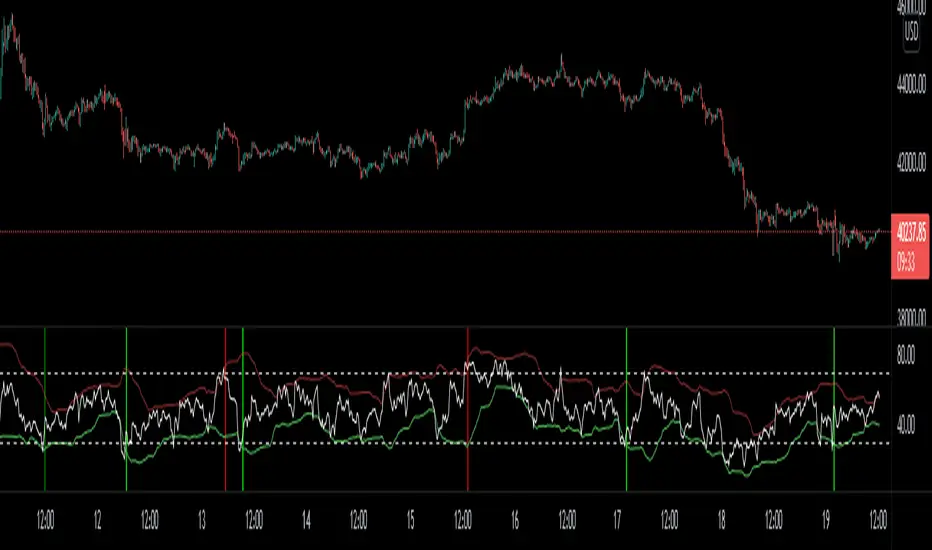
RSI cross Bollinger Band indicatorThis is a RSI cross Bollinger Band indicator that paints bgcolor short and long signals when the RSI cross's up through the lower bollinger band ( Long ) or cross's down through the upper bollinger band ( Short )
I have also added alerts for the signals
please note there is still noise with this, you need to use with something else like MFI or VFI
Keltner+Bollinger Squeeze [kingthies_]Keltner-Bollinger-Combo Squeeze
As you likely know, the bollinger squeeze comes from the bband indicator, a classic indicator in all forms of technical analysis, effectively measuring volatility of a given assets price movement.
There are different forms of the squeeze here on tradingview, and I've combined the Bollinger band indicator in my own strategy, to the alternative and similar appearing Keltner channels. The two work incredibly well together and I've used them in my analysis for years now as my core approach to understanding the technical side of the markets.
This tool will show users the result that i typically look for when assessing for potential volatile moves in the near future for an asset, and will highlight the chart + send an alert when the chart is something to look at and the indicator suggests incoming volatility may be in the near future.
The users will still need to assess themselves whether the squeeze they see is a bullish or bearish leaning, but the overall idea is to set it and forget it with the alert clause thats added in.
Personally i enjoy this with Heikin ashi inputs but use whichever preference you have, and all timeframes + tickers should apply here.
Cheers

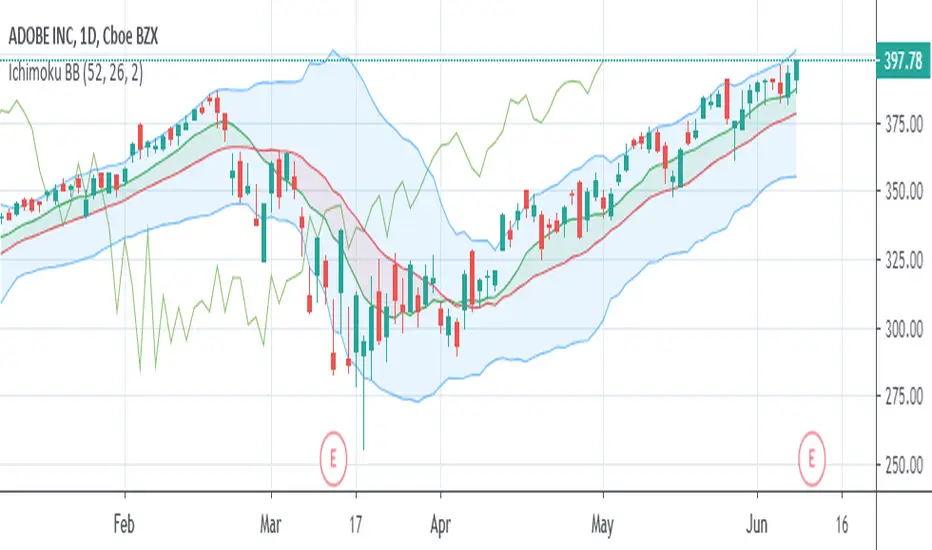
Ichimoku Bollinger BandsThis indicator is a standard set of Bollinger Bands with some functionality borrowed from Ichimoku Kinko Hyo. There's an added SMA (9) that gets shaded green when it's above the basis line of the Bollinger Bands (SMA 20) and turns red when it falls below. No, it's not remotely where the Ichimoku Cloud would appear, but it's a decent trend indicator regardless.
You also get Ichimoku's Lagging Span to help verify the strength of the trend. When the Lagging Span rises above the price history, the trend is up. When the Lagging Span rises above the Bollinger Bands, the uptrend is super strong. And the opposite conditions signal downtrends.
Moving Averages with Bollinger BandsContains moving averages as well as Bollinger bands
7 sma, 2 ema, VWAP, 3 hma, standard Bollinger bands
Wanted moving averages and the Bollinger Bands in a single indicator
Some of the study code copied and pasted from "7MA" (bogdan_black) and "Triple Hull Moving Average" (cmkirkham)

Price Action + Bollinger Strategy Simple Price Action + Bollinger Band Strategy
Buy Setup --------
- Price closes below Bollinger Band
- Last candle closes in green, confirming bulls have returned
- Buy trade is taken
Short Setup --------
- Price closes above Bollinger Band
- Last candle closes in red , confirming bears have returned
- Short trade is taken
Strategy open for suggestions and updation
